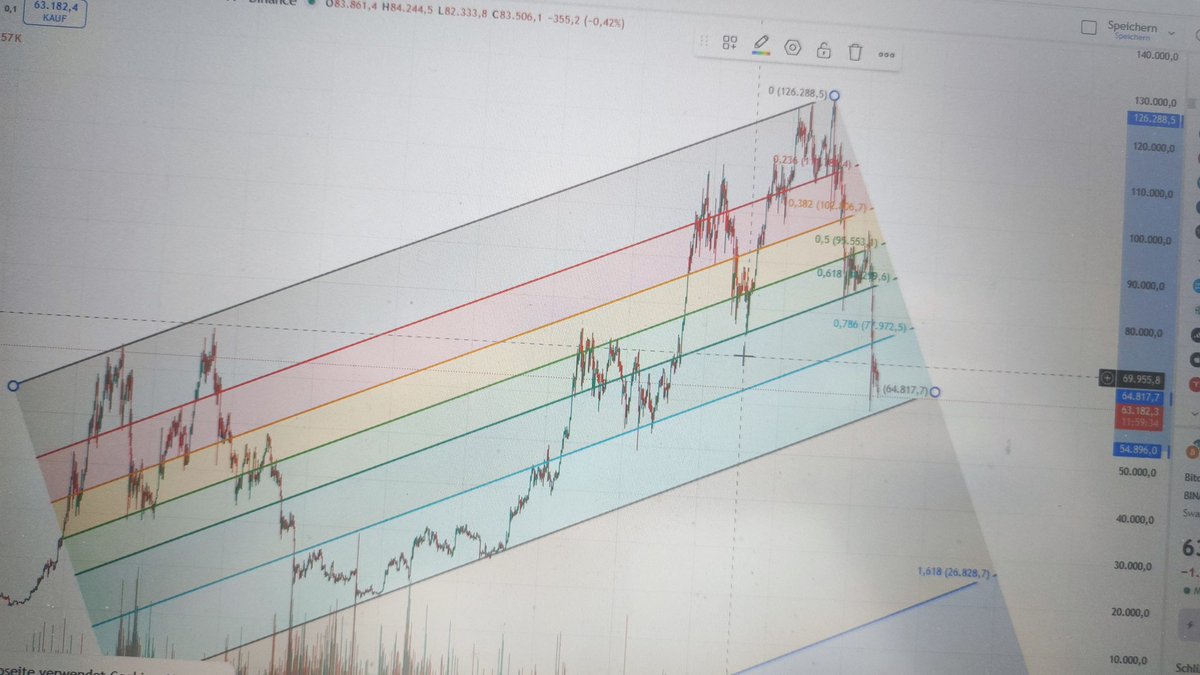
@matthughes13 As you are measuring an uptrend shouldn't the high point be 0 and the low point be 1?
It's the 0.75/0.786 zone imo. Just take a look at the golden pocket.
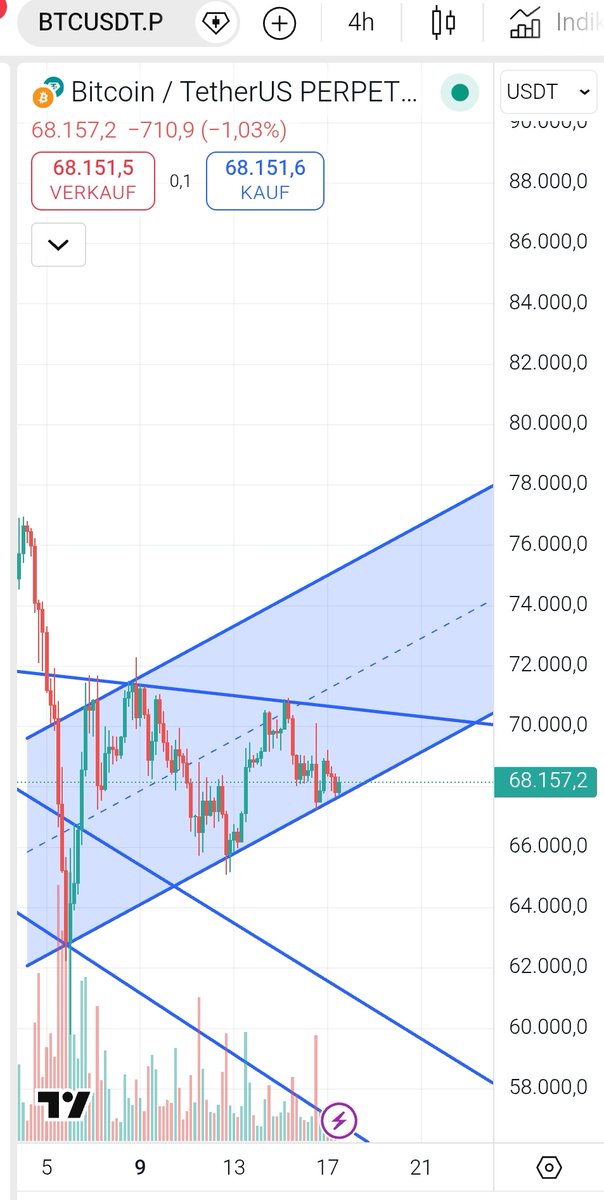
@EtherRawl Did some quickndirty drawing inspired by your lines. Did you take a look at it using the fib channels? Imo it's going to be very ugly if $btc will break brake lower line.
@SailorManCrypto Keep it up and maintain your style. Many of us know that you've been at it for a long time and are now slowly but surely reaping the rewards of your hard work in terms of attention. Saluti alla Lombardia.
$BTC
Video elaboration on BTC's macro bearmarket bottoming formation.
In this video I don't tell you what I want to happen for BTC, I tell and teach what NEEDS to happen in order for price to deliver macro bullish reversals.
I advice you guys to watch the entire video, take notes and be on the correct side of the market from a HTF expectational orderflow perspective.
Later I will write an in-depth post with different phases and potential playbooks within, but first I wanted to share my thoughts via video so every single one of you will understand the post better later on.
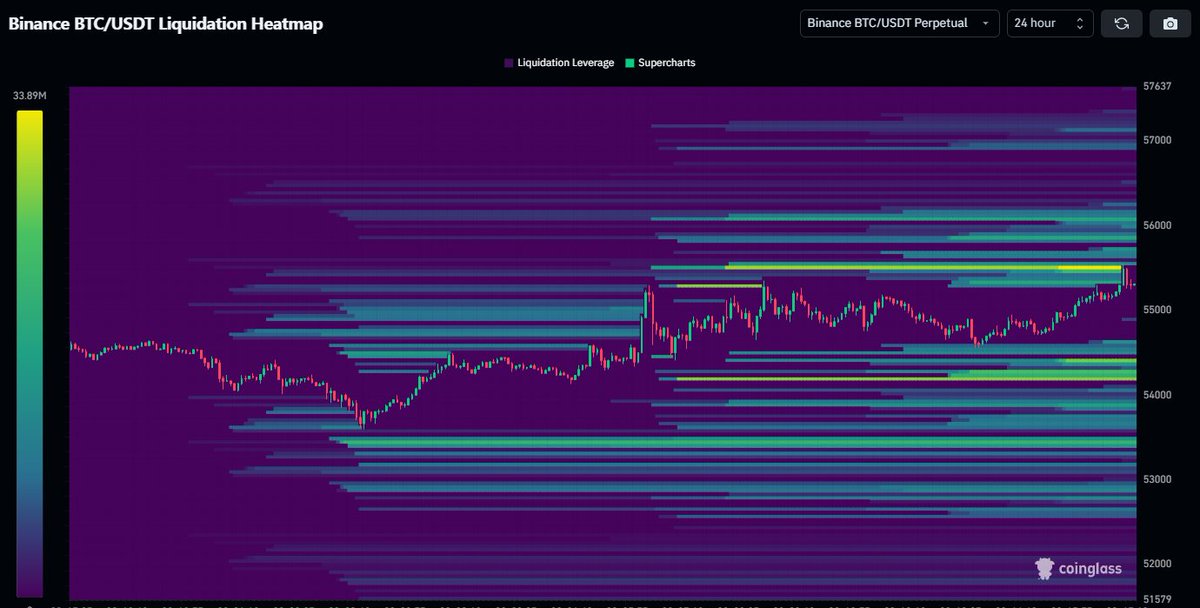
@OffendedRadical@Axel_bitblaze69 Model 2 seems to be off somehow. The overall leverage amount in Model 2 is way lower than Model 1. @coinglass_com said M1 would be high leverage and M2 all leverage. But the math doesn't match. Because of that there's clusters glowing in M2 even if their size isn't that big.
Hello @coinglass_com can you explain why the overall leverage amount in Model 1 seems to be higher than Model 2?
According to your explanations Model 2 should be Model 1 + low leverage but the math doesn't match using the $BTC symbol.
Many guys ask me about the difference between liquidation heatmap model 1 and model 2.
Model 1 only calculates high leverage, 10X, 25X, 50X, 100X.
This model is used for short-term trading.
Model 2 calculates all leverage.
This model is usually used for long-term trading.
https://t.co/avAfE3KzdB
https://t.co/WNIluQ1NJd
@STASolutions1@W85Andi Die Aussage, dass lediglich $ 330 mio an long-trades aktiv sind, stimmt nicht. Das führt zu der Verwirrung in den Kommentaren. Es gibt allein bis runter auf $60k noch mehrere Milliarden an low leverage Liquidität (leider). Nicht irrelevant, eher irreführend. ;-)
@STASolutions1@W85Andi Bitte die Erklärung von Coinglass lesen. Die Exchange Liquidation Map basiert offensichtlich auf Model 1 + 5x leverage. Leider kann es dort nicht umgestellt werden. Mit Daten aus Model 2 säe das Bild dort auch anders aus.
https://t.co/Oyd4Eo2oEj
Many guys ask me about the difference between liquidation heatmap model 1 and model 2.
Model 1 only calculates high leverage, 10X, 25X, 50X, 100X.
This model is used for short-term trading.
Model 2 calculates all leverage.
This model is usually used for long-term trading.
https://t.co/avAfE3KzdB
https://t.co/WNIluQ1NJd
@W85Andi@STASolutions1 Es sind 2 unterschiedliche Datenbasen. Der erste Post bezieht nur 10-50x Hebel ein. Dort ist short dominant, da Long liquidiert wurde. Im aktuellen Bild sind alle Hebel mit drin. Der erste Post ist daher an sich irrelevant und wie durch Post #2 widerlegt. Richtig @STASolutions1?