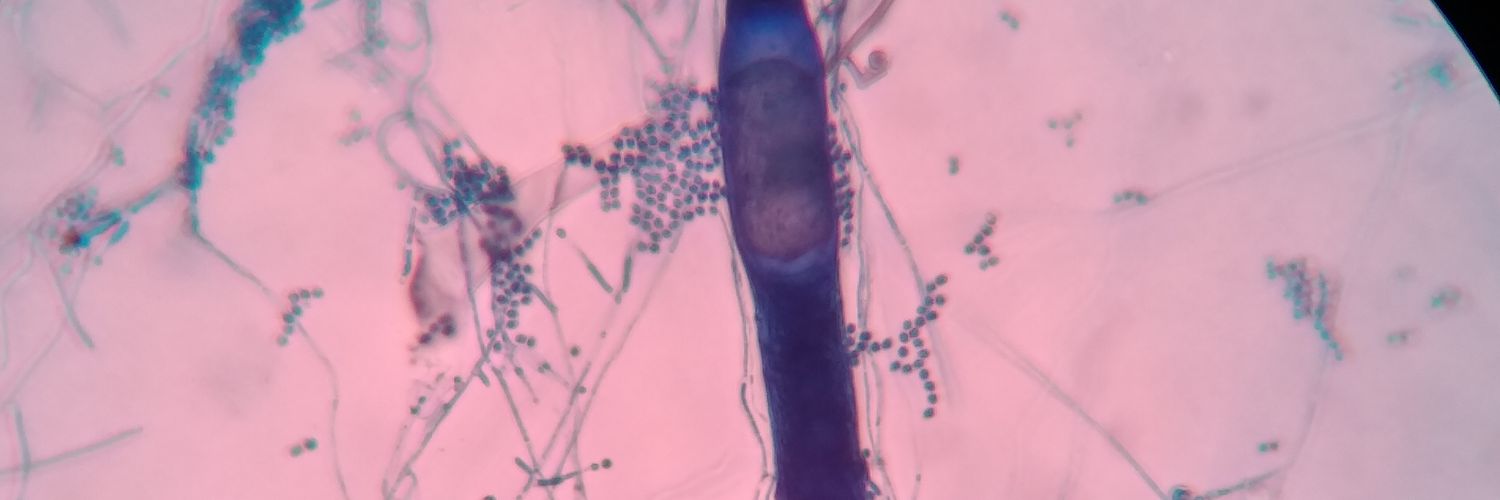
When you see some type of parasitism, you always wait your strains are able to infect differents targets... The "easy" work was done, after that your ability to observe must be very sharp... To see something like that, the infection of this fungus began in Aphelenchoides' vulva
Las pruebas estadísticas clásicas son representaciones simplificadas de problemas de modelización. Si aprendea a especificar modelos estadísticos será más sencillo comprender qué está haciendo cada prueba, cuáles son sus supuestos y cómo extenderla cuando el diseño se complica.
@serivadeneira@Bancolombia Tras de que tienen y retienen tu dinero (porque es obligado que tú tengas que tener una cuenta o algo para que otro "administre y te robe" tu dinero)... Te obligan a usar y malgastar de otra manera... Sacan provecho estos perros de @Bancolombia ... Increíble que esto aún pase
@ACHColombia_ Estoy teniendo problemas el día de hoy para poder pagar con PSE, no he podido, hay algún daño o sucede algo externo a mi banco? Para poderlo coordinar de la mejor manera con las personas? Gracias de antemano
A veces levantarnos de la cama cuesta un mundo, pues sentimos como si cargáramos el peso del mundo sobre nuestra espalda… pero a veces las cosas no nos salen tan mal ✨ #MNDLN
🎵 https://t.co/QjXopEzfVg
📹 https://t.co/AOOo2pMIBf
🚨 ¿Valores perdidos en tus datos? Este curso te enseña a manejarlos en R. 🚨
💡 Aquí no solo aprenderás teoría: vas a ponerte manos a la obra.
🔎 ¿Qué incluye en la práctica?👇🧵
#rstats#stats#analytics#datascience#dataviz
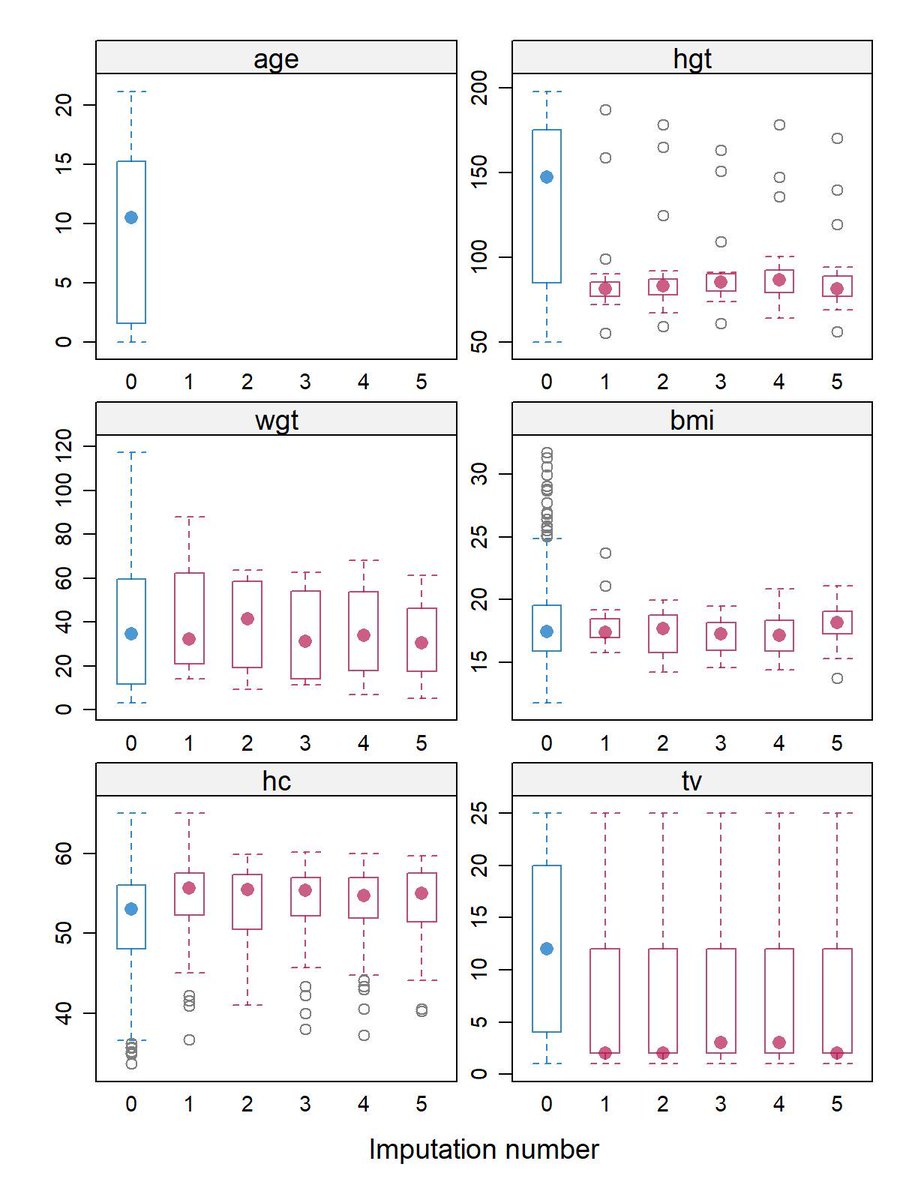
When performing multiple imputation of missing data, it is essential to evaluate how the imputed values compare to the observed data. The bwplot() function of the mice package in R offers a straightforward way to visualize and assess these relationships using boxplots.
The attached image, created with the bwplot() function, showcases how the distributions of observed and imputed values vary across different imputations for multiple variables. Here's what the plot reveals!
🔹 Plot Explained: The plot compares the distributions of observed (blue boxplots, labeled "0") and imputed values (pink boxplots, labeled "1" to "5") for each variable across five imputations.
🔹 Observed vs. Imputed Data: For variables such as wgt and bmi, the imputed values closely align with the observed data, indicating that the imputation model effectively captures the underlying structure of the data. However, differences between observed and imputed distributions do not necessarily signify an issue. They may reflect systematic patterns in the missing data that are accurately modeled by the imputation algorithm.
🔹 Imputation Consistency: Stable distributions across imputations demonstrate consistency and reliability in the imputation process. If variability persists between imputations, it may indicate the need for further iterations or adjustments to the imputation model.
To generate this plot using the mice package in R:
library(mice)
my_imp <- mice(boys)
bwplot(my_imp)
I’ll be hosting an 8-week online workshop on Missing Data Imputation in R, kicking off on February 20. It’s designed for a small group of only 15 participants.
Click this link for detailed information: https://t.co/Zvzj0dl2xG
#rstudioglobal #datavis #database #Rpackage #RStats
@sttmed buen día
Dónde puedo ver información del evento de mañana? Horarios y cierres viales o rutas alternas y programación?
Creo que se llama Antioquia te reta 2024
Gracias de antemano 🥺
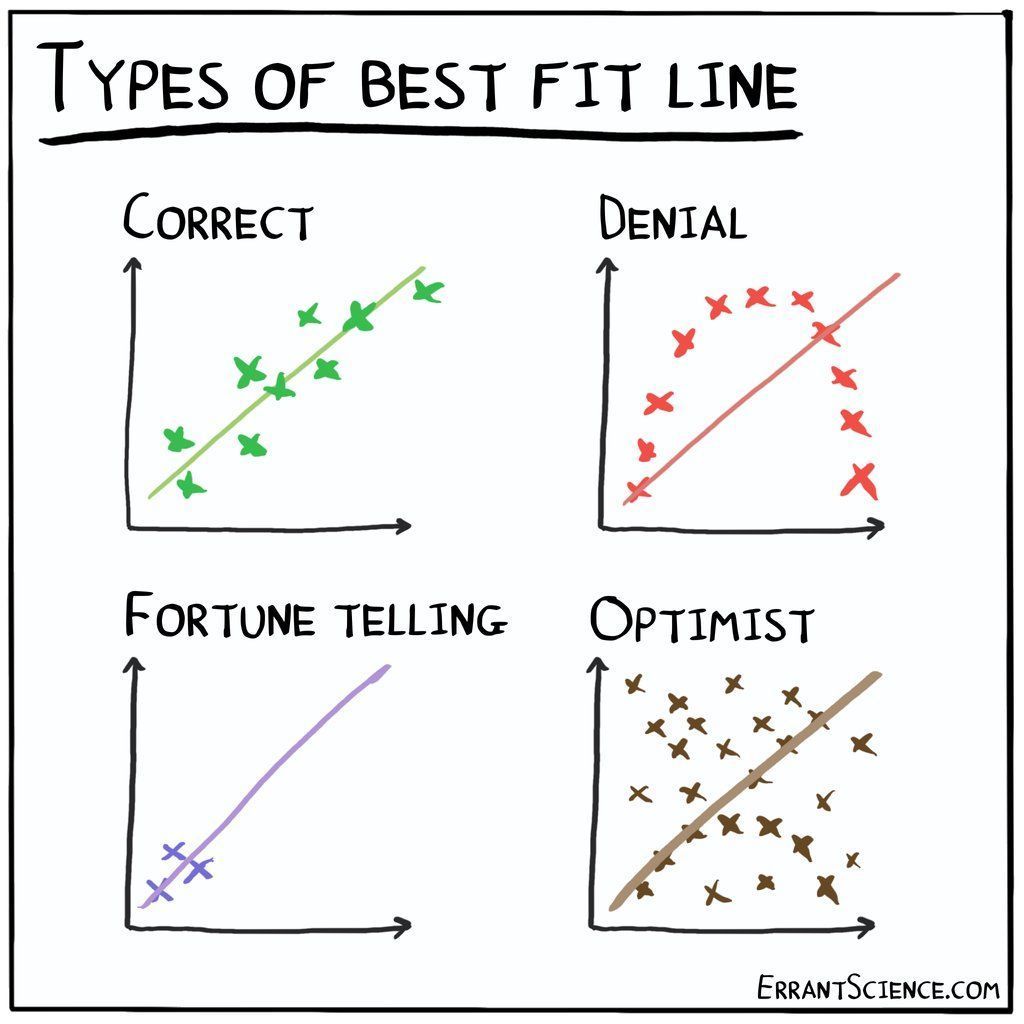
👀 ¿Has visto alguno de estos escenarios? 🤯
✅Correcta: Lo que todos deseamos
❌Negación: Sabe que los puntos dicen otra cosa, pero se aferra
🔮Adivinación: Pocos datos, pero mucha imaginación
🤞Optimista: La esperanza es lo último que se pierde
#dataviz
imagen @ErrantScience
"Waiting for you is like waiting for rain in this drought. Useless and disappointing" - Sam (Hilary Duff), A Cinderella Story, 2004
9 year old me: wow so powerful and iconic
24 year old me: still powerful and iconic
#BestMovieLineEver