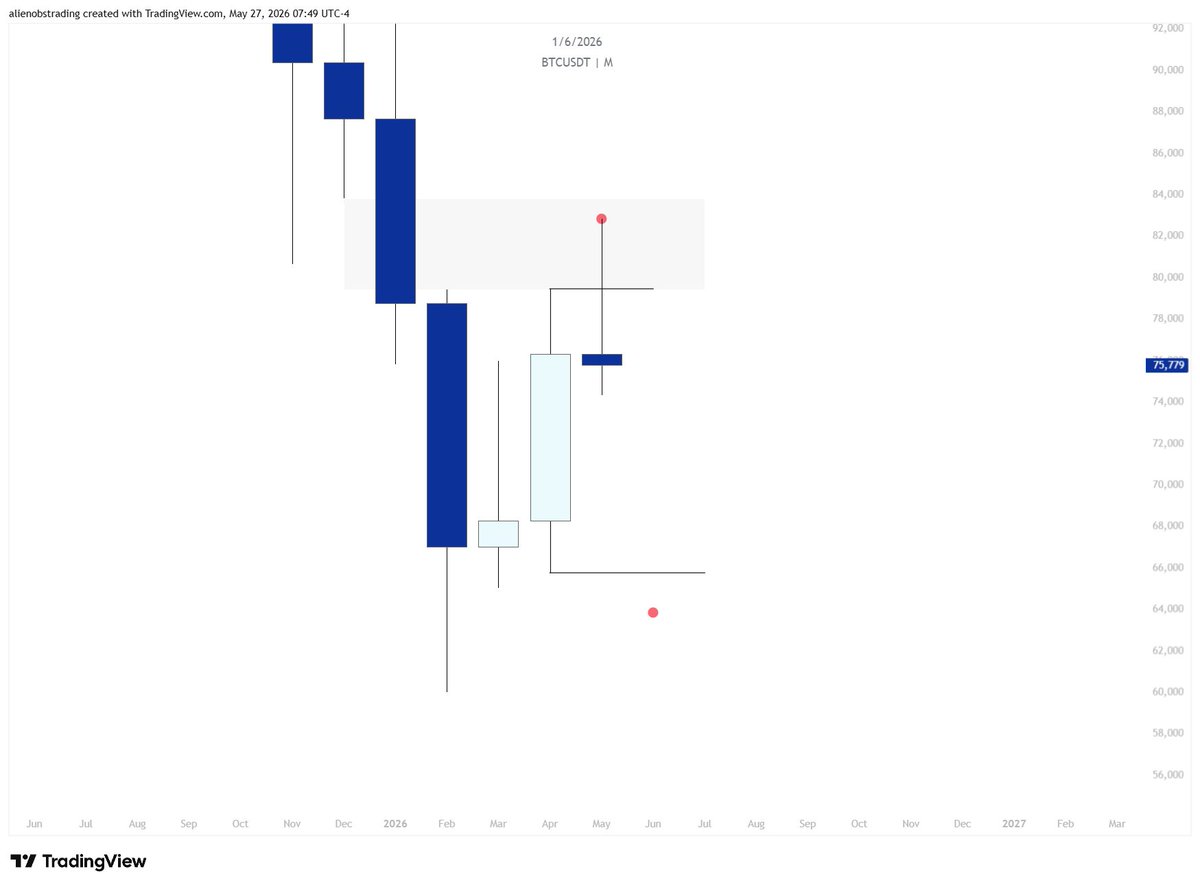
The math made it obvious for $BTC.
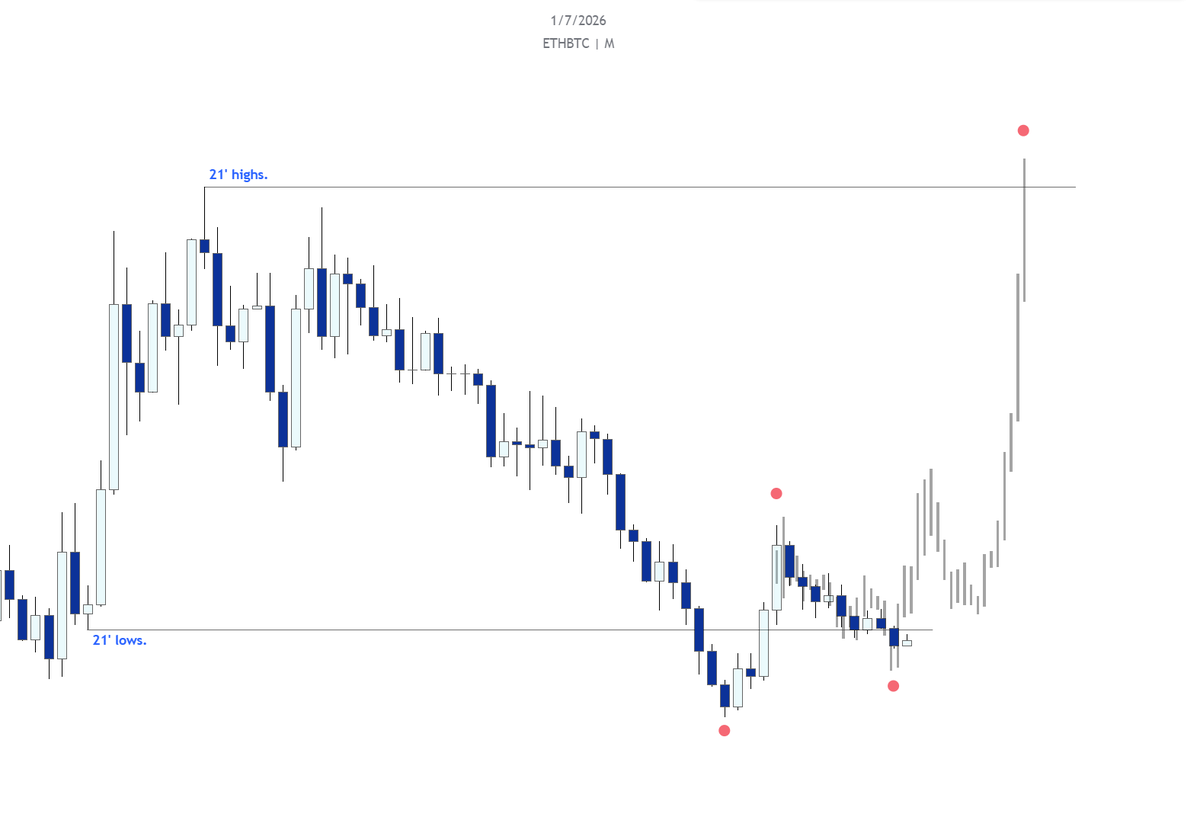
Bot accounts shilling Bitcoin = Moving toward 0.8 level
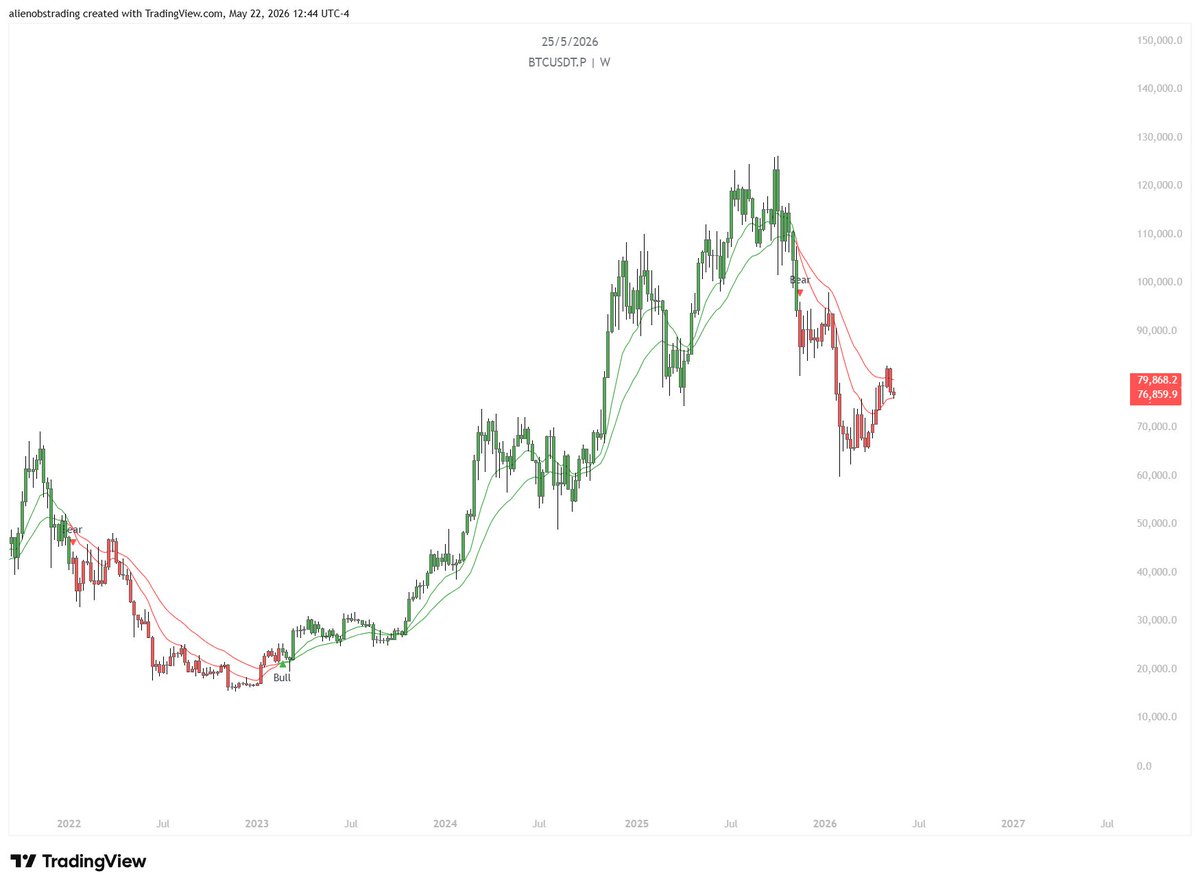
The cycle appears over with BTC.D weakening fast.
Nobody wants to see it.
$ETHUSDT | 3D
Possible sequence worth watching.
A move into the $2,700–$2,800 range could come first, the kind of rally that brings people back to the table. If that plays out, the more important question becomes what happens after.
A final leg down to sweep internal liquidity near the long-term trendline remains a credible scenario. Not because price has to go there but because that's where the structure would make the most sense to reverse.
The interesting part: if $ETHBTC and $ETH.D continue to show strength during that drawdown, the narrative shifts. Price falling while relative strength holds is rarely a bearish signal.
That confluence trendline, liquidity sweep, relative strength is what defines the Low Risk Buy zone on this chart.
Whether it plays out exactly this way is unknown.
But if it does, the setup that follows is hard to ignore.
No, you weren't right.
You're right if you can identify a potential reversal zone and take the short after the "reversal is confirmed".
Sitting in a losing position for weeks or months and celebrating once the price finally comes back isn't trading or success, it's luck.
@_hizzim I'm skeptical about BTC maintaining high valuations. To me, the equation is straightforward: when BTC is cheaper, capital rotates more efficiently across the market.
A highly priced "digital gold" is often more of a headwind than a catalyst.