Boosted Efficiency over 43% for 50+ Businesses As a Data Analyst | I Help thrive Businesses using Data | Data Analyst | Data Visualization & Tableau Specialist
اس ویڈیو میں پاکستان کیلئے ایک سبق ہے کہ ایک پاگل کتے نے بھینس کو کاٹا ۔ تو ایک بندے نے آکر کتے کو ڈنڈے سے مارا اور بھینس کو بچال��ا لیکن ایک شخص کتے کا دفاع کرنے پہنچ گیا کہ اس کو نہیں مارو ۔ تھوڑی دیر بعد کتے نے اُسی دفاع کرنے والے کو کاٹ لیا ۔
https://t.co/xyqnJyfS2d
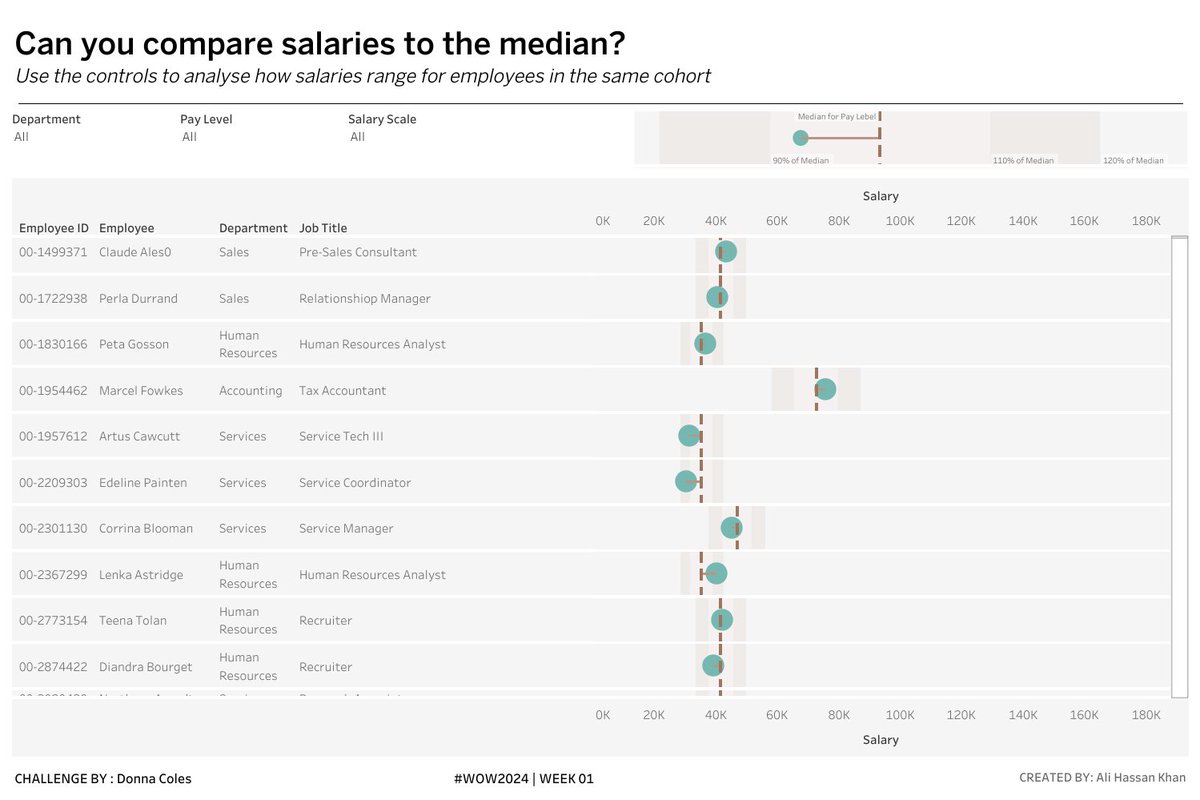
Employee Salary Comparison
It provides a quick view of the employee salary compared to the median for that level.
It was a cool challenge to complete.
Inspiration: Donna Coles
Link: https://t.co/1tVk03Mm1V
#tableau#datafam#WorkoutWednesday
Committing to safer roads through the lens of road safety data
I explored the Road Crash dashboard with a dataset covering casualties from 2021-2022 in the UK using Tableau.
Excited to hear your thoughts! #tableau#data#datafam#collisionavoidance#roadsafety#safety
Need a practical dashboard on your Tableau Public page that showcases lots of attention-to-detail required to produce kick-ass work? Look no further than #WOW2023 W47 by @norbert_borbas 🇭🇺. It took a minute but was a solid workout.
"Aesthetics vs. Functionality in Data Dashboard:
🎨 Attractive designs + usability.
🔧 Prioritize functionality.
✨ Enhance usability with appealing visuals.
⏳ Functionality keeps users engaged.
📐 Consider usability over visuals.
Create a great experience!
#dataviz
🎯 Effective Dashboard Design:
1️⃣ Keep it simple, avoid clutter.
2️⃣ Be consistent in layout and design.
3️⃣ Highlight key data with visual cues.
4️⃣ Focus on user needs.
5️⃣ Test and iterate for improvement.
✨ Create user-friendly dashboards!
#dashboarddesign#dataviz#usability
🔑 It transforms teams, boosts collaboration, and cultivates a high-performing culture. Share your thoughts on the power of empathy in leadership! How has it made a difference in your experiences? 👇
#Leadership#EmpathyInAction#BuildingConnections#WorkplaceCulture
🔑 Empathy fosters trust, engagement, and a thriving work environment. 🔑 It involves genuinely listening, understanding, and acknowledging your team's needs. 🔑 Empathy means putting yourself in their shoes and empowering them to shine.
If you’re interested in LEARNING all of these for FREE:
Product management
Project management
Business analytics
Data visualization
Microsoft excel
Data analytics
Big data
Scrum
UI/UX
Agile
SQL
Open, RT this and thank me later:
https://t.co/946zJFiWth
Happy new month!
As a leader, don't shy away from difficult conversations and conflict resolution - they're key responsibilities. Avoiding them only creates bigger problems down the line. Deal with issues as they arise to set the right tone for how things should be handled.
#trust#workplace
Want to make sure your data visualizations are effective? Avoid these chart types!
3D charts
Pie charts with too many categories
Stacked bar charts with too many categories
Gauges and speedometers
Complex heat maps
#datavisualization#dataanalysis#datascience#dataviz
Listen Up data mavens! 🤖! 📊 When creating a dashboard, it's crucial to identify your key audience to ensure your data visualization is tailored to their needs and preferences.
Consider the following when identifying your audience:
So, before you start designing your dashboard, take some time to identify your target audience and their requirements.
As a result! Your data visualization will be much more impactful