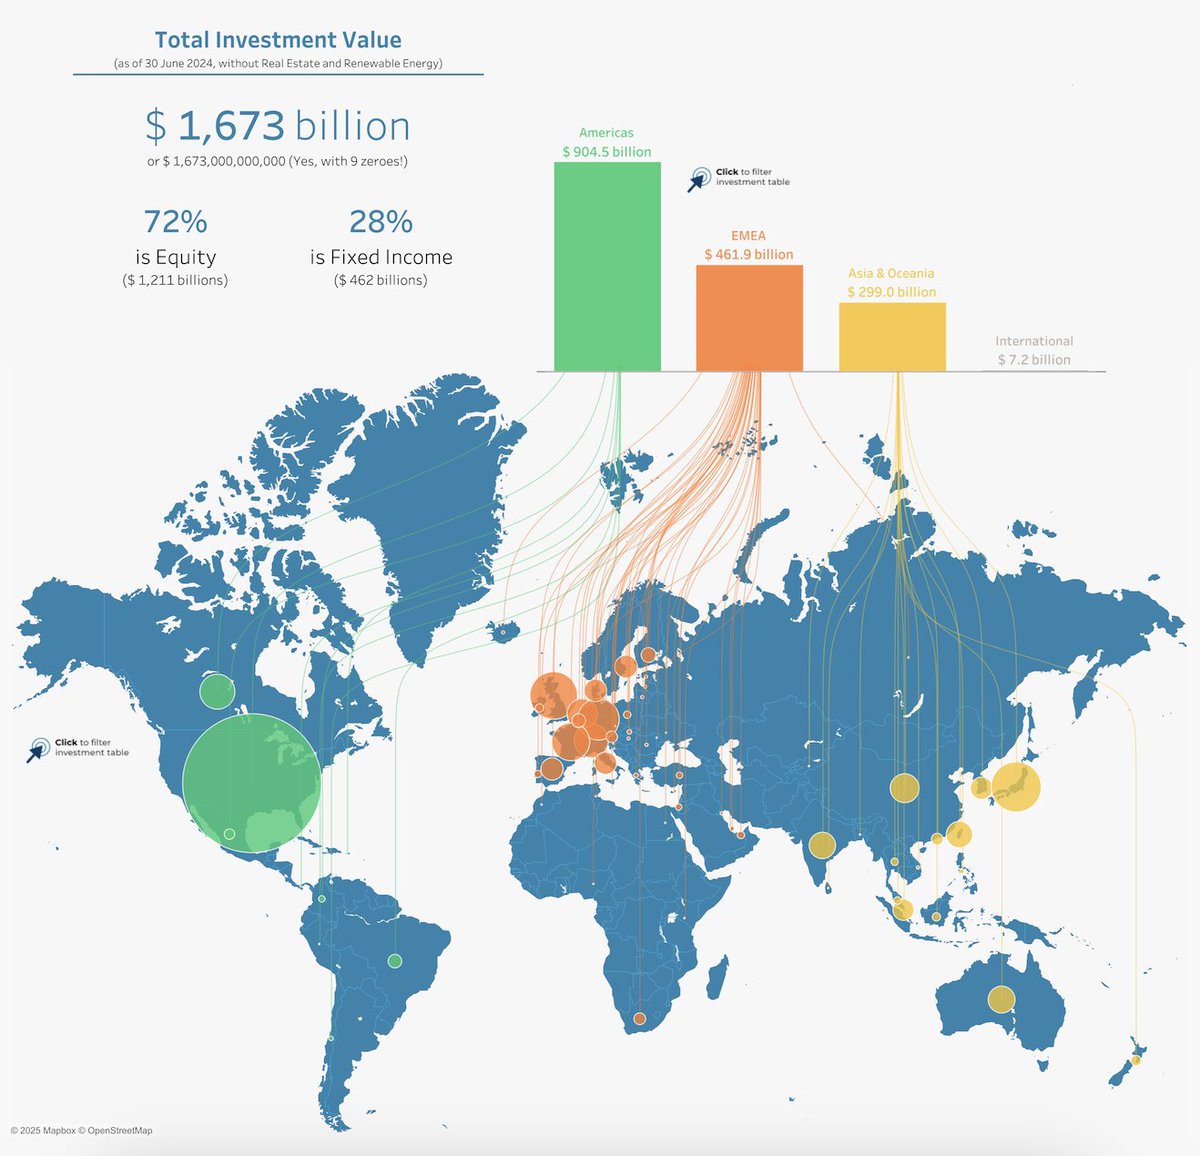
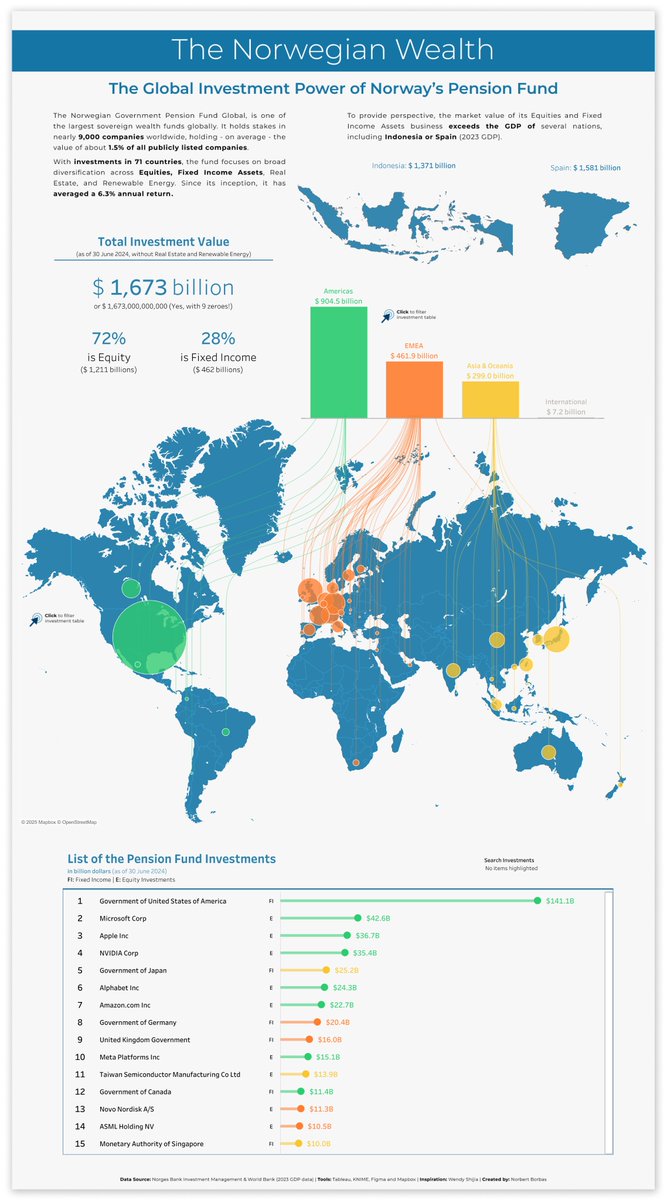
This #VizOfTheDay by @norbert_borbas combines curves on a map and bar charts to showcase Norway’s Government Pension Fund and its investments in over 9,000 companies across 70 countries.
Viz inspired by Wendy Shijia. https://t.co/mjWHjPWQD0
Have you ever heard about Norway's Government Pension Fund? It is a fascinating story of a sovereign wealth fund that holds equities in nearly 9000 companies worldwide in more than 70 countries.
Check out my viz inspired by @ShijiaWendy:
https://t.co/8D2CbdTQVW
@tableaupublic
#fencing visualization is tricky. The two opponents can hit (touch) one another at the same moment, so they both get a point at the same time in the animation too.
This is yesterday's Men's Épée Team Gold Medal Match
@FIE_fencing#Paris2024#OlympicGames#Olympics#dataviz
Celebrate #BlackMusicMonth 🎵 through data visualizations on Tableau Public, showcasing the impact and contributions of Black musicians.
Discover the stories, the stats, and the sounds that have shaped the music world. https://t.co/6aVYFBk6ou
Getting back to Tableau-ing with a portfolio-style visualization that is home to all my 51 solutions to each week of #WOW2023 challenge by @WorkoutWednsday
Check out here: https://t.co/20vRgQrTt5
Viz inspired by: @SmilgaNir, data from the amazing Stats Service by: @flerlagekr
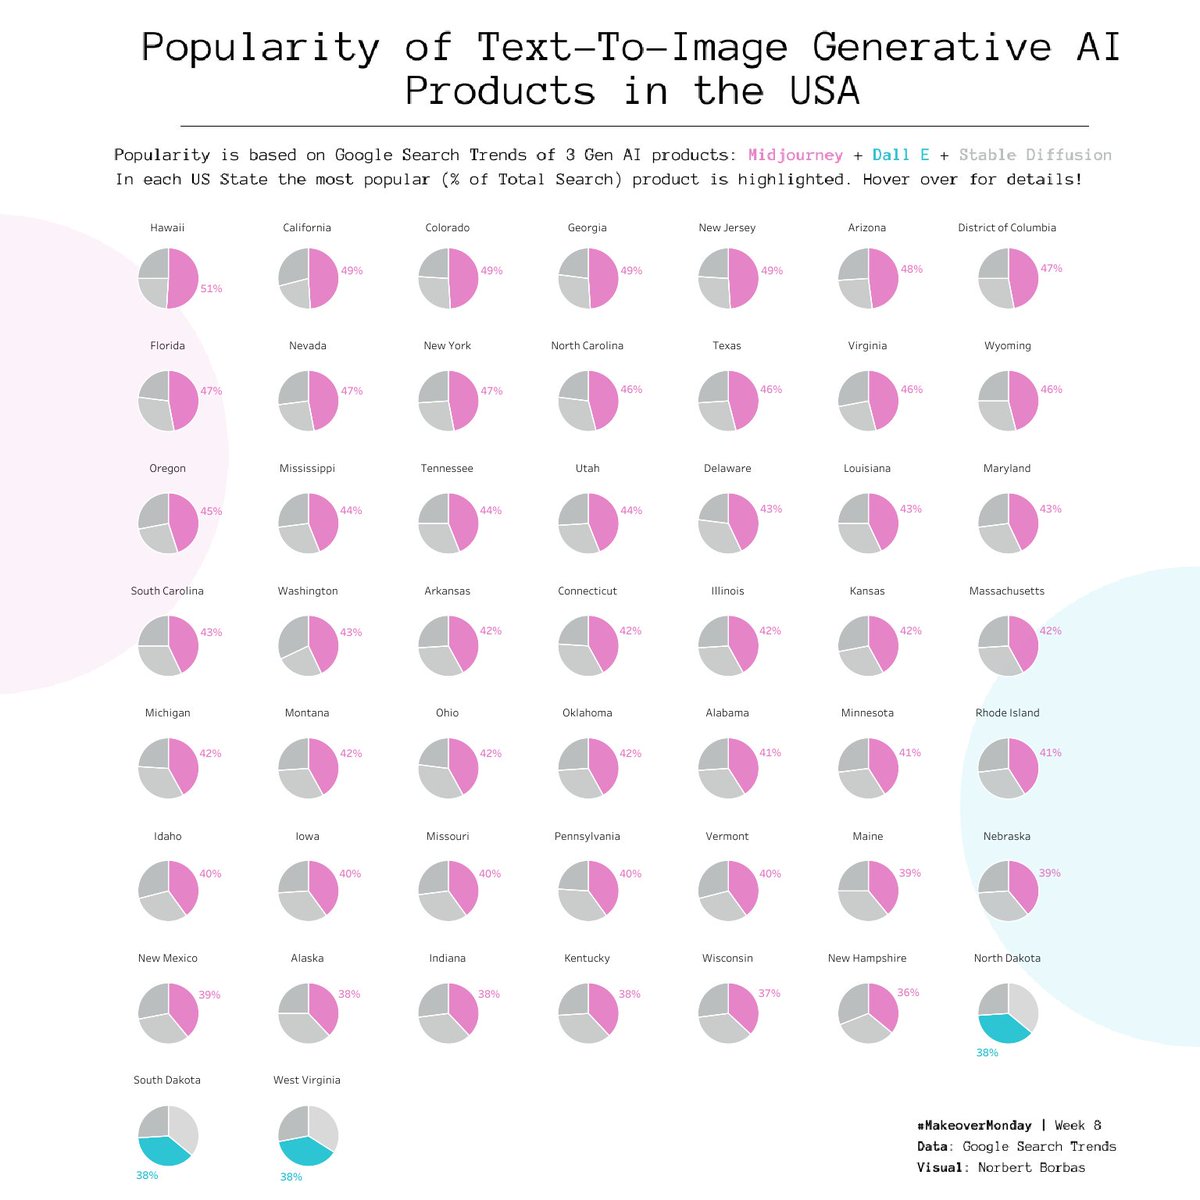
Using good old (unpopular?!) pie charts (although in small multiples style!) for #MakeoverMonday Week 8 to show the Generative AI Search Trends in the USA
Will #Midjourney stay to be the most popular?
@tableaupublic link:
https://t.co/26vEntZIUV
@DatavizChimdi@VizWithIrene
Find inspiration and build your data viz portfolio with @TableauPublic—a free platform that allows you to explore, create, and share visualizations online.
Watch #DataFam Explained for tips on getting started: https://t.co/3akVpxv6qw
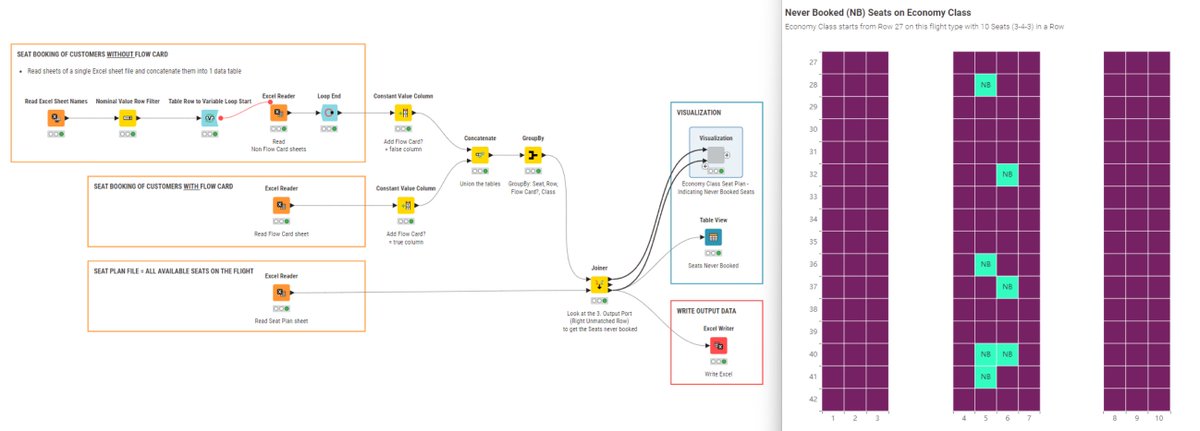
As last step, visualized the average Business Class ticket prices with the built-in Line Plot node.
Find the workflow on the KNIME Community Hub:
https://t.co/aRaMgkBHk2
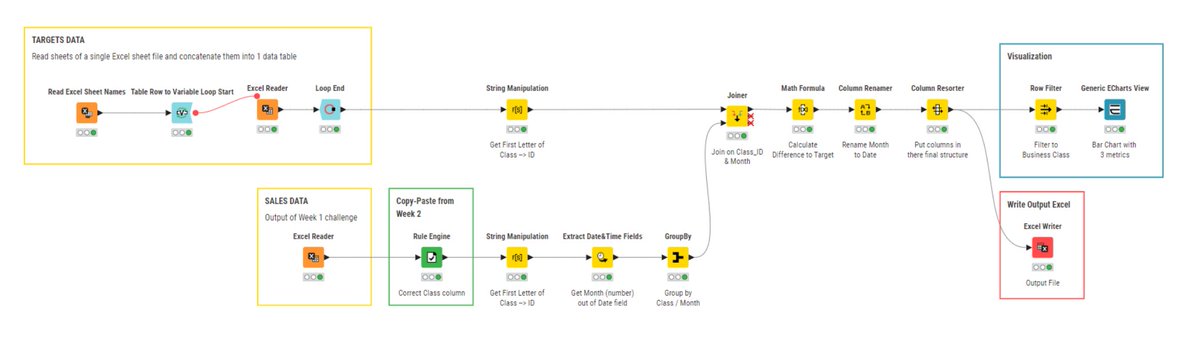
(2/2)🧵Week 1 was a warm-up, working on some data for a mock airline. Using KNIME, effortlessly:
- Read the input
- Manipulated the data with KNIME's native nodes
- Wrote the output into Excel
- Visualized the Tables for a quick glance
Link to workflow: https://t.co/lZY1dJZpzO
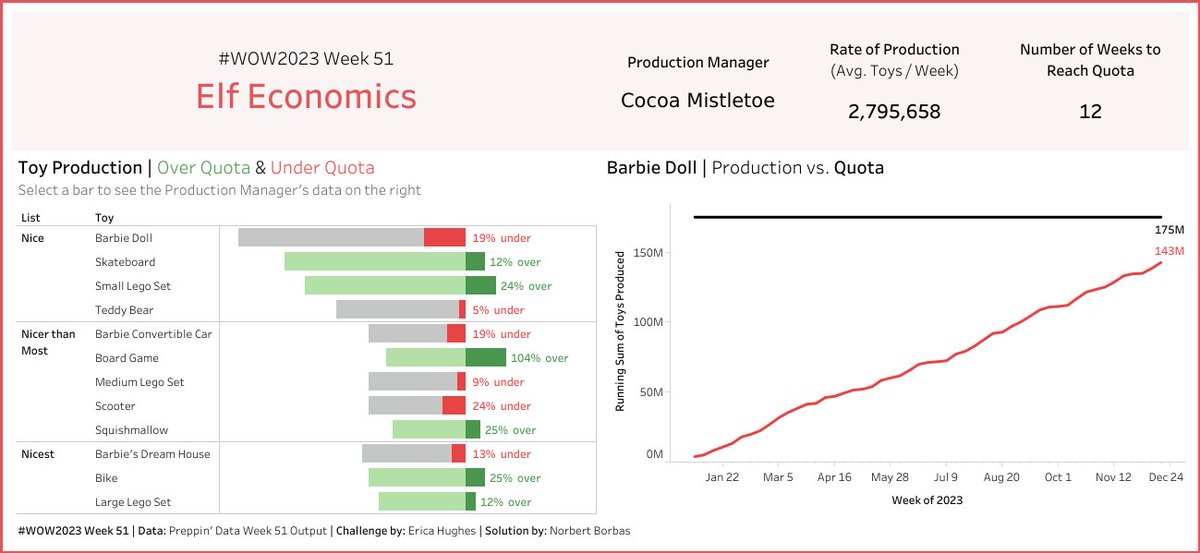
Here we go, the last #WOW2023. Can't believe I'm over the 51 challenges & just in time to fulfil this 2023 New Year resolution. This was a super experience + huge thanks to the full @WorkoutWednsday crew, You are amazing!🎉#AYearOfWOW
W51 - Elf Economics: https://t.co/ZSwhaMujYP