Chipotle (CMG)
1993
Newport Beach, CA
Fast casual mexican food
Revenue $12.4B
Employees 140,000
Market cap $39B
EV $43.8
Chipotle Mexican Grill was founded in 1993 by Steve Ells. It operates a fast-casual restaurant chain specializing in customizable Mexican-inspired food.
Its main products are burritos, burrito bowls, tacos, salads and quesadillas. Customers select their protein, rice, beans, vegetables, salsa and other toppings.
The model has several attractive characteristics:
- Simple menu: Relatively few ingredients are combined in different ways, supporting operational efficiency.
- High throughput: Assembly-line service allows restaurants to serve large numbers of customers.
- Premium positioning: Chipotle markets freshly prepared food and ingredient quality while maintaining a fast-food-style service model.
- Mostly company-owned: Unlike McDonald's, which is heavily franchised, Chipotle generally operates its own North American restaurants.
- Digital ordering: App orders, loyalty programs, pickup shelves and Chipotlanes provide additional convenience.
4,042 restaurants
- 3,938 in the United States
- 14 international partner-operated locations
-> Mainly US
Key competitors
- Cava
- Qdoba
- Taco Bell
- Sweetgreen
- Other fast casual, QSR, ready made meals
US store count versus competitors
Chipotle ~4000
McDonalds 13,700
Panera 2230
Qdoba 870
CAVA 476
Taco Bell 8,200
How the economics break down
Of every $100 a customer spends
- $55 - food and restaurant labor
- $20 - rent and other restaurant costs
- $9 - corporate overhead, depreciation and the other
- $16 of operating profit
Strengths
- Strong, recognizable brand with a clear food-quality positioning.
- Simple menu and assembly-line format support speed and operational consistency.
- Strong restaurant-level margins, around the mid-20% range.
- Large U.S. footprint with room for additional domestic expansion.
- Strong digital ordering, loyalty program, and Chipotlane drive-through/pickup format.
- Mostly company-owned stores allow Chipotle to retain the full economics of successful locations.
Weaknesses
- Company-owned model is capital- and labor-intensive compared with franchised peers.
- Narrower menu and cuisine appeal than broad fast-food chains such as McDonald’s.
- Heavy exposure to food, wage, and occupancy inflation.
- International presence is still relatively small and unproven.
- Food-safety incidents can damage the brand very quickly.
Opportunities
- Continued store growth in the U.S. and Canada.
- International expansion, particularly through local operating partners.
- More Chipotlanes, which can improve convenience and restaurant economics.
- Same-store sales growth through pricing, traffic growth, and higher digital engagement.
- Modest menu innovation without materially complicating operations.
- Operating leverage could allow free cash flow to grow faster than revenue if margins recover.
- Potential to increase average unit volumes as newer stores mature.
Threats
- U.S. market saturation could arrive before management’s long-term store target.
- Strong competition from CAVA, Qdoba, Taco Bell, Sweetgreen, Panera, and local restaurants.
- Consumers trading down if Chipotle becomes too expensive relative to fast food.
- Wage inflation and higher food costs, especially proteins and avocados.
- Food-safety or supply-chain problems could have an outsized reputational impact.
Valuation
Cash flow from operations (2025) $2114
Capex $666
Free cash flow $1488
Stock based comp $99
Adjusted free cash flow $1349
Enterprise value $43843
Yield 3.1%
Growth ?
Total return?
Growth - revenue has doubled over the last 5 years mainly through new store openings. BUT the North American market seems saturated and they have very little proof of concept outside of North America.
I have no idea what the growth rate should be
Uber Technologies Inc (UBER)
2009
San Francisco, California
Revenue $52B
Employees 34,000
Market cap $153B
EV $159B
Uber has evolved from a ride-hailing company into a global transportation, delivery and logistics marketplace.
What does Uber actually do?
Uber operates a two-sided marketplace connecting consumers with drivers, couriers, restaurants, retailers and freight carriers.
Its three reported businesses are:
Mobility $29.0B
Delivery $27.5B
Freight $1.6B
Total $58.0B
Competition
Mobility: Lyft in North America, plus regional platforms such as Grab and DiDi, traditional taxis/public transit, and increasingly autonomous-vehicle networks.
Delivery: DoorDash is probably the most important competitor in the U.S., alongside regional food-delivery platforms and restaurants' own ordering systems.
Freight: Uber Freight competes with traditional freight brokers and technology-enabled logistics companies.
SWOT
Strengths
Enormous network effects. More riders attract more drivers; more drivers improve availability and wait times, attracting more riders.
Global brand and scale. 208M MAPCs and nearly 3.9B quarterly trips/orders.
Two major marketplaces on one platform: rides + delivery.
Very capital-light core model.
Increasing profitability and operating leverage.
Exceptional cash generation: TTM FCF now exceeds $10B
Massive data set around transportation, routing, pricing and consumer behavior.
Cross-selling opportunities between Uber, Eats, grocery, advertising and other services.
Strong position to become the demand aggregator for autonomous vehicles rather than needing to develop the AV technology itself.
Increasing share repurchases can offset SBC dilution.
Weaknesses
Limited customer switching costs — consumers can easily check Lyft or DoorDash.
Drivers can multi-home across competing apps.
Significant dependence on independent contractors.
Insurance is a substantial cost.
Stock-based compensation remains significant.
Freight remains relatively weak/unprofitable.
Uber doesn't own the underlying autonomous-driving technology.
Regulatory/legal complexity across hundreds of jurisdictions.
Opportunities
Autonomous vehicles could dramatically lower the cost of transportation.
Uber becoming the global marketplace for multiple AV manufacturers could strengthen rather than destroy its network effects.
Grocery and retail delivery.
Advertising.
Uber for Business.
Expansion into less densely penetrated markets.
Cross-selling Mobility customers into Delivery and vice versa.
Continued margin expansion as bookings grow faster than corporate overhead.
Acquisitions and consolidation of regional delivery/mobility platforms.
Threats
Waymo or another AV operator develops a sufficiently strong consumer network to disintermediate Uber.
Tesla or other AV fleets build vertically integrated networks.
DoorDash continues gaining scale in delivery.
Governments reclassify drivers as employees.
Higher driver compensation requirements.
Insurance inflation.
Price competition/incentives reduce marketplace margins.
Regulators challenge Uber's pricing, labor practices or market power.
Valuation
Cash flow from operations $10.1B
Capex $0.3B
Free cash flow $9.8B
Share based comp $2B
Adjusted FCF $7.8B
EV $159B
Yield 4.9%
Growth x%
What’s going on in the business right now
Rapid growth continues - gross bookings up 22% year over year in constant currency
Big push into AV - Autonomous Vehicles (AV): Active in 7 cities with a target of 15 by year-end
Big Capex plans - $10B this year vs $0.3B last year - this is night and day - investment is needed to invest in AV partners
Platform Expansion: Announced a pending agreement to acquire Delivery Hero to scale joint mobility and delivery operations across nearly 100 markets.
Space X (SPCX)
2002
El Segundo, California
Rockets, broadband and AI
Revenue $18.6B
Employees 22,000
Market cap $1.65T
EV $1.66T
SpaceX is a vertically integrated technology and infrastructure company operating across space transportation, satellite communications, artificial intelligence, national security, and human spaceflight.
Founded by Elon Musk in 2002 with the goal of dramatically reducing the cost of access to space and ultimately enabling humanity to become a multiplanetary species, the company has evolved into one of the world's most strategically important technology businesses.
Five major segments:
Launch Services – Falcon 9, Falcon Heavy and Starship
Satellite Communications – Starlink
Artificial Intelligence – SpaceXAI (including Grok, X and enterprise AI products)
Defense & National Security – Starshield
Human Spaceflight – Dragon spacecraft
Unlike traditional aerospace companies, SpaceX designs and manufactures most of its critical technologies internally, including rocket engines, launch vehicles, satellites, communications hardware, AI infrastructure and software. This degree of vertical integration allows the company to innovate rapidly, reduce costs, and tightly integrate its various businesses into a single ecosystem.
Strengths
Industry-leading launch economics
Exceptional vertical integration
Diversified platform (launch, Starlink, AI, defense, human spaceflight)
Proprietary data and AI capabilities
Recurring revenue from Starlink and AI
World-class engineering talent and innovation culture
Weaknesses
Extraordinary capital requirements
High execution complexity across multiple businesses
Dependence on Elon Musk
Heavy regulatory and government dependence
Increasing organizational complexity following expansion
Opportunities
Global broadband expansion
AI infrastructure and enterprise AI
Lunar economy and deep-space exploration
Growth in defense and national security spending
Robotics and autonomous systems
Expansion into new commercial space markets
Threats
Intensifying competition across launch, AI and satellite communications
Rapid AI arms race requiring continual investment
Political, regulatory and antitrust risk
Launch failures, satellite outages or major execution setbacks
Space debris and increasing regulation of low Earth orbit
Geopolitical tensions affecting international operations
Q2 2026 update
Revenue is growing 92% YOY - for the quarter was $7.8B
Operating income ($143m)
Huge CAPEX - $18.4B for the quarter
Starlink subscribers 12m
Satellites in Orbit 10.2k
Countries with Starlink coverage 167
Revenue targets, per Elon:
- $100B run rate by end of this year
- $1T by 2030
Space X valuation / share price over time
2 years ago $220B
1 year ago $450B
Last private valuation Feb 2026 - $1.25T
IPO June 12 2026 - $135/share $1.77T
Today $115/share $1.65T
Interpump Group S.p.A. (IP)
1977
Sant'Ilario d'Enza, Italy
Industrial machinery - hydraulics and water jetting
Revenue €2B
Employees 9000
Market cap €3.7B
EV €4B
Interpump Group S.p.A. is an Italian industrial group listed in Milan under IP. It is best understood as a decentralized collection of niche manufacturers serving two broad markets:
Hydraulics: power take-offs, hydraulic pumps, cylinders, valves, hoses, fittings, tanks, gearboxes and related components used in trucks, construction equipment, agriculture and industrial machinery.
Water Jetting: high- and very-high-pressure piston pumps, valves, nozzles, flow-handling equipment, mixers and industrial processing systems.
Its strategy has combined organic product development with frequent acquisitions of specialized, often family-owned industrial businesses.
Margins
Gross 35%
Operating 16%
Returns on capital
ROIC <10%
ROE ~10%
SWOT
Strengths
Global leadership in professional high-pressure piston pumps
Strong niche brands and specialized engineering knowledge
Excellent EBITDA margins of around 22%
Water Jetting EBITDA margins above 27%
Diversification across customers, products and geographies
Long acquisition and integration record
Decentralized operating structure
Essential products that are generally inexpensive relative to customer equipment
Weaknesses
Reported ROIC is only around 9–13%, despite high margins
Acquisition-heavy model creates goodwill and integration risk
Complex collection of many businesses and brands
Significant working-capital requirements
Capital-intensive manufacturing operations
Organic revenue has been weak since the 2023 peak
FCF can be volatile
Limited recurring contractual revenue compared with software or service businesses
Founder and management capital-allocation judgment remains important
Opportunities
Recovery in commercial vehicles, construction and agricultural hydraulics
Cross-selling complete hydraulic systems and kits
Further consolidation of fragmented industrial niches
Expansion in North America and emerging markets
Growth in industrial cleaning and ultra-high-pressure applications
Food, pharmaceutical and cosmetics processing equipment
Increasing automation and efficiency requirements
Bolt-on acquisitions at lower multiples than Interpump’s public-market valuation
Buybacks when shares trade below intrinsic value
Threats
Prolonged industrial recession
Competition from Parker, Bosch Rexroth, Danfoss and lower-cost Asian producers
Customer destocking and inventory corrections
Raw-material, labour and energy inflation
Acquisition overpayment
Loss of entrepreneurial managers after acquisitions
Currency volatility
Increased Chinese competition
Reduced capital spending by truck, agricultural and construction customers
Margin pressure if product mix shifts away from Water Jetting
Valuation
Free cash flow ~€200m
EV €4B
Yield 5%
Organic growth 3-4%
Total returns 8-9%
Davide Campari-Milano N.V. (CPR)
1860
Milan, Italy
Drinks
Revenue €3B
Employees 4800
Market cap €6.8B
EV €8.8B
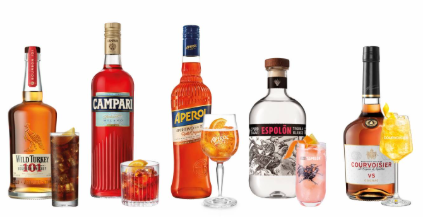
Davide Campari-Milano N.V. is an Italian-controlled global spirits company listed in Milan under CPR. It owns more than 50 premium and super-premium beverage brands, although economic value is concentrated in a much smaller group—especially Aperol, Campari, Espolòn, Wild Turkey, Appleton Estate, Grand Marnier and Courvoisier.
Campari reorganized its portfolio into four brand houses:
Aperitifs - 43.8%
Whiskey & Rum - 14.0%
Agave - 9.6%
Cognac & Champagne - 9.9%
Local and other brands - 22.7%
Aperitifs are clearly the economic centre of the company. Aperol alone produced 25.7% of group revenue while Campari contributed another 10.6%
Sales by region
Europe 45%
NA 37%
Developing 10%
APAC 8%
Competes with:
Diageo (UK)
Pernod Ricard (France)
Beam Suntory (Japan/US, privately owned)
Bacardi Limited (Bermuda, privately owned)
Brown-Forman (US)
The stock is down dramatically due to a decline in organic growth from high single digits to 2-3%. This is not just Campari specific but impacted the entire drinks industry (post the COVID and China boom). Also there has been significant management turnover since 2024 (longtime CEO resigned, successor last 6 months)
There may also be structural factors at play - young people drinking less, competition from cannabis, healthy habits and GLP-1
SWOT analysis
Strengths
Globally recognized brands with strong consumer loyalty.
Distinctive leadership position in aperitifs.
Aperol benefits from a powerful cocktail-and-occasion franchise.
Gross margins around 60%.
Broad international distribution.
Geographic expansion opportunities, particularly in the US and Asia.
Strong cash generation once extraordinary capex normalizes.
Family-controlled ownership may support long-term decision-making.
Portfolio includes lower-alcohol and alcohol-free products such as Crodino.
Weaknesses
Aperol represents more than one-quarter of revenue, creating concentration.
Consolidated ROIC is only moderate after acquisition goodwill.
Net debt remains approximately 2.5× EBITDA.
Large inventories tie up capital.
Some smaller brands contribute little profit.
Asia-Pacific remains small and unprofitable.
History of acquisition spending makes normalized FCF harder to assess.
Large gap between reported and management-adjusted FCF.
Advertising must remain high to protect brand relevance.
Opportunities
Expand Aperol consumption beyond its traditional European summer occasion.
Increase US penetration of Aperol.
Continue international expansion of Espolòn.
Premiumize Wild Turkey, Russell’s Reserve and Appleton Estate.
Improve Courvoisier following acquisition.
Eliminate low-return brands and administrative complexity.
Improve margins through procurement and shared distribution.
Use future FCF primarily to reduce debt.
Grow Crodino and other lower-alcohol or alcohol-free offerings.
Threats
Structural moderation in alcohol consumption.
Health-conscious younger consumers drinking less.
Excise-tax and advertising restrictions.
Competition from cannabis and non-alcoholic alternatives.
Weak US spirits demand and retailer destocking.
Input-cost inflation, particularly glass, agave and aged spirit inventory.
Currency fluctuations.
Tariffs and trade disputes.
Shifts in cocktail fashions.
Further expensive acquisitions.
Margins
Gross 60%
Operating 21%
-> High margins
Returns on capital
ROIC ~10%
ROE <9%
Low returns on capital due to high prices paid for acquisitions
Valuation
Free cash flow €426m (potentially a little higher)
EV €8807m
Yield 4.8%
Organic growth 2.5-3%
Total returns Less than 10% unless growth improves
Expedia Group Inc (EXPE)
1996
Seattle, Washington
Online travel agency
Revenue $15B
Employees 16,000
Market cap $27.3B
EV $27.5B
Expedia Group is one of the world's largest online travel agencies (OTAs). It operates a portfolio of travel brands that help consumers book:
Hotels, Vacation rentals, Flights, Car rentals, Cruises, Activities and attractions
Its major brands include:
https://t.co/m5ryRmwU66
https://t.co/Rc1w6bf6hJ
Vrbo
Orbitz
Travelocity
Hotwire
Trivago (major ownership stake)
Expedia also operates a large B2B platform, powering travel bookings for banks, airlines, loyalty programs, and other travel companies. This B2B segment has become one of the company's fastest-growing businesses.
Who Are Their Competitors?
Global OTAs
Booking Holdings (https://t.co/mNQgtBPLDe, Priceline, Agoda, Kayak), Airbnb, https://t.co/t2r7ciGZd5 Group
Meta-search
Google Travel, Kayak, Skyscanner
Direct Suppliers
(Hotel chains, airlines, cruise ships)
Hotels and airlines want customers booking directly to avoid OTA commissions.
SWOT
Strengths
Massive global scale
Leading brands with decades of consumer awareness
Strong position in North America
Large and growing B2B platform
Significant network effects between travelers and suppliers
Strong loyalty ecosystem
Weaknesses
Inferior economics versus Booking Holdings
Lower international market share
Historically weaker execution at https://t.co/Rc1w6bf6hJ and Vrbo
Reliance on Google traffic
Travel demand is cyclical
Thin differentiation in many booking categories
Opportunities
B2B travel platform expansion
AI-powered trip planning
International expansion
Vrbo improvement and cross-selling
Increased monetization of advertising
Continued margin expansion
Threats
Google becoming a larger travel intermediary
Hotels pushing direct bookings
Airbnb continuing to take share in alternative accommodations
Economic recession reducing travel demand
AI assistants potentially bypassing traditional OTA interfaces
Regulatory scrutiny around pricing and fees
Returns on Capital
ROIC mid 20%s now but has historically not been great - WHY?
ROE - 70%+ now, same comment
Debt - Net debt is essentially zero.
Margins
Gross margins 90%+
Operating margin 16%+
The interesting story is margin expansion. Management has spent several years simplifying the technology stack and reducing costs. Margins have expanded materially since 2022.
Valuation
EV $27.5B
FCF TTM $4.1B
Yield 14.9%
Growth 5%+
Booking Holdings Inc
1997
Norwalk, Connecticut
Online travel agency
Revenue $27.7B
Employees 24,300
Market cap $120B
EV $122.6B
Booking Holdings is one of the world’s dominant online travel agencies (OTAs). It owns a portfolio of travel brands including:
https://t.co/mNQgtBPLDe
Priceline
Agoda
Kayak
OpenTable
https://t.co/MAt02se1QE
The core business is facilitating hotel, alternative accommodation, flight, rental car, and restaurant bookings globally. https://t.co/mNQgtBPLDe is the crown jewel and particularly dominant in Europe. The business is fundamentally an asset-light digital marketplace that earns commissions on bookings rather than owning hotels or airlines itself.
Competitors
Online travel agencies - Expedia Group, Airbnb
Metasearch - Google Travel, Tripadvisor
Regional OTAs - https://t.co/t2r7ciGZd5, MakeMyTrip
Direct booking - Marriott, Hilton, airlines, hotel chains
Alternative accommodations - Airbnb, Vrbo
Strengths
Dominant global online travel platform
Strong network effects and scale
Asset-light, high-margin business model
Exceptional free cash flow generation
Leading position in accommodations
Powerful global brands (https://t.co/mNQgtBPLDe, Priceline, Agoda, Kayak)
Significant operating leverage
Weaknesses
Heavy dependence on Google traffic
Cyclical exposure to global travel demand
High customer acquisition costs
Regulatory scrutiny in Europe and elsewhere
Mature core OTA markets in developed countries
Limited differentiation in some travel categories
Opportunities
Growth in alternative accommodations
Expansion in emerging markets
AI-driven personalization and trip planning
Connected trip ecosystem expansion
Payments and fintech monetization
Increased mobile and app engagement
Cross-selling flights, restaurants, and attractions
Threats
Google disintermediation/self-preferencing
Competition from Airbnb and Expedia
Hotels pushing direct booking channels
Rising digital advertising costs
Economic recessions reducing travel demand
Regulatory and antitrust actions
Geopolitical disruptions and pandemics
Margins
Operating margins 35%
Returns on capital
ROIC 60%+
Growth
Revenue 10%+
Valuation
FCF ~$9B
EV $122.6B
FCF yield 7.3%
Airbnb
2007
San Francisco, CA
Accommodations
Revenue $12.6B
Employees 8200
Market cap $80B
EV $70B
Airbnb is one of the most interesting platform businesses created in the last 20 years. It operates a global online marketplace that connects hosts offering accommodations (homes, apartments, cabins, unique stays, etc.) with travelers. Over time, it has expanded into experiences and travel-related services, but accommodations remain the core business.
Airbnb currently has more than 8 million active listings globally across over 220 countries and regions.
At its core, Airbnb solves three problems:
- Hosts monetize unused real estate
- Travelers get alternatives to hotels
- Airbnb provides trust infrastructure
Competitors
Direct Competitors
Online Travel Agencies (OTAs)
https://t.co/mNQgtBPLDe
Expedia Group
Vrbo/HomeAway
https://t.co/Rc1w6bf6hJ
Expedia
https://t.co/t2r7ciGZd5 Group
Traditional Hotels
Niche / Local Competitors
SWOT
Strengths
Extremely Powerful Network Effects
Asset-Light Business Model
Strong Global Brand
Structural Shift Toward Alternative Accommodations
Weaknesses
Regulatory Risk
Inconsistent Customer Experience
Dependence on Leisure Travel
Limited Loyalty Ecosystem
Management is weak
Opportunities
International Expansion
Experiences & Services
Longer-Term Stays
Professionalization of Hosts
Cost cuts could improve profitability - huge SG&A and R&D expenses
Threats
Aggressive Competition from https://t.co/mNQgtBPLDe
Regulation & Taxation
Reputational/Safety Issues
Hotels Fighting Back
Margins
Operating margins ~20%
Returns on Capital
ROIC ~20%
ROE ~30%
This is before adjusting for excess cash on the balance sheet
Debt - very low ~$2.5B (less than one year of free cash flow)
Growth - 15-20%+ revenue growth
Valuation
Free cash flow - $3B (after adjusting for share based comp)
EV $70B
Yield 4.3%
eBay Inc.
1995
San Jose, CA
Online auctions / collectibles
Revenue $11.6B
Employees 12,300
Market cap $48B
EV $51B
What they do: eBay is a global online marketplace connecting buyers and sellers in 190+ markets. It is mostly a third-party marketplace, not a retailer: sellers list goods, buyers purchase, and eBay earns fees from transactions, ads, shipping, subscriptions, and related services.
- $79.6B of GMV
- 135M buyers
They no longer own PayPal (spun out in 2015)
Sold StubHub in 2020 ($4B)
Sold classifieds business in 2020 ($9B)
Competitors
Amazon — biggest general e-commerce competitor.
Etsy / Depop / Vinted / Poshmark / Mercari — resale, fashion, collectibles, handmade.
Facebook Marketplace / Craigslist / Kijiji — local person-to-person selling.
StockX / GOAT / Whatnot — sneakers, collectibles, live commerce.
Auto parts marketplaces — RockAuto, Amazon, specialty auto sites.
SWOT
Strengths
Capital-light, high-margin marketplace.
Strong brand and buyer/seller network.
Excellent niche positions in collectibles, auto parts, refurbished goods, sneakers, luxury.
Large advertising opportunity.
Heavy buybacks reduce share count.
Weaknesses
Mature platform; long-term growth has been mediocre.
Less consumer mindshare than Amazon.
Buyer experience can feel inconsistent because sellers vary.
FCF has not grown consistently.
Marketplace trust/fraud/counterfeit issues require constant spending.
Opportunities
Recommerce / used goods tailwind.
Advertising revenue growth.
AI tools to improve listings, search, pricing, and seller productivity.
Depop acquisition could help younger fashion resale customers. eBay agreed to buy Depop for about $1.2B. (eBay Investor Relations)
International growth and category-specific verticalization.
Threats
Amazon, Facebook Marketplace, Etsy, Vinted, Poshmark, Mercari, Whatnot.
Search/discovery shifting to social/video platforms.
Seller fee pressure.
Counterfeit/fraud/trust issues
Revenue likely cyclical - discretionary purchases
Margins and returns on capital
Op margin ~20%
ROIC - 20% range
ROE - 40%+
Debt
Total debt $7B
Free cash flow $1.5B
Years 4.7 years
Valuation
EV $51B
Free cash flow ~$1.5B
Yield 2.9%
Growth
Revenue growth 10 year CAGR 3%
Free cash flow growth - none - flat for ~10 years
GameStop Corp. (GME)
1996
Grapevine, TX
Specialty retail
Revenue $3.6B
Employees 4000
Market cap $10.9B
EV $6.2B
GameStop is a specialty retailer focused on video games, gaming hardware, collectibles, and pop-culture merchandise. Historically, it was best known for selling physical video game discs and used games through mall-based retail stores. Today, it is trying to reinvent itself after the gaming industry shifted heavily toward digital downloads and subscription/cloud gaming. The company operates stores and e-commerce platforms primarily in the U.S., Canada, Australia, and parts of Europe.
The company became globally famous during the 2021 “meme stock” phenomenon, when retail investors coordinated online and drove the stock price dramatically higher, causing major losses for hedge funds that were short the stock. Since then, GameStop has raised large amounts of equity capital and accumulated a huge cash balance, giving it an unusually strong balance sheet relative to its shrinking retail operations.
Competitors
Gaming & electronics retailers
Best Buy, Walmart, Target
E-commerce
Amazon, eBay (especially collectibles/trading cards)
Digital game distribution
Sony PlayStation Store
Microsoft Xbox Store/Game Pass
Valve Corporation Steam
Nintendo eShop
SWOT
Strengths
Well-known gaming brand
Large collectibles/trading-card business
Improved cost discipline under Ryan Cohen
Ability to raise equity capital due to meme-stock status
Strong balance sheet due to equity raises (~$5B)
Weaknesses
Structural decline in physical game sales
Weak competitive moat
Revenue shrinking over time
Limited differentiation versus Amazon/Walmart
Highly volatile investor base
No clear durable long-term strategy
Management compensation scheme is highly rewarding to CEO
Opportunities
Expand collectibles and trading cards
Higher-margin niche gaming merchandise
Digital marketplace expansion
Leverage massive cash balance into acquisitions/investments
Possible transformation into a holding company or investment vehicle
International optimization/store rationalization
Threats
Digital downloads eliminating physical retail relevance
Cloud gaming/subscription gaming
Intense pricing competition
Hardware cycle volatility
Continued store traffic decline
Speculative capital allocation decisions
Potential destruction of shareholder value through large acquisitions
Margins - poor - almost zero average operating margins, has recently become profitable through cost cuts
Returns on capital - poor
GameStop Offers to Buy eBay for $56 Billion
https://t.co/9MPxNbV9bx
Ryan Cohen - unusual CEO
https://t.co/3lxM9Hen75
Amazon
1994
Seattle, Washington
Technology
Revenue $743B
Employees 1,576,000
Market cap $2933B
EV $3025B
Amazon is now three big businesses in one: a huge global retail/logistics marketplace, a very profitable cloud infrastructure business, and a fast-growing advertising/media/subscription platform.
Amazon serves consumers through online/physical stores, third-party seller programs, Prime, devices like Echo/Kindle/Ring, streaming/media, advertising, and AWS cloud services including compute, storage, databases, analytics, AI and machine learning.
AWS makes up 20% of revenue but 57% of operating income
Newer initiatives:
- Amazon LEO - satellite based WIFI
- Prime Air - drone delivery
- Prime Now - ultra fast delivery (20 minutes)
- AI initiatives
Competitors
Retail / marketplace: Walmart, Costco, Target, eBay, Temu/Shein, Shopify-enabled merchants
Cloud: Microsoft Azure, Google Cloud, Oracle Cloud, specialized AI cloud providers
Advertising: Google, Meta, TikTok, Walmart Connect, retail media networks
Streaming / content: Netflix, Disney, YouTube, Apple, Warner Bros. Discovery
Logistics: UPS, FedEx, USPS, regional couriers — though Amazon is also increasingly its own logistics network
SWOT
Strengths
Dominant global e-commerce platform with enormous scale and brand recognition
Massive logistics and fulfillment network that is extremely difficult and expensive to replicate
Strong ecosystem effects from Amazon Prime membership
Amazon Web Services is the global leader in cloud infrastructure and generates the majority of operating profits
Fast-growing, very high-margin advertising business leveraging shopping intent data
Huge customer data advantage across retail, cloud, media, and advertising
Strong culture of operational efficiency and long-term thinking
Large recurring revenue streams from AWS and Prime subscriptions
Significant bargaining power with suppliers, carriers, and vendors
Ability to enter adjacent industries using existing infrastructure and customer base
Founder-led culture still strongly influences decision-making and innovation
Weaknesses
Core retail business remains relatively low margin despite massive revenue
Extremely capital-intensive business requiring continuous investment in warehouses, transportation, and data centers
Increasing dependence on AWS profitability to support overall company economics
Regulatory and antitrust scrutiny in the U.S. and Europe
Large workforce creates labour relations and wage pressure risks
International retail operations historically less profitable than North America
Complex organization with many low-return experimental initiatives
Retail business vulnerable to consumer spending slowdowns
Heavy stock-based compensation dilutes shareholders over time
Massive AI/data center capex currently suppressing free cash flow
No return of capital to shareholders (no dividends or buybacks)
Opportunities
Continued global migration to cloud computing and AI infrastructure
Monetization of generative AI through AWS services and proprietary chips
Expansion of advertising business into a larger share of digital advertising market
Further automation in fulfillment and logistics could improve retail margins
Growth in healthcare, pharmacy, and prescription delivery
International e-commerce penetration still has room to grow
Expansion of same-day and grocery delivery services
Monetizing logistics infrastructure as a third-party shipping network
Growth in streaming/media ecosystem tied to Prime
Potential margin expansion if capex intensity eventually moderates
Threats
Aggressive competition from Microsoft Azure and Google Cloud in AI/cloud infrastructure
Increasing competition from low-cost e-commerce platforms like Temu and Shein
Antitrust lawsuits, regulation, or forced business restrictions/breakups
AI infrastructure spending could generate lower returns than expected
Rising shipping, labour, and energy costs
Cybersecurity and data privacy risks
Consumer backlash against marketplace quality issues or counterfeit products
Dependence on third-party sellers creates platform governance challenges
Recession risk impacting retail demand and advertising spending
Potential commoditization of cloud computing over the long term
Returns on capital
Low/moderate ROIC - 10% range
Higher returns on equity - mid 20%s
Return of capital to shareholders
Non-existent with no plans to return capital. No significant dividends or buybacks!
Growth
Revenue growth 10 year CAGR 20.7%
Valuation
EV $3025B
Free cash flow - not consistent - varies significantly due to high recent capex spend - currently negative!
-> spending HUGE sums of money on the AI arms race.
Based on a guestimate of ‘normalized’ free cash flow of $100B, yield is 3.3%
Read more
https://t.co/HDfAYArkl0
Alphabet Inc.
1998
Mountain View, California
Online advertising
Revenue $422B
Employees 190,000
Market cap $4615B
EV $4580B
Core segments
Google Services (~80–85% of revenue)
- Search (ads)
- YouTube (ads + subscriptions)
- Android / Chrome / Google Play
Google Cloud (~10–15%)
- Infrastructure + AI platform
Other Bets (small, loss-making)
- Waymo, Verily, etc.
Competitors
Search / Ads
Microsoft (Bing + AI)
Meta (attention + ad budgets)
Amazon (product search ads)
Cloud
Amazon AWS
Microsoft Azure
AI (new battleground)
OpenAI / ChatGPT
Microsoft (via OpenAI)
Meta (open-source models)
SWOT
Strengths
Dominant search monopoly
Dominant in user created video content (YouTube)
Android (smartphone OS duolopy)
Weaknesses
Cloud still less profitable than peers
Less disciplined and focused than other tech giants - “Other Bets” destroy capital
Advertising (70% of revenue) is cyclical
Opportunities
Cloud computing growing
Enterprise AI
Threats
AI is disrupting search monopoly in a significant way
Capex spend is exploding due to AI arms race with Open AI / Anthropic
- 2023 capex: ~$32B
- 2025 capex: ~$91B
- 2026 guidance: $175–190B!
Doesn’t / can’t return capital the same way as Apple
Regulatory / antitrust pressure
ROIC 2025 - 20% - Strong but declining
Revenue CAGR 10 year - 18.4%
Valuation
EV $4580B
FCF $64B
FCF yield 1.3%
Apple Inc. (AAPL)
1976
Cupertino, California
Consumer electronics
Revenue $422B
Employees 160,000
Market cap $4647B
EV $4610B
Apple is a vertically integrated consumer technology + platform company.
Core business model
Hardware ecosystem:
iPhone (≈50%+ of revenue historically)
Mac, iPad, Wearables (Watch, AirPods)
High-margin Services layer:
App Store, iCloud, Apple Music, Apple Pay, advertising
Closed ecosystem → drives:
Pricing power
Switching costs
Recurring revenue (services)
👉 Key insight: Apple is no longer just a hardware company—it’s a platform monetizing a billion+ installed devices.
Competitors
Hardware
Samsung Electronics (smartphones)
Dell Technologies / HP Inc. (PCs)
Ecosystem / software / services
Alphabet Inc. (Android, cloud, ads)
Microsoft (OS, cloud, productivity)
Amazon (devices, services)
SWOT
Strengths
Brand power (arguably strongest in world)
Tight ecosystem → lock-in + pricing power
Walled garden
Massive installed base → recurring services revenue
Weaknesses
Heavy reliance on iPhone (~50% revenue)
Premium pricing → vulnerable in downturns
Innovation perception risk (AI lag concerns recently)
Opportunities
Services expansion (high margin)
AI integration across ecosystem
Emerging markets penetration
Wearables / health ecosystem
Threats
Regulation (App Store, antitrust)
Platform risk (Google search payments)
Competition in AI
China/geopolitical + supply chain risk
ROIC - currently running at 65%
ROE - over 100% due capital light business and buybacks
Revenue growth
10 year - 7.1%
5 year - 6.8%
Free cash flow growth
10 year 6.9%
5 year 9.0%
Free Cash Flow
$100-$110B
-> Capex is very restrained versus Google (TTM $11B vs $110B!)
Valuation
EV $4610B
Free cash flow $110B
FCF yield ~2.4%
Growth 7%
Motorola Solutions Inc (NYSE: MSI)
1928
Chicago, Illinois
Communications technology
Revenue: $11.7B
Employees: ~22,000
Market cap: $71B
EV $80.8B
Motorola Solutions sells critical communications and safety technology to police, fire, emergency services, governments, schools, hospitals, utilities, transportation companies, and large enterprises.
Main areas:
Land mobile radio systems: P25, TETRA, APX radios, dispatch networks.
Command-center software: 911 call handling, dispatch, records, evidence, workflow tools.
Video security & access control: cameras, body-worn cameras, analytics, access control.
Managed/support services: maintenance, cybersecurity, software subscriptions.
This company and Motorola Mobility Inc. (MMI) were the descendants of the original Motorola Inc. started in 1928.
The company split into two in 2011. MMI was then sold to Google $12.5B. MMI was later resold by Google to Lenovo in 2014 for $2.9B. (Google kept most of the patents and IP).
Competitors
Public safety / radios: L3Harris, Kenwood/EF Johnson, Hytera, Airbus Secure Land Communications.
Body cameras / police tech: Axon.
Video security: Genetec, Verkada, Axis, Hanwha, Johnson Controls, Honeywell.
911 / dispatch / public-sector software: Tyler Technologies, CentralSquare, Hexagon, NICE.
Private wireless / networking: Nokia, Ericsson, Cisco in some areas.
SWOT
Strengths
Dominant installed base in public safety radio.
Sticky customers; switching is hard and risky.
Strong recurring revenue from software, services, maintenance.
Weaknesses
Significant government/customer concentration.
Debt increased after acquisitions, including Silvus.
Hardware exposure still matters, so supply chain and tariffs can hurt margins.
Growth appears to be by acquisition
Opportunities
More software and recurring revenue.
AI tools for dispatch, report writing, video analytics.
Body cameras and integrated police workflow.
Upgrades to aging emergency communications systems.
International public safety modernization.
Threats
Budget pressure at municipalities/governments.
Axon very strong in police tech.
Cybersecurity risk.
Regulatory/privacy pushback around surveillance.
Acquisition integration risk.
Returns on capital
High operating margins - mid 20s%
High ROIC - mid 20s%+
Valuation
EV $80.8B
Free cash flow $2.5B
Yield 3.1%
Organic growth 3-6%
Bayer Aktiengesellschaft
1863
Leverkusen, Germany
Pharmaceuticals and agricultural chemicals
Revenue: €45.5B
Employees: ~100,000
Mkt cap €38B
EV €67.5B
Bayer is a global life sciences conglomerate with three core segments:
1) Pharmaceuticals
Prescription drugs (cardiology, oncology, kidney disease)
Key drugs: Xarelto (declining), Nubeqa, Kerendia
Growth constrained by patent expiries (notably Xarelto)
2) Crop Science (largest profit driver)
Seeds (corn, soy, etc.)
Crop protection chemicals (herbicides, pesticides)
Acquired via Monsanto (2018) → massive strategic + legal impact
3) Consumer Health
OTC brands (Aspirin, Claritin, etc.)
Stable but low-growth, decent margins
Competitors
Pharma
Pfizer
Novartis
Merck & Co.
Crop science / ag inputs
Corteva
Syngenta
BASF
Consumer health
Johnson & Johnson
GSK
SWOT
Strengths
Diversified earnings base (pharma + agriculture)
Strong crop science franchise (global scale, seeds + chemicals)
Solid pipeline (Nubeqa, Asundexian, etc.)
Large global distribution
Weaknesses
Terrible capital allocation (Monsanto deal)
Heavy debt (~€30bn net debt)
Weak pharma growth vs peers
Conglomerate structure → valuation discount
Opportunities
New pharma launches (post-Xarelto gap)
Crop science margin expansion targets
Potential breakup (often discussed by investors)
Threats
Roundup litigation overhang (massive)
Patent cliffs (Xarelto)
Commodity exposure (ag cycle)
Regulatory risk (both pharma + chemicals)
Returns on capital
ROIC - poor - mid single digits
Because:
- greatly overpaid for Monsanto acquisition ~€55B (at the top of the agricultural cycle)
- facing huge lawsuits (USD $22B+ total costs) related to herbicide RoundUp acquired through Monsanto deal
https://t.co/La6WjcxU5h
Legal
Bayer is trying to narrow/limit the litigation in a case now before the US Supreme Court
https://t.co/yW0AM3hSZf
Debt - heavy debt load - €37.6B - maybe 10 years of free cash flow
EPS from ‘core’ earnings varies significantly from GAAP EPS (€4.91 vs -€3.68)
Management
Doesn’t appear to be a well managed company. Not tightly focused. No one has skin in the game - just corporate managers doing their thing and collecting a big paycheck. Bureaucratic and not shareholder focussed.
Valuation
EV €67.5B
2025 Free cash flow €2.1B
Normalized could be ~€5B (once lawsuits are all settled)
Yield on normalized 7.0%
Growth - low maybe 1-3%