Indicators are just tools. They react to price; they don’t create it.
The market rewards:
•Timing (entering when institutions step in)
•Risk management (cutting fast, letting winners work)
•Patience (waiting for clean setups — like your hungry lion style
•Trend alignment (price > opinions > indicators)
Most traders overload indicators because they want certainty.
The market rewards those who accept uncertainty and execute well anyway.
Indicators help you see.
Price action and volume tell you who is in control.
Discipline decides who gets paid.
🧵 COMPLETE SWING TRADING STRATEGY (Beginner → Pro)
This is how swing traders consistently extract money from the market without overtrading, guessing, or gambling.
If you trade Forex, Gold, or Indices — save this. 👇
1/
Most traders fail because they trade everything.
Professionals win because they trade conditions.
This strategy answers 4 questions clearly:
• Trend
• Entry
• Confirmation
• Risk
No confusion. No noise.
2/
TIMEFRAME:
📊 4H chart
Why 4H?
• Less noise than lower TFs
• Clear structure
• Perfect balance for swing trading
• Works even if you have a day job
Patience beats speed.
3/
MARKETS TO TRADE:
• XAUUSD (Gold)
• EURUSD
• GBPUSD
Why these?
• High liquidity
• Clean price action
• Respect technical levels
• Institutions are active here
Trade what moves cleanly, not what moves fast.
4/
INDICATORS (Keep it simple):
✅ 200 EMA → Trend filter
✅ 20 EMA → Pullbacks & entries
✅ RSI (14) → Momentum confirmation
No indicator stacking.
Price first. Indicators second.
🔴 SELL SETUP (Short Trades)
5/
Rule #1 – Trend Direction
Price must be BELOW 200 EMA
→ This tells you the market is bearish
If you sell above 200 EMA, you’re fighting institutions.
6/
Rule #2 – Pullback
Wait for price to retrace back to the 20 EMA
Why?
Because strong trends don’t move straight down.
They breathe… then continue.
Patience = profit.
7/
Rule #3 – Rejection Candle
At the 20 EMA, wait for a bearish signal:
• Bearish Engulfing
• Pin Bar
• Strong rejection wick
No candle = no trade.
8/
Rule #4 – Momentum Check
RSI must be BELOW 50
This confirms sellers are still in control.
Trend + pullback + momentum = alignment.
9/
STOP LOSS (SELL):
Above the pullback high
TAKE PROFIT:
Minimum 1:2 Risk–Reward
Trail if trend remains strong.
Risk management keeps you alive. RR makes you rich.
🟢 BUY SETUP (Long Trades)
10/
This is the mirror image. No new rules. No confusion.
Rule #1 – Trend Direction
Price must be ABOVE 200 EMA
If price is above → buyers control the market.
11/
Rule #2 – Pullback
Price pulls back to the 20 EMA
Strong uptrends don’t collapse — they retrace and continue.
12/
Rule #3 – Rejection Candle
Look for:
• Bullish Engulfing
• Pin Bar
• Strong bullish close off the EMA
Let price confirm your bias.
13/
Rule #4 – RSI Confirmation
RSI must be ABOVE 50
This confirms bullish momentum is intact.
14/
STOP LOSS (BUY):
Below the pullback low
TAKE PROFIT:
1:2 RR minimum
Scale or trail when structure supports it.
Survive first. Compound second.
15/
⚠️ MOST IMPORTANT RULE:
You do NOT trade every day.
If there’s no clean trend + pullback + confirmation —
You sit on your hands.
I make money when I’m NOT trading.
16/
This strategy works because it aligns you with:
• Trend (200 EMA)
• Timing (20 EMA)
• Psychology (RSI & rejection)
You’re trading with institutions, not against them.
17/
If you want consistency:
• Stop chasing breakouts
• Stop predicting reversals
• Stop overtrading
Trade pullbacks in strong trends.
Simple. Boring. Profitable.
18/
Save this thread
🔁 Retweet to remind yourself
❤️ Like if you want more REAL trading education
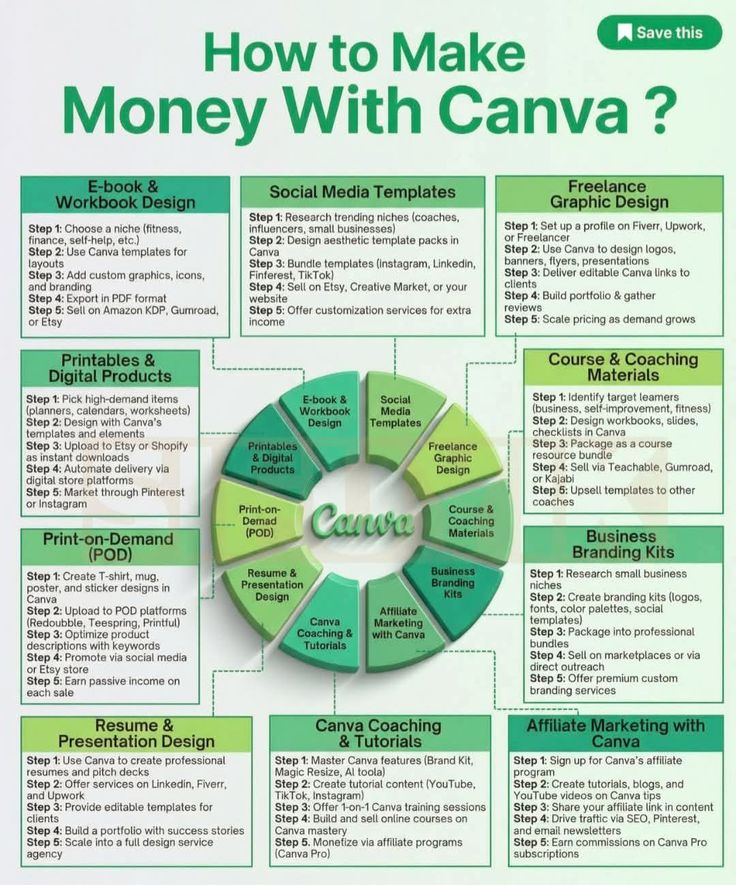
💸 Want to make money using Canva — even if you're not a designer?
This thread breaks down 10 proven ways to earn online with Canva in 2026.
No fluff. No fake promises. Just real strategies that work.
📌 Save this post
👇 Read the full thread to start earning
The Three Line Strike is a continuation candlestick pattern. In a bullish version, three rising candles are followed by a large bearish candle that engulfs them, signaling trend continuation. In a bearish version, three falling candles are followed by a large bullish candle engulfing them. Traders use it to anticipate trend continuation in either direction.
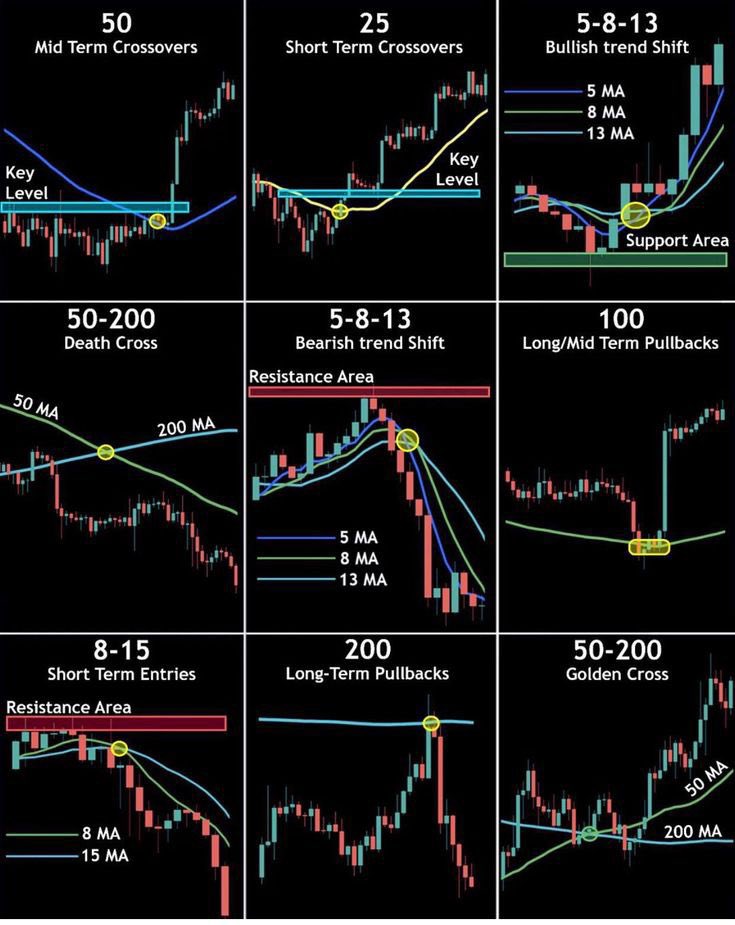
9 MOVING AVERAGE ROAD MAP.
1.50 mid term crossover
2.25 short term crossover
3.5-8-13 Bullish trend
4.50-200 Death cross
5.5-8-13 Bearish trend shift
6.100 Long/mid term Pullbacks
7.8-15 Short term entries
8.200 Long term Pullbacks &
9.50-200 Golden cross
TECHNICAL INDICATORS:
1.Trend Indicators
✔️ADX
✔️Moving Averages
✔️Parabolic SAR
2.Volume Indicators
✔️Chaikin Oscillator
✔️Volume ROC
3.Volatility Indicators:
✔️ATR
✔️Bollinger Bands
✔️Standard Deviation
4.Momentum Indicators
✔️RSI
✔️CCI
✔️Stochastic’s
BUT
5/8/13 EMA Short term
20/50EMA Midterm
50/200EMA Long term
200EMA Value Zone
150 EMA Potential reversal
100EMA Big price dip
Don’t panic Choose one work better for you:
The 5-8-13 SMA combination helps day traders identify market trends and manage risk more effectively. Using short-term settings like the 5-, 8-, and 13-period SMAs highlights momentum shifts and provides clearer signals for potential entry and exit points.
#daytrader #MarketTrends #RiskManagement #Momentum