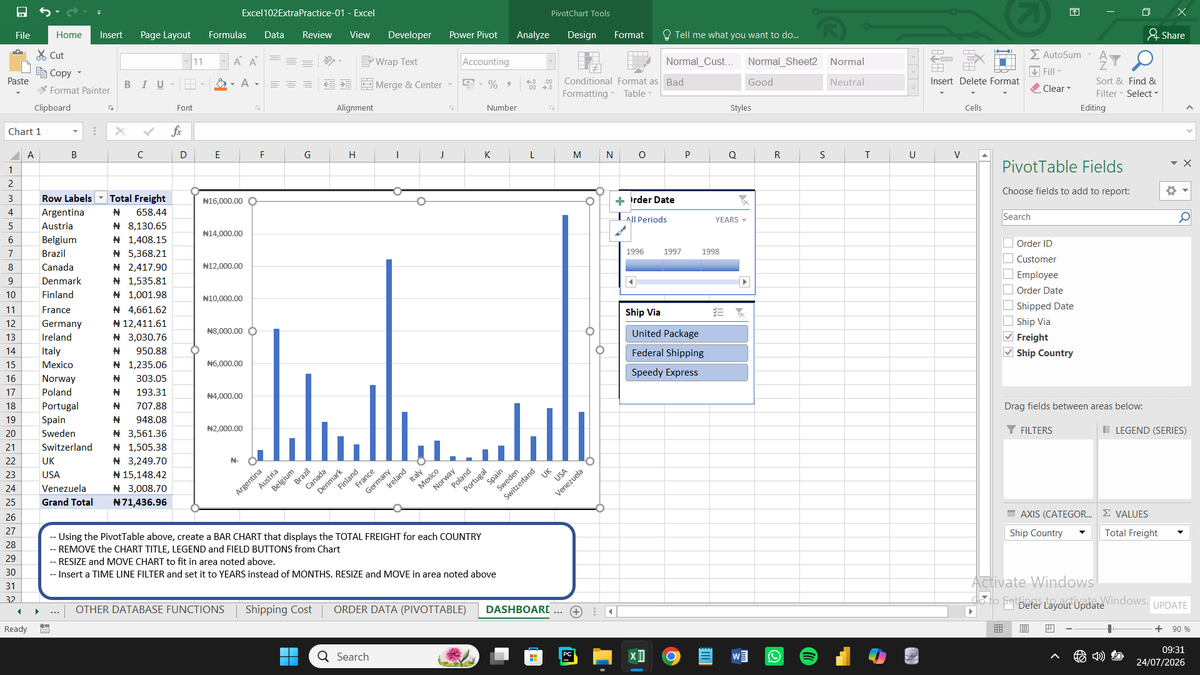
Day 7 of my Excel & Data Analytics Journey
Today I completed Excel 102 (Intermediate), learning Power Pivot, Data Models, KPIs, DSUM, and interactive dashboards. Every lesson is helping me think like a data analyst. Next stop: Excel Advanced.🚀
#Excel#DataAnalytics#virałpost
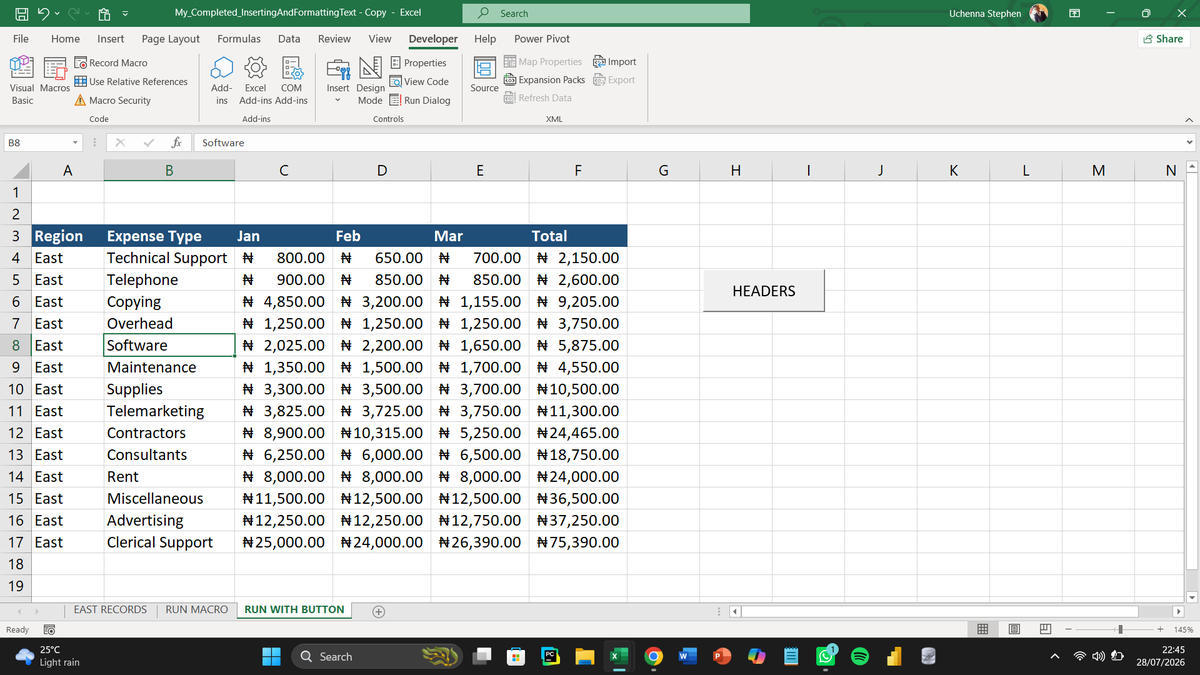
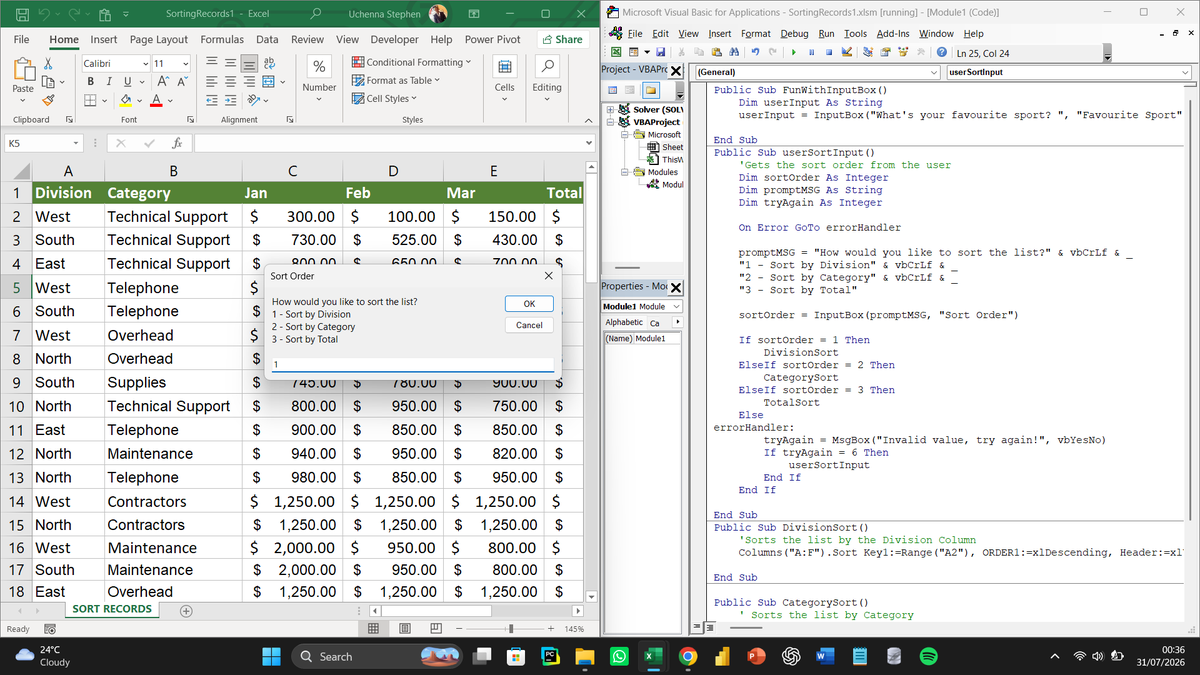
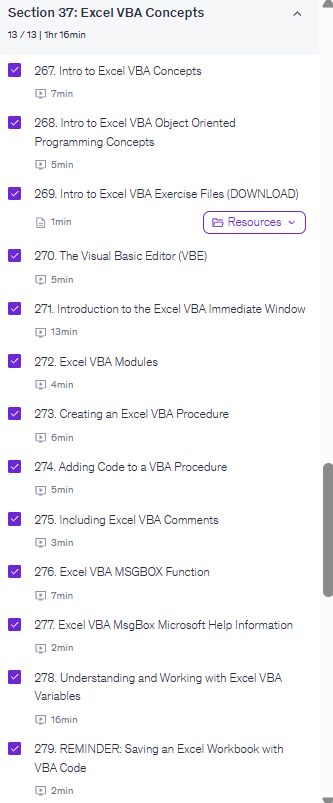
Day 13 of my Excel & Data Analytics Journey
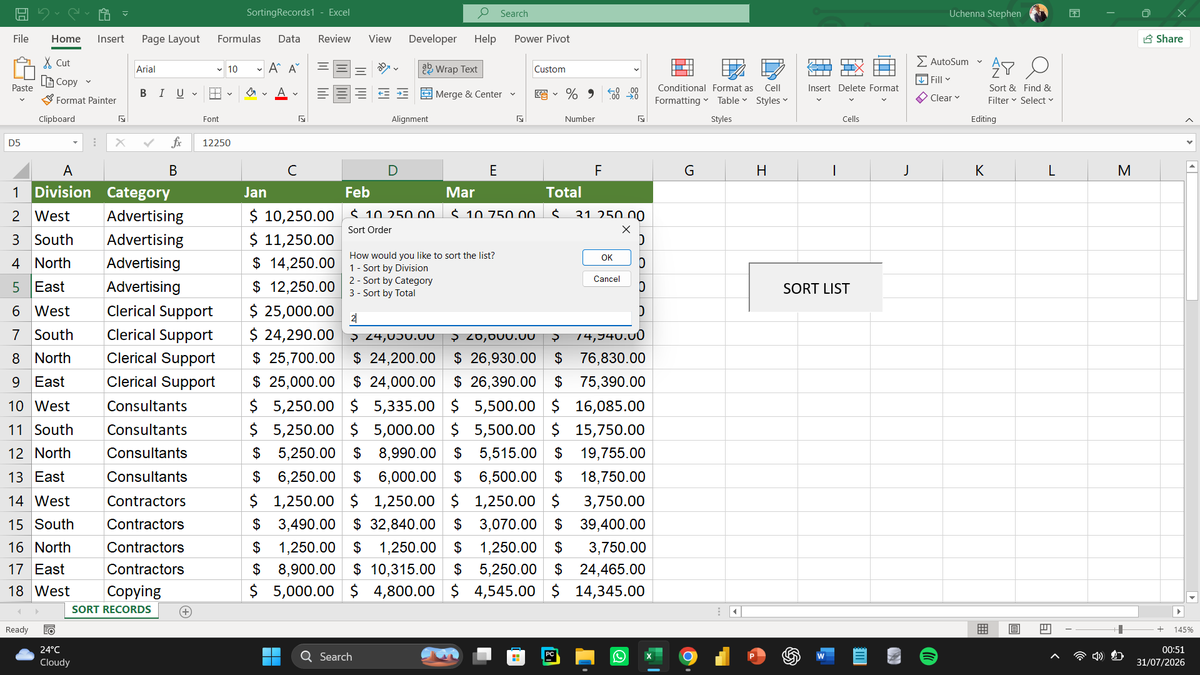
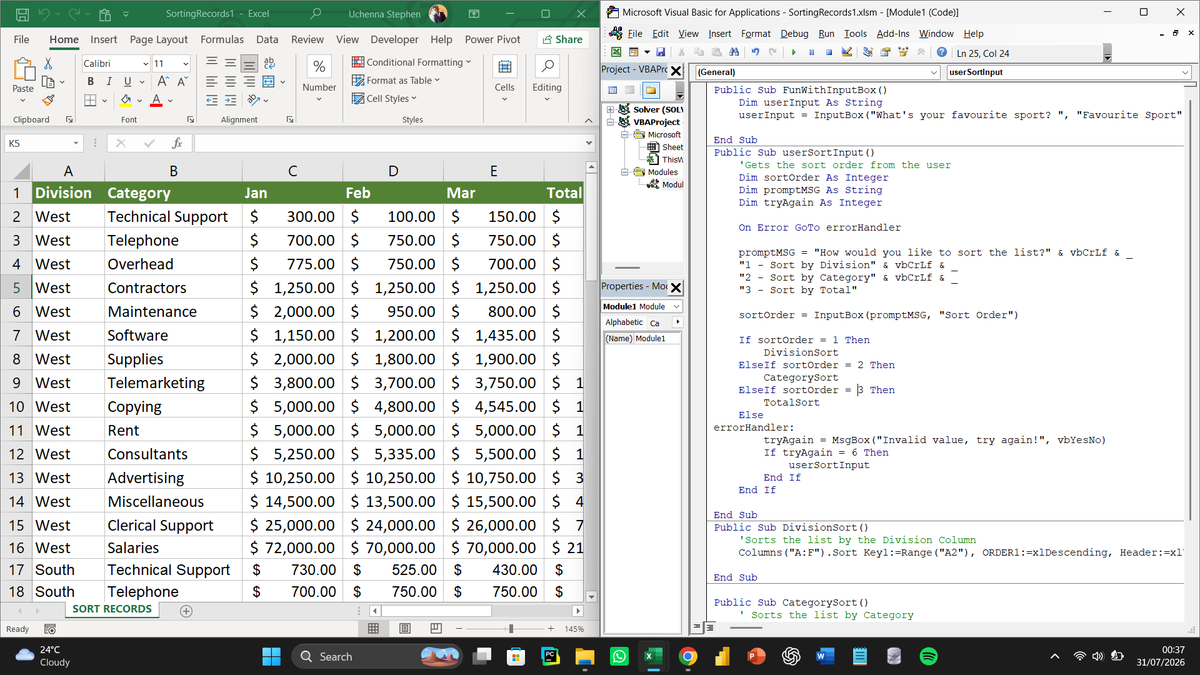
Today I learned the fundamentals of Excel VBA, including variables, procedures, logic statements, loops, and user input.
It's giving me a better understanding of how Excel tasks can eventually be automated.
#DataAnalysis#Excel#SQL
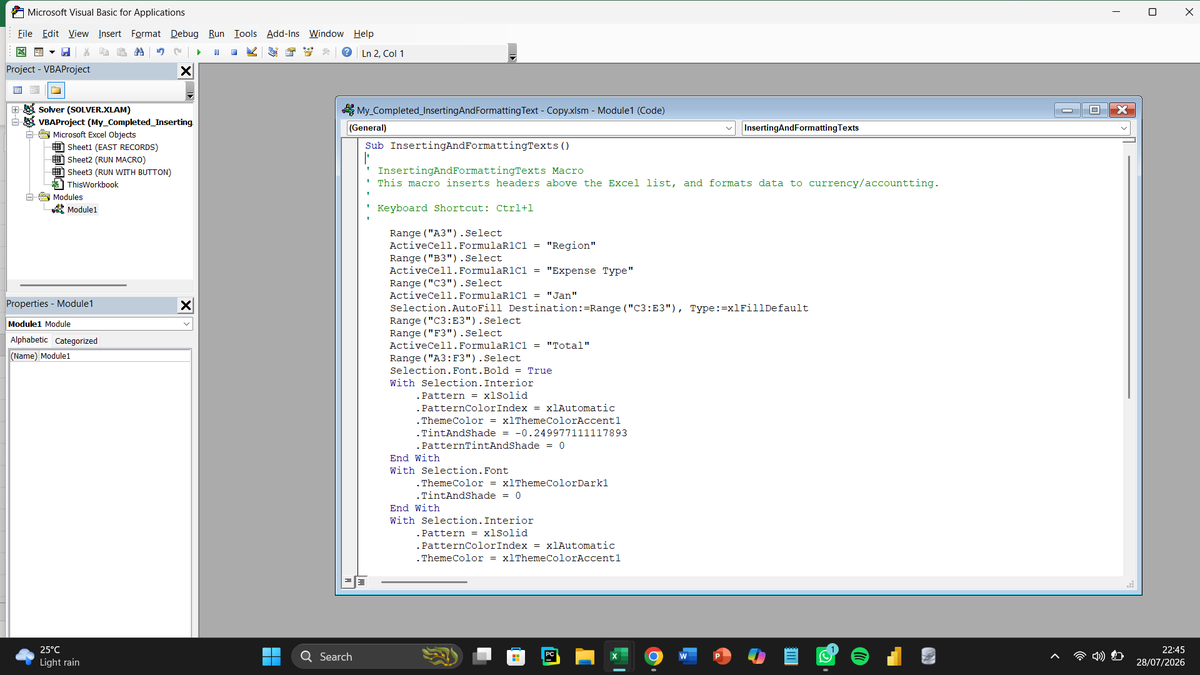
Day 13 of my Excel & Data Analytics Journey
I always thought programming was separate from Excel.
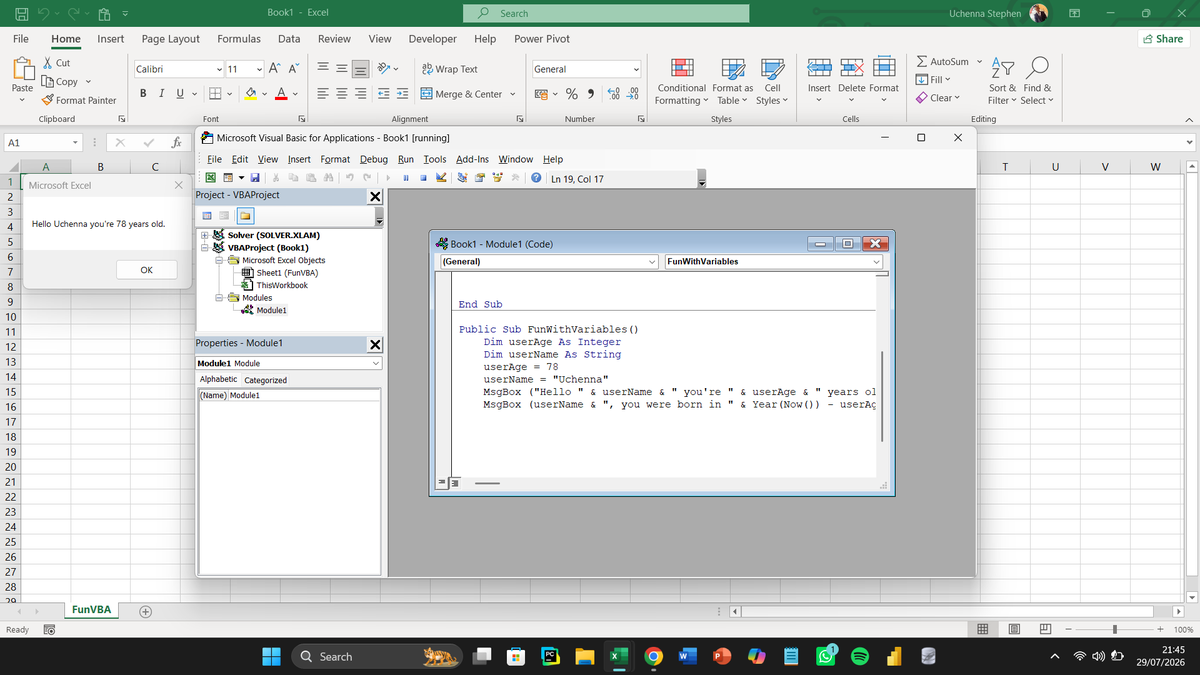
Today I discovered Excel has its own programming language.
Writing my first VBA code changed how I look at spreadsheets. There's more to Excel than I imagined.
#LearningInPublic
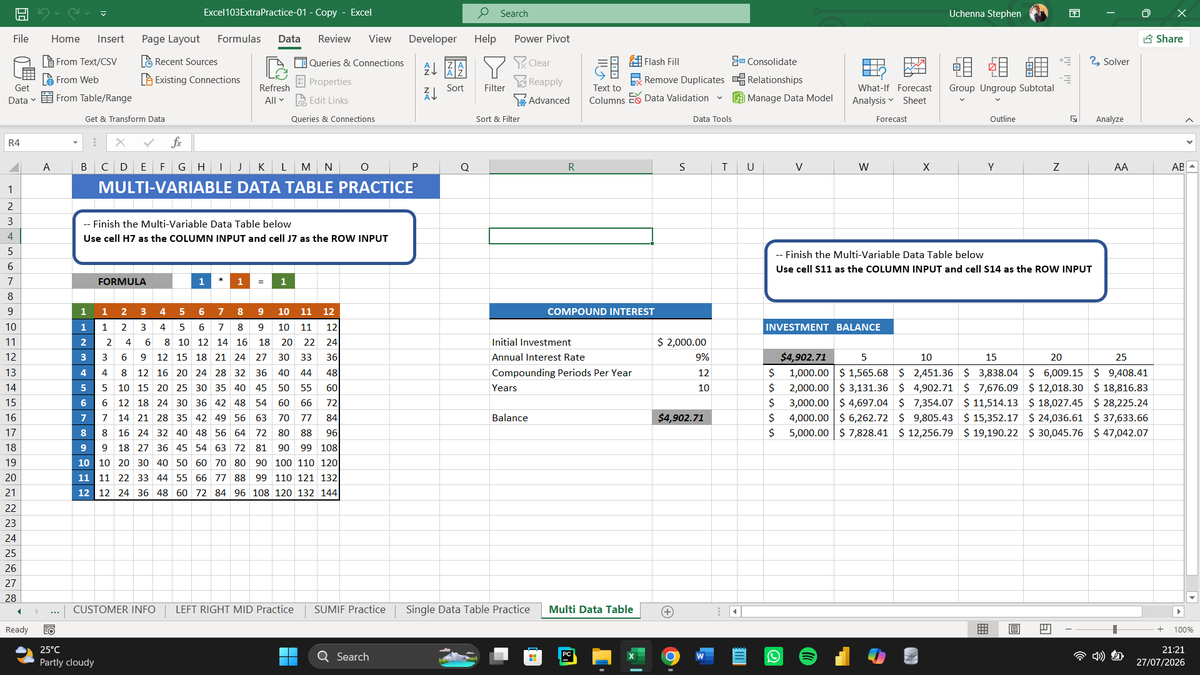
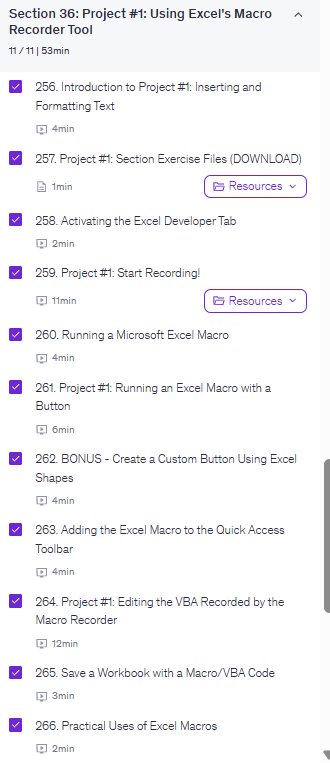
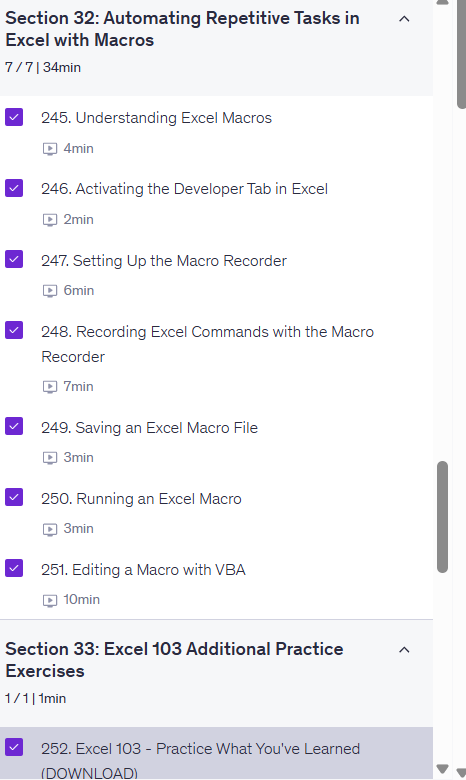
Day 12 of my Excel & Data Analytics Journey
Today I stopped thinking like an Excel user.
I started thinking like someone who builds processes.
Every repeated click can become an automated task.
Small shift. Big difference.
#90DaysOfLearning#DataAnalysis#Excel#LearningInPublic
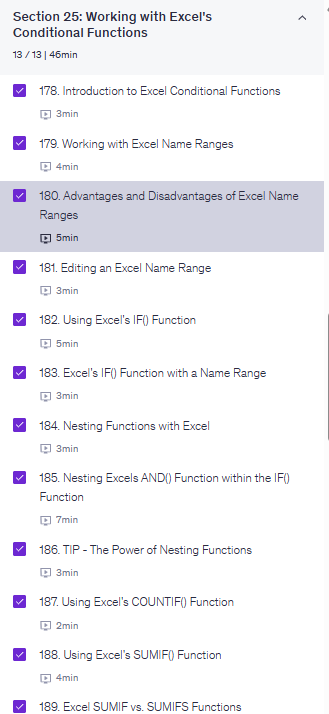
Day 11 of my Excel & Data Analytics Journey
I used to think Excel was only for analysis.
Today I learned it can automate repetitive tasks too.
Every lesson keeps changing how I think about spreadsheets.
#90DaysOfLearning#DataAnalysis#Excel#LearningInPublic#Python
@fabiolauria92 I appreciate this perspective. I'm early in my data analytics journey, so I'm focusing on understanding the fundamentals first. Out of curiosity, what tools or platforms do you think SMEs should prioritize for automated insights?
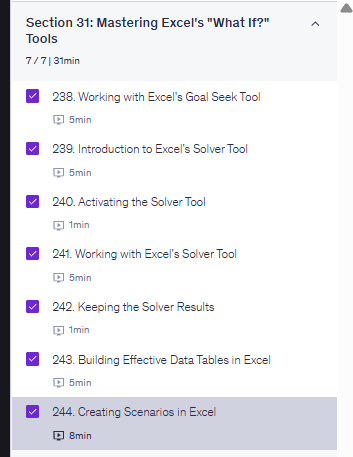
Day 10 of my Excel & Data Analytics Journey
Today I discovered that Excel isn't just for calculations.
It can answer business questions like:
•What's the cheapest production plan?
• What happens if sales increase?
👇
#90DaysOfLearning#DataAnalysis#Excel#LearningInPublic
Excel Solver found the optimal solution in seconds.
That's when it clicked that Excel isn't just about formulas. It's also about optimization and decision-making.
Scenario Manager was an interesting tool. Instead of editing values repeatedly, I could compare scenarios instantly.
• What's the best solution under real-world constraints?
Every day, Excel feels less like a spreadsheet and more like a decision-making tool.
One exercise challenged me to minimize shipping costs while meeting warehouse demand and staying within each plant's production capacity
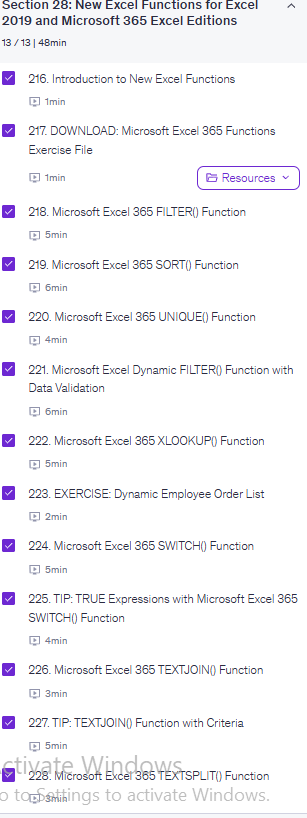
Day 9 of my Excel & Data Analytics Journey
Today I learned features like FILTER(), XLOOKUP(), UNIQUE(), and TEXTJOIN(), and it's amazing how much modern Excel can automate.
What's your favorite Excel function? #Excel#DataAnalytics#Excel365#LearningInPublic#Python#SQL
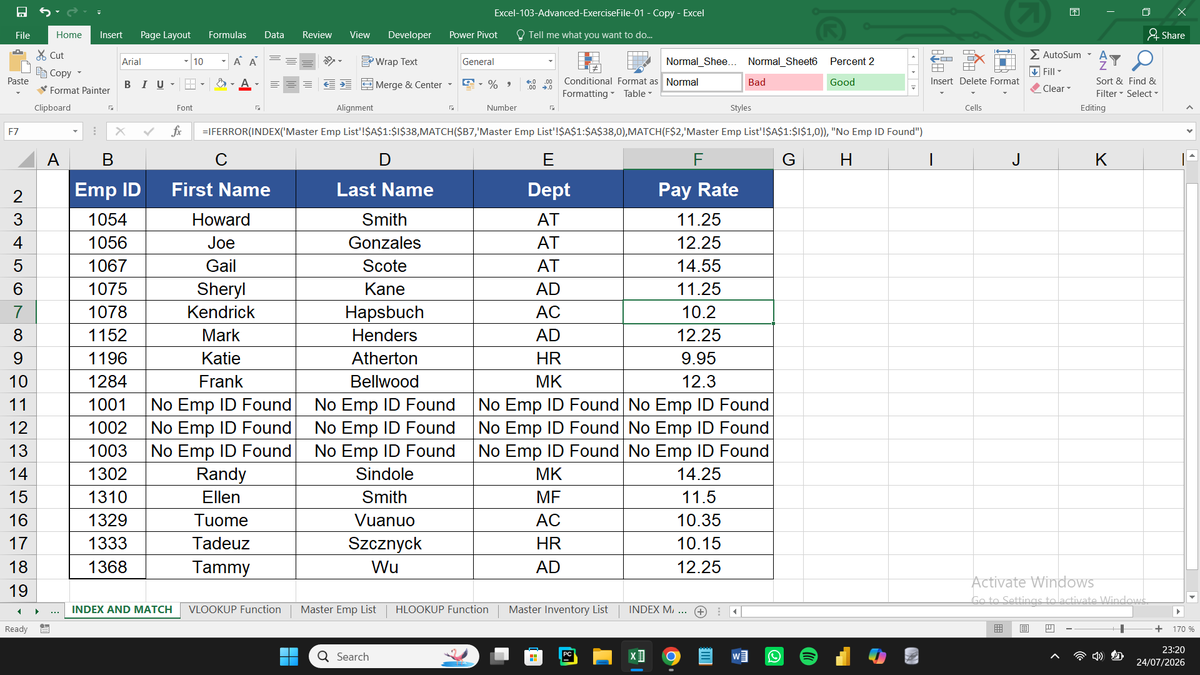
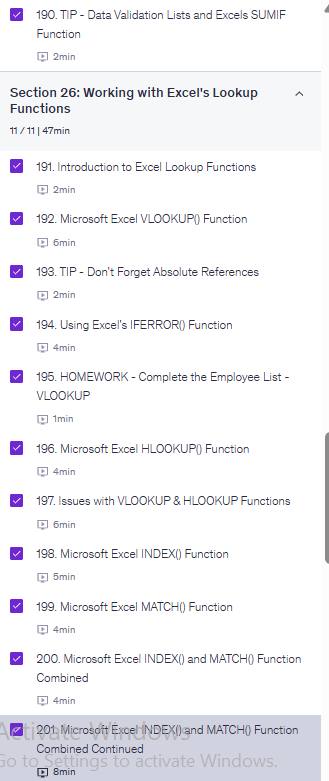
Today's lessons also covered IF, COUNTIF, SUMIF, SUMIFS, VLOOKUP, HLOOKUP, IFERROR, and INDEX + MATCH. It was a packed session, but working through the exercises helped everything make much more sense.
Day 8 of my Excel & Data Analytics Journey
Today, INDEX + MATCH finally clicked. It was my toughest lesson so far, but completing the exercise helped everything make sense. One step closer to becoming a data analyst.
#Excel#DataAnalytics#ExcelTips#Analysis#LearningInPublic
Power Query was probably my biggest takeaway from Excel 102. Seeing how data can be cleaned and transformed without touching the original dataset completely changed how I think about Excel.
On to Excel Advanced.🚀📈
Day 7 of my Excel & Data Analytics Journey
Today I completed Excel 102 (Intermediate), learning Power Pivot, Data Models, KPIs, DSUM, and interactive dashboards. Every lesson is helping me think like a data analyst. Next stop: Excel Advanced.🚀
#Excel#DataAnalytics#virałpost
Power Query was probably my biggest takeaway from Excel 102. Seeing how data can be cleaned and transformed without touching the original dataset completely changed how I think about Excel.
On to Excel Advanced. 📊
Day 6 of my Excel & Data Analytics Journey
Today's lessons introduced me to two of the most powerful tools in Excel: PivotTables and Power Query.
I learned how to summarize thousands of rows of data in just a few clicks using PivotTables, create PivotCharts
Continued in the CS
✅ Grouping data by dates and categories
✅ Using Slicers to filter reports
✅ Importing data with Power Query
✅ Cleaning and transforming datasets
✅ Creating relationships between multiple tables
for better visualization, and group data by categories and dates.
I also explored Power Query, where I learned how to import, clean, transform, and combine datasets without editing the original data manually.
Today's highlights:
✅ Creating PivotTables
✅ Building PivotCharts