$ASTS was down to $77.12 earlier, below both its 200-day SMA ($80.46) and the $77.64–$79.51 Gann/Fib zone (0.618 Fib at $77.64).
Then it managed to close the week above both at $80.66, (also a Gann arc at $80.52) with 30mm shares traded on the day.
Levels above include 0.786 log Fib at $87.84 → log Fib/Gann level at $92.32–$94.53 → Fib high at $102.79.
Below is log Fib/Gann level at $71.19–$73.08 → 0.382 log Fib at $65.28 → Gann level at $61.78–$62.84.
Charts for reference. NFA.
$ASTS down 10% to $77.14, lost its 200-day SMA ($80.44). Also below the log Fib/Gann level at $77.64–$79.51 (0.618 Fib at $77.64).
Below is log Fib/Gann level at $71.19–$73.08 → 0.382 log Fib at $65.28 → Gann level at $61.78–$62.84.
Levels above include 0.786 log Fib at $87.84 → log Fib/Gann level at $92.32–$94.53 → Fib high at $102.79.
Charts for reference. NFA.
$ZETA at $18.80 (+1.6%), down to $17.82 earlier but reversed back above the log Fib/Gann level at $18.17–$18.61 and its 200-day SMA ($18.73).
Levels above include Gann level at $19.21 (EMA50 also at $19.26) → 0.5 log Fib at $20.21 → log Fib/Gann level at $21.67–$22.04 → 0.618 log Fib at $23.48.
Below is 0.382 log Fib at $17.39 → Gann level at $16.55 → Gann level at $14.99–$15.66.
Charts for reference. NFA.
$PLTR at $127.87 (−2.1%), down to $125.01 but reclaimed the log Fib/Gann level at $125.41–$126.26 (Fib high at $125.41).
Levels above include log Fib/Gann level at $138.88–$141.78 → log Fibs at $147.64–$151.53 → log Fibs at $157.62–$159.56 (1.618 Fib at $157.62).
Below is log Fib/Gann level at $120.75–$123.21 (Fib low at $122.68) → 0.886 log Fib at $116.58 → 0.786 log Fib at $109.36.
Charts for reference. NFA.
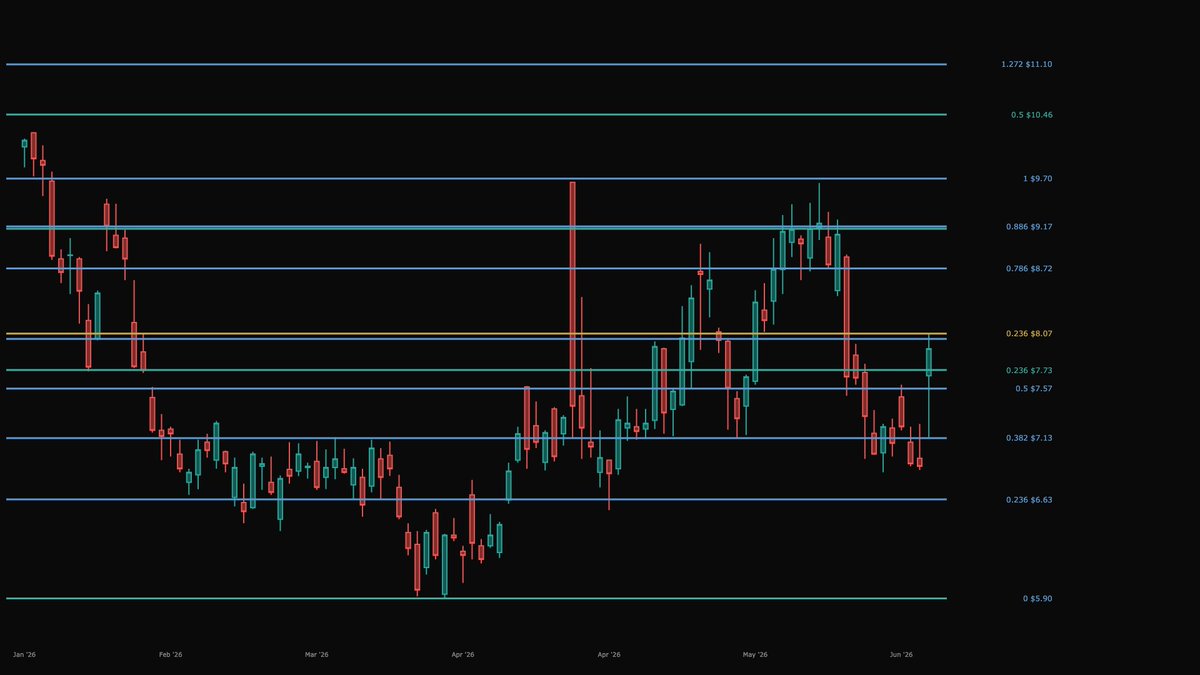
$QS up 15% to $7.93, broke above the 0.382 log Fib at $7.13 and the log Fibs at $7.57–$7.73 today. Testing the log Fib/Gann level at $7.94–$8.07 (0.618 Fib at $8.02).
Reclaimed its 21 and 50 EMA ($7.72/$7.74), RSI back above 50 (now 52.3).
Levels above include 0.786 log Fib at $8.72 → log Fibs at $9.14–$9.17 → log Fibs at $9.47–$9.70 (Fib high at $9.70).
Below is Gann level at $6.79 → log Fib/Gann level at $6.36–$6.65 → log Fib/Gann level at $5.90–$6.05 (Fib low at $5.90).
Charts for reference. NFA.
$HIMS up 7% to $34.03 - Reclaimed its 200-day SMA ($33.35) after a daily BB squeeze.
Now between levels — log Fib/Gann at $35.59–$36.00 (0.618 Fib at $36.00) above, log Fib/Gann at $29.95–$31.67 below.
Levels above include log Fib/Gann level at $38.56–$38.67 (0.618 Fib at $38.56) → log Fibs at $46.64–$46.78 → Gann level at $49.08.
Below is Gann level at $27.52 → 0.382 log Fib at $26.00 → log Fibs at $24.92–$25.40 (Fib high at $25.40).
Charts for reference. NFA.
$ASTS down 10% to $77.14, lost its 200-day SMA ($80.44). Also below the log Fib/Gann level at $77.64–$79.51 (0.618 Fib at $77.64).
Below is log Fib/Gann level at $71.19–$73.08 → 0.382 log Fib at $65.28 → Gann level at $61.78–$62.84.
Levels above include 0.786 log Fib at $87.84 → log Fib/Gann level at $92.32–$94.53 → Fib high at $102.79.
Charts for reference. NFA.
$BTBT up 10% to $2.12. Broke above log Fib/Gann level at $1.95–$2.00 and Gann level at $2.04 today. Up to $2.16 earlier but couldn’t hold above 0.5 log Fib at $2.13.
8 EMA crossed above its 21 EMA, and MACD crossed above its signal line.
Levels above include log Fib/Gann level at $2.24–$2.27 (SMA200 at $2.26) → 0.618 log Fib at $2.42 → log Fib/Gann level at $2.57–$2.68.
Below is 0.382 log Fib at $1.88 → 0.236 log Fib at $1.79 → log Fib/Gann level at $1.57–$1.61.
Charts for reference. NFA.
$ASTS down ~5% to $83.04, right above the $77.64–$80.60 zone where 0.618 Fib, multiple Gann levels, and its SMA 200 all stack.
MACD below zero and the 8 EMA crossed below the 50 EMA.
Charts for reference. NFA
$ASTS up ~6% to $87.57 today off the zone it sold down to Friday, where 0.618 log Fib ($77.64), Gann level ($79.65), and SMA200 ($79.95) all stack.
Tagged $89.76 earlier but closed just beneath 0.786 log Fib at $87.84.
Levels above include log Fib/Gann at $92.32-$94.53 → Fib high at $102.79 → Gann level at $112.52-$116.00.
Charts for reference. NFA.
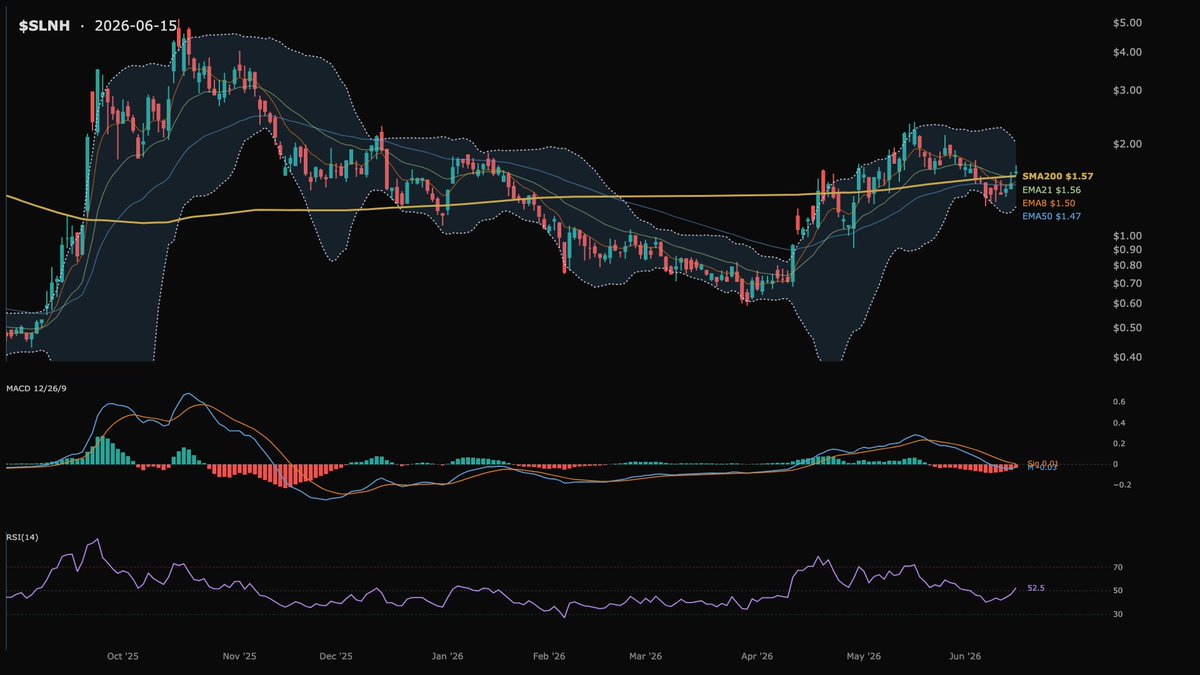
$SLNH right above log Fib/Gann level at $1.67-$1.74.
Also broke above Gann level at $1.51-$1.53 and Gann level at $1.60-$1.62 today.
Levels above include 0.886 log Fib at $1.96 → log Fibs at $2.25-$2.29 (0.618 at $2.25, Fib high at $2.29) → Gann level at $2.36-$2.47.
Below is Gann level at $1.44-$1.48 → log Fibs at $1.35-$1.36 (0.618 Fib at $1.36) → Gann level at $1.23-$1.24.
Charts for reference. NFA.
$ASTS up ~6% to $87.57 today off the zone it sold down to Friday, where 0.618 log Fib ($77.64), Gann level ($79.65), and SMA200 ($79.95) all stack.
Tagged $89.76 earlier but closed just beneath 0.786 log Fib at $87.84.
Levels above include log Fib/Gann at $92.32-$94.53 → Fib high at $102.79 → Gann level at $112.52-$116.00.
Charts for reference. NFA.
$ASTS — 54M shares today and closed at $82.41 (-15.5%). The selling cooled 2% above the zone where 0.618 log Fib ($77.64), Gann level ($79.70), and daily SMA 200 ($79.76) all stack.
Charts for reference. NFA
$SLNH above Gann level at $1.60.
Also broke above Gann level at $1.45-$1.51 today.
Up to $1.71 earlier but couldn't hold above Gann level at $1.67 or fibs at 1.71-1.74.
Levels above include 0.886 log Fib at $1.96 → log Fibs at $2.25-$2.29 (0.618 at $2.25, Fib high at $2.29).
Below is log Fibs at $1.35-$1.36 (0.618 Fib at $1.36) → Gann level at $1.29 → Gann level at $1.23.
Charts for reference. NFA.
$SIDU down 6% to $3.54, near 0.618 log Fib at $3.55.
Levels above include Gann level at $4.11-$4.17 → 0.786 log Fib at $4.26 → 0.886 log Fib at $4.76.
Below is 1.618 log Fib at $3.39 → Gann level at $3.25 → 0.5 log Fib at $3.11.
Charts for reference. NFA.
$ETH also testing Gann level at $1,638.
Levels above include log Fib/Gann level at $1,714-$1,724 → log Fib/Gann level at $1,924-$1,972 → log Fib/Gann level at $2,094-$2,097.
Below is log Fib/Gann level at $1,507-$1,515 (Fib low at $1) → Fib high at $1,433 → log Fib/Gann level at $1,338-$1,359.
Charts for reference. NFA.
$ASTS — 54M shares today and closed at $82.41 (-15.5%). The selling cooled 2% above the zone where 0.618 log Fib ($77.64), Gann level ($79.70), and daily SMA 200 ($79.76) all stack.
Charts for reference. NFA