@DC_Draino The degree of your ignorance is astounding. To the point that I think you know you are twisting the facts, but do it anyway for you political gain. Shameful.
dead people, dead children, destroyed buildings are typical news in Ukraine after 24th of February. but it's extremely hard to handle it today.
it's Vynnytsya. and creating maps is literally the one thing which made me stop crying. #GenocideOfUkrainians#russiaisaterrorisstate
My hometown #Vinnytsia One of the central squares. No military object anywhere near. As of now: 23 dead, 3 of them children. 90+injured, 46 of them critically, 42 missing. All were civilians. It’s a statement of fact that #russiaisaterrorisstate
@TimothyDSnyder , just heard you on @chrislhayes about Zelensky asking for russian words for show, bc now way he wouldn't know. My datum: As dual UA/RU speaker I can relate to Z: you often blank out, so having a person to jump in with translation is handy for high stakes comms.
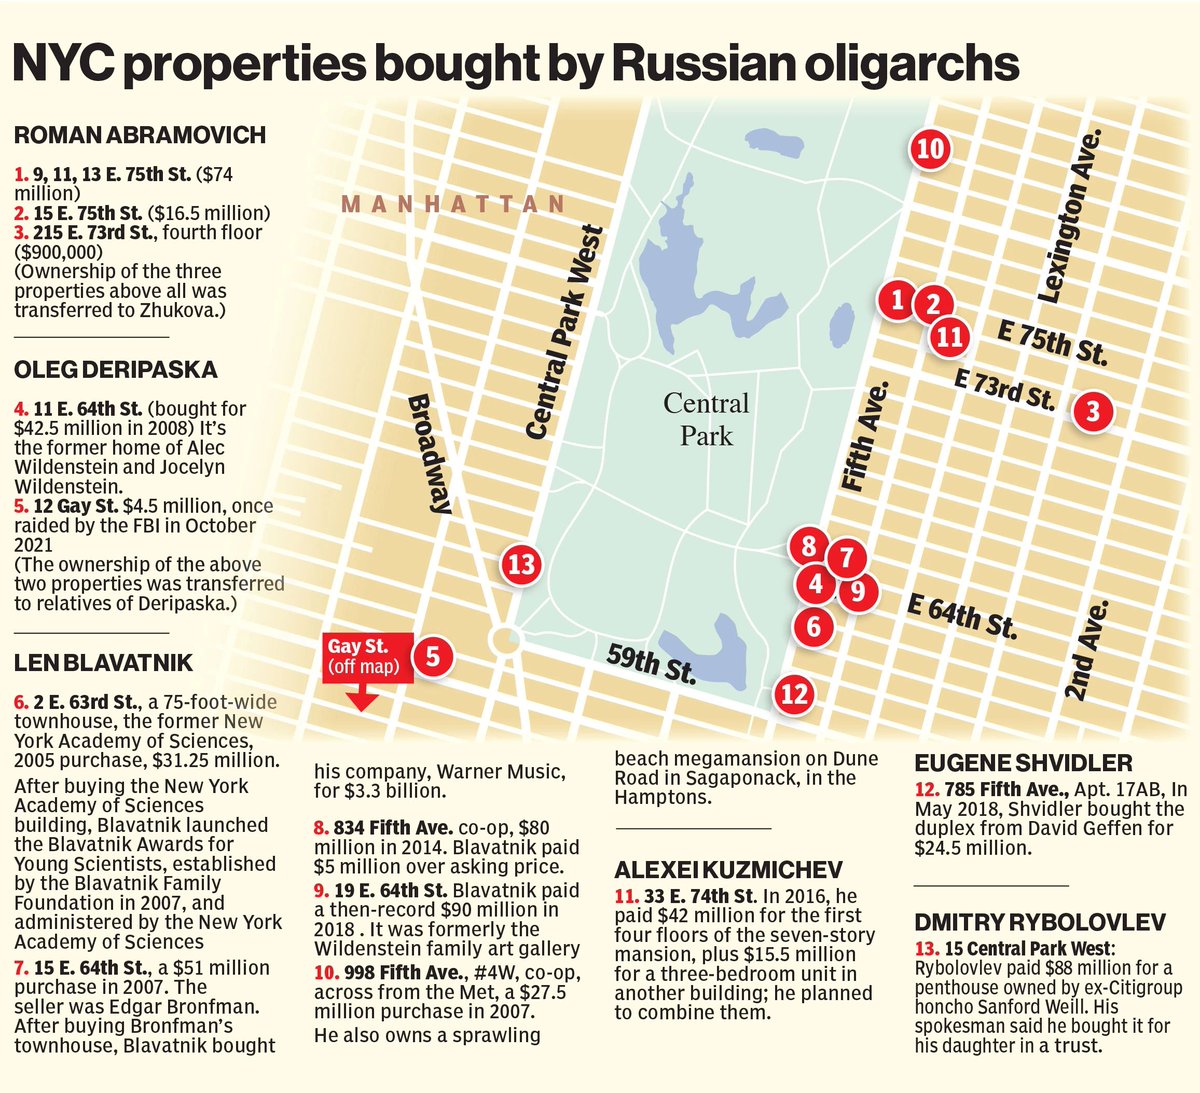
Putin's oligarchs are using Manhattan real estate as a safe haven for their assets.
Many are hiding in plain site. This needs to end. Time for these properties to be seized.
https://t.co/UKxI26j1UL
Friends, thank you for your support. You keep asking me what you can do to help. My old friends run a volunteer service delivering dairy products to military and children hospitals in Kyiv.
#StandWithUkraine️@UCFDowntown@CIHR_IRSC@MT_FB@VanderbiltU
https://t.co/Yaf50UaBEW
ROC curves provide a convenient way to compare responses and predictions of a binomial model.
The {performance_roc} function from {performance} 📦 computes AUC metric and visualizes ROC curves for a collection of models 🥇🥈🥉
https://t.co/ZKty2kA5Br
#rstats#DataScience
Correctly specifying a distribution family for regression model can improve estimate accuracy. But what if we’re unsure?
The {check_distribution} function from {performance} 📦 uses Random Forest to help you reconsider the choice ⚠️
https://t.co/qD7cQvNLLz
#rstats#DataScience
Our latest in Health Policy. Drawing on our @OBShealth Covid-19 #HSRM work, we compare Covid responses in CA, IE, UK, & US, touching on factors like governance, physical infrastructure, & workforce capacity. Honored to have worked w/ this superstar team!
https://t.co/xGQ1CQMJHH
After 15 years of using #Rstats, I finally got around to submitting a package to CRAN. https://t.co/Q46GmlPMam makes hypothesis testing using the bootstrap easier.
If you are fluent in {dplyr} and wish to learn how to write SQL queries, it can be nifty to have a function that can provide a syntax translation between the two.
The {show_query} function from {dbplyr} 📦 does just that! 🔄
https://t.co/GAjWk5qfVC
#rstats#DataScience
I’m gearing up to teach a course at CMU on visualizing data in R with ggplot (and a bit of R Markdown, too) & am compiling a list of extra resources. If you have a top-notch favorite blog post/tutorial/etc on any ggplot-related topic (or a fun public data set!), please share! 🙏🏻
The {ggplot2} syntax to carry out few common routines (e.g, changing legend position, axes, etc.) can be surprisingly hard to remember.
The {easy_} function family from {ggeasy} 📦 provides memorable shortcuts for such routines 🙌
https://t.co/vqFYzcvxKZ
#rstats#DataScience
Although a no. of 📦s help assess validity of regression model assumptions visually, only a handful cover time series analysis.
The {ggtsdiag} function from {ggfortify} 📦 provides a comprehensive diagnostic check for such models 📈
https://t.co/iJaZ6bD6e1
#rstats#DataScience