Gap Up, Gap Down, or In Range — What Happens Next? (12,390 Sessions Analyzed)
Every trading day begins with a single print on the tape — the RTH session open. That first price relative to the previous session’s range sets the tone for everything that follows. But how exactly does opening type — gap up, gap down, or in-range — influence intraday behavior?
We analyzed 12,390 trading days across four major futures contracts to answer these questions:
How often does each open type occur, and is the distribution stable?
Which previous-session levels are most likely to be touched based on opening type?
Does opening within vs outside the Value Area change the day’s character?
When price touches one Value Area boundary, how often does it reach the VPOC?
How does gap size affect the probability of revisiting the prior range?
The results reveal that opening type is not merely descriptive — it carries measurable statistical weight. In-range opens show 71-73% probability of touching the previous close, while a touch of the prior VAH or VAL leads to 81–84% probability of also reaching the VPOC.
Data and Methodology
This research covers minute-level RTH (09:30-16:00 ET) data for four CME futures contracts:
#NQ (Nasdaq-100) — 3,116 days
#ES (S&P 500) — 3,042 days
#YM (Dow Jones) — 3,116 days
#RTY (Russell 2000) — 3,116 days
The dataset spans from February 2014 through March 2026 — over 12 years of market history covering multiple regimes including low-volatility bull markets, COVID-era extremes, and the 2022-2023 rate hiking cycle.
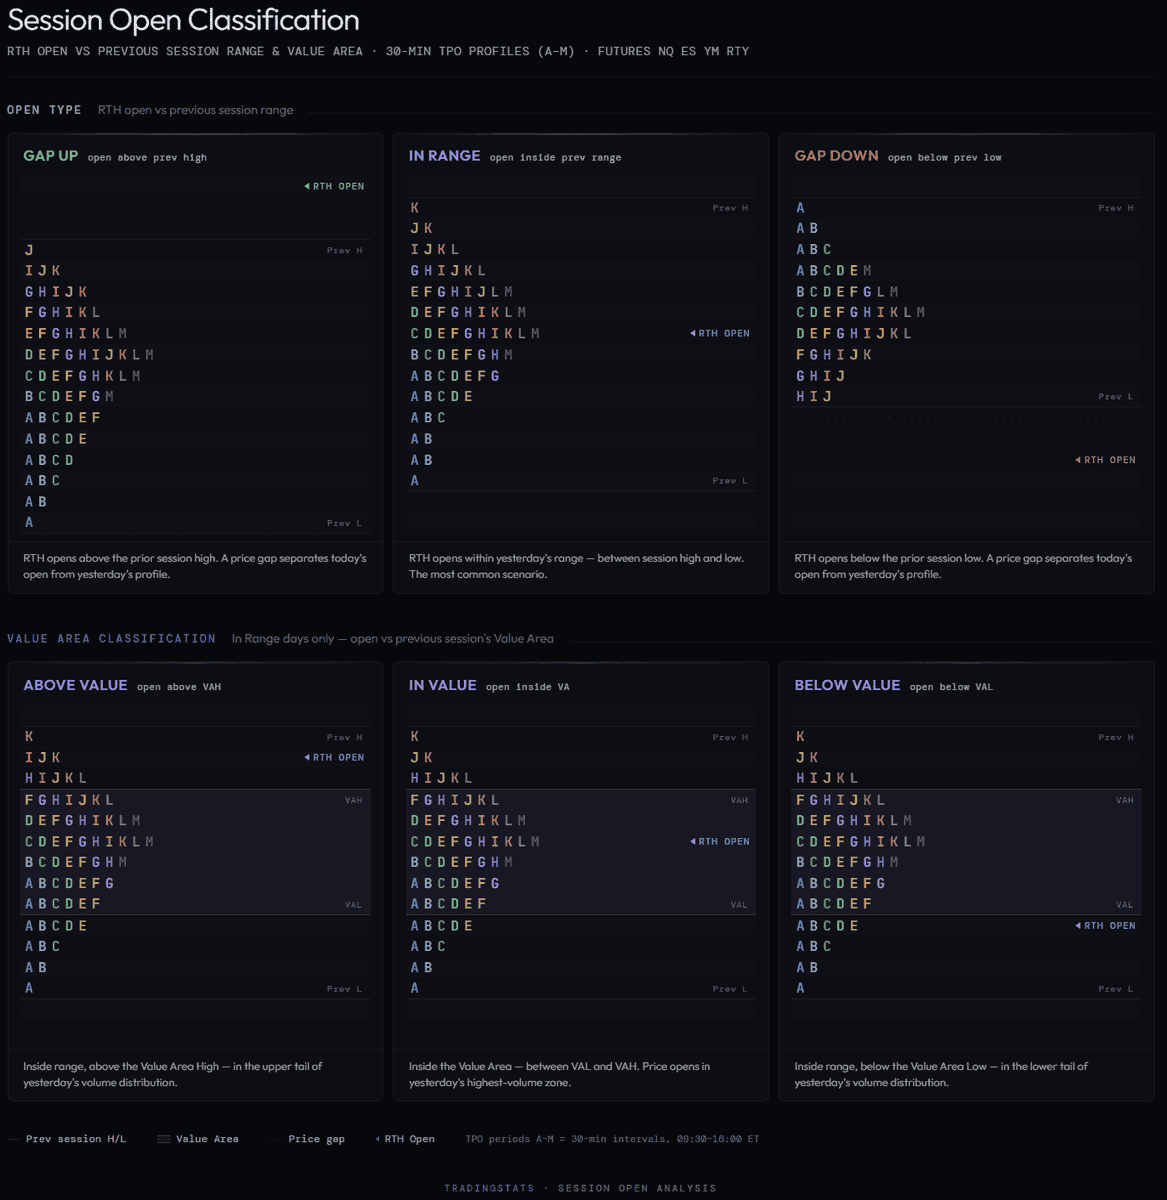
Classification Definitions
Open Type is determined by comparing the RTH open price to the previous session’s high and low:
Gap Up — RTH open above previous session high
Gap Down — RTH open below previous session low
In Range — RTH open between previous session low and high (inclusive)
Touch means the level fell within the current day’s RTH traded range (session low ≤ level ≤ session high). No specific sequence or timing is required — only that the level was traded through at some point during the session.
Value Area sub-classification applies only to In Range days and uses the previous session’s TPO-derived Value Area High (VAH), Value Area Low (VAL), and Volume Point of Control (VPOC).
Key takeaways
The Q-Chain framework’s structural edge is real, but smaller than the marginal suggests. Chain forms on ~89% of trade days. Marginal continuation is 77.6% bull / 73.2% bear on NQ. Selection lift over the null baseline is only +5–6pp.
The actual edge lives in cohort cells. Top conditioned cells (chain × Q1 size × Q2 mag × DOW) deliver +10 to +19pp lift over the null. Two to four times the lift of the chain marginal alone.
P12 SIDE is the filter that matters. Disagreement between chain direction and P12’s directional close erodes continuation rate by 14–21pp — strong anti-edge.
P12 REGIME doesn’t matter. Narrow / normal / wide P12 size adds only ±0–4pp of lift — informational, not actionable.
Distance to target is the strongest single signal. Measured at Q3 open, continuation runs 93–96% when the target is within 0.10× a typical Q1 range, falling to 52–55% when it sits a full range or more away — a ~41pp spread, wider than any cohort cell and almost perfectly monotonic.
Time decay is steep after 10:30 ET. Live probability drops sharply once the morning expands range; by 11:00 ET, only close-to-target buckets retain meaningful odds.
18:00 anchor is robust. Within ±2 hours of session-aligned alternatives the framework holds (~3–4pp). Calendar-midnight anchor collapses the edge entirely (−20 to −28pp), confirming the edge is market-structure-bound, not arbitrary.
Cross-instrument consistency holds. NQ, ES, YM, RTY all show +4.7 to +5.8pp selection lift. RTY carries the highest absolute continuation rates (80.5/76.5). The framework is not instrument-specific.
No real “bear Monday” anti-edge. Marginal bear-chain Monday continuation is 66.7% (216 days) — mildly the weakest bear weekday but normal. The dramatic 38.9% figure is a single deep sub-cell (18 days) and is statistical noise, not a tradeable signal.
The Q-Chain: Does the Overnight Q2 Drive Carry Into the Morning?
A 12-year study of the Q1 → Q2 → Q3 chain on #NQ_F and #ES_F. What lifts the marginal, what’s just baseline range expansion, and where the structural edge actually lives.
The Quarter framework
The 24-hour Globex session in equity index futures starts at 18:00 New York time and runs to the next 18:00. We split it into four 6-hour blocks measured from that anchor.
The blocks are not labeled by session for a reason — the time-block boundaries don’t align perfectly with cash-market open/close hours (Tokyo, London, NY cash each start at hours inside the blocks, not at the boundaries). For this study, the blocks are pure time windows: Q1 is the first 6 hours after the Globex open, Q2 the next 6, and so on.
The four quarters per trade day:
(Trade-day labeling is anchored at 18:00 ET, so Sunday-evening Globex correctly maps to the Monday trade day — verified against the raw bars. The DOW cells are not off by one.)
A note on small sub-cells. Slice bear × Monday further by Q1-size and��Q2-magnitude and you can find a deep cell printing ~38.9% on just 18 days. That number is real in the data but is essentially noise: the 95% confidence interval runs roughly 20–60%, so it spans everything from a strong reversal pattern to a coin flip. It is not a tradeable anti-edge, and it should not be read as “Monday bear chains fail.” The marginal (66.7% over 216 days) is the honest figure.
The takeaway: there is a mild Monday softness on the bear side (~5–7pp below the strongest days), consistent with weekend-positioning unwinds occasionally reversing early Q3 selling. But it is a small marginal effect, not the dramatic flip a single low-n sub-cell might suggest. Any DOW-specific trading rule needs a longer or cross-instrument-pooled sample before it earns conviction.