ThE fOur YeAr cyCle iS dEAd
https://t.co/GMiUq4kFWH
If you've enjoyed this Bitcoin Journey over the past 8 years, appreciate a Retweet and sharing on other forums. Thanks,.
Fantastic quarters from both $FIVN and $TEAM with accelerating revenue growth
Both are ramping share buybacks as well 🔥
But tell me again how AI is killing these doomed SaaS losers 😂
#Silver
Back in 2024, a very wealthy friend of mine and I took a close look at silver’s supply and demand fundamentals, focusing purely on the industrial side. Back then, when silver was trading around $25, we both concluded that supply was critically tight relative to growing demand. We decided to go long. One key driver was the surging need for solar power (each panel requires roughly 20 grams of silver).
My friend, however, was bearish on crude oil at the time (around $57–60). When silver surged above $90–$100 while crude remained near $60, he felt silver had become too expensive relative to solar panel economics and turned bearish.
I exited my leveraged silver positions between $92 and $101 (as documented in my feed), not because I turned bearish, but because volatility had spiked dramatically (to $111). In my view, $100+ silver was never “too expensive” relative to solar panel pricing. Moreover, I remain strongly bullish on both gold and silver from a monetary perspective.
Fast forward to today: crude oil is flirting with $100, while silver is trading below $70.
From a pure industrial supply/demand standpoint, ask yourself this: with crude exploding higher, isn’t it logical that demand for solar energy will accelerate significantly? If that happens, higher oil prices should also allow solar panel prices to rise comfortably, giving silver substantial room to move higher.
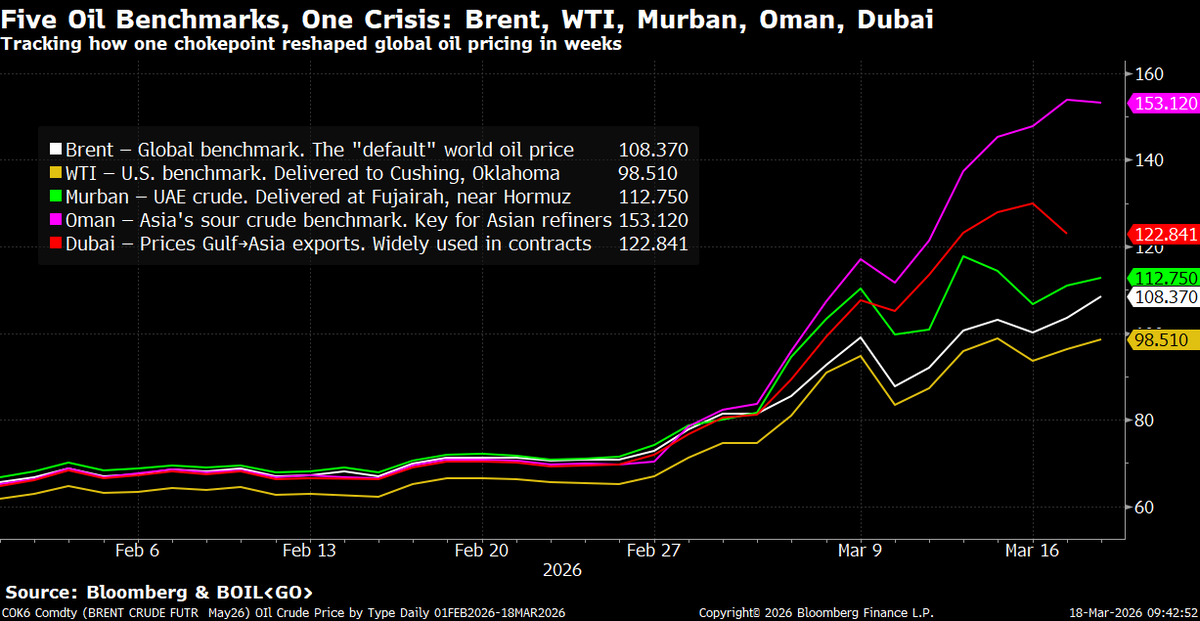
🛢️There's a lot being said about oil prices right now, so I put this chart together to help explain the major crude benchmarks and why they're all behaving differently.
⚪Brent (white) — The world's "default" oil price. Most global trade is priced off this. When the news says "oil is at $108," they mean Brent.
🟡WTI (yellow) — The U.S. benchmark, based on crude delivered to Oklahoma. It's the lowest line on the chart because American oil doesn't need to transit the Strait of Hormuz.
🟢Murban (green) — Crude from Abu Dhabi, delivered at Fujairah port, which sits just outside the Strait. Even though it technically doesn't have to pass through the chokepoint, drone strikes have hit Fujairah and nearby ports, pushing insurance and shipping costs up.
🟣Oman (purple) — The key benchmark for heavier crude sold into Asia. Many refineries in China, Japan, and South Korea are built specifically to process this grade. It's the highest line on the chart because Asian buyers are competing fiercely for a shrinking pool of cargoes.
🔴Dubai (red) — Used to price most long-term Gulf→Asia export contracts. It tracks alongside Oman as a measure of how hard Asian markets are being squeezed.
The story isn't any single price — it's the gap between them. In late February these five lines were within $6 of each other. Now the spread between WTI and Oman is over $50.
Since the U.S.-Israeli strikes on Iran began Feb 28, the Strait of Hormuz has effectively been closed. Daily transits have fallen from a historical average of ~138 ships to fewer than 5. The IEA has called it the largest disruption to global energy supply in history. Iran's IRGC has warned that not "a litre of oil" will pass for U.S. allies, while selectively allowing some Iranian, Indian, and Pakistani tankers through.
Saudi Arabia is rerouting oil to its Red Sea port at Yanbu, and the UAE is using a pipeline to Fujairah — but combined pipeline capacity is only 3.5–5.5 million barrels/day vs the 20 million that normally flows through the Strait. Meanwhile, the 400 million barrel emergency reserve release by IEA members covers roughly 4 days of global consumption.
Japan's refiners get ~95% of their crude from the Gulf. China receives 45% of its oil via Hormuz. South Korea, India, Thailand, Pakistan, and Bangladesh are all severely exposed. The wider the spread between the Asian benchmarks and Western ones on this chart, the more you're seeing that pain in real time.
AI panic. Bitcoin crash. Bubble warnings everywhere.
I break down the fear, the facts, and why all decisions are bets on the future, especially now with emotion driving assets.
New video just dropped.👇
https://t.co/zznErCz1kl
AI may be the biggest concentration risk in investor portfolios EVER
When does the bubble burst? And what stocks will emerge the ultimate winners?
https://t.co/UGuGEvXbb5
Some fund is blowing out of $FIVN today, I'm a buyer here under $19
It's the cheapest SaaS stock I track, trading at ~12X FCF
Worries about AI are overblown imho. There's a ton of legacy call center & CCaaS share to take as $FIVN enhances their own products with AI
The K-Shaped Economy Crisis (KEC) Will Persist Unless There Is Structural Regime Change at the Fed
Watch this much-needed public service announcement from our November 1, 2025, Around the Horn if you want to better understand the advanced monetary dynamics contributing to the U.S.’s K-Shaped Economy Crisis (KEC).
It’s not too late to remedy the Fed’s failed, backward-looking monetary policy framework.
But reform must occur soon, and it will only come if the econ PhDs currently defending the institution’s legacy of policy failure demonstrate far more humility than they have recently.
Thank you for watching. God bless America!💜
If you are wondering what the heck all this means, I wrote all about it two weeks ago and then deeper in this Sunday's Informationist.
You can find the first article (free) here:
https://t.co/2LRZIABjJG
In case you missed it, my interview with @crossbordercap gives you all the insights into global liquidity and how its going to drive crypto, gold and bonds in the coming months
https://t.co/eWbwGBA0sL