longest ES IB double-break streak: 15 consecutive sessions.
when the market gets volatile, it stays volatile. don't assume the next day will "calm down" because you want it to. clusters happen. adjust your size, your strategy, or sit out.
with a 45.7% trap rate you're guaranteed 5-loss streaks. risk 0.5-1% per trade. this is what keeps you alive.
ES double-break rate: ORB: 45.7%. IB: 22.0%.
wider ranges produce more directional breaks.
a breakout on thin volume isn't a breakout. it's a trap. 5-minute trades are noise. 60 minutes of structure is signal.
127 days of ES data. not theory. not what you want to see.
aggregated Q4 2025 13F filings from the top 50 institutional managers. combined AUM: $3.9 trillion.
not who said what on CNBC. not analyst price targets. this is what they actually did with their capital. nothing else matters.
strongest institutional conviction buys:
GOOGL: $9.3B net inflow. 25 buyers, 2 sellers.
AMD: $3.2B. 24 buyers, 2 sellers.
MU: $3.0B. 26 buyers, 0 sellers.
LLY: $4.2B. 24 buyers, 2 sellers.
micron: 26 buyers, zero sellers. every single filer was accumulating. that's unanimity.
strongest institutional selling:
MSFT: $4.4B outflow. 5 buyers, 21 sellers.
NFLX: $2.8B outflow. 2 buyers, 23 sellers.
ORCL: $3.6B outflow. 4 buyers, 23 sellers.
META: $4.2B outflow. 9 buyers, 18 sellers.
netflix: 23 sellers, 2 buyers. that's not a trim. that's an exit. big money is done.
the key insight: institutions didn't sell "tech."
they rotated within tech.
selling: MSFT, META, NFLX, ORCL — mature, fully valued.
buying: GOOGL, AMD, MU, AVGO — AI infrastructure, perceived undervalued.
sector-level analysis misses this. stock-level flow reveals it. you're reading headlines about the winners. you're not seeing the exit
tesla: 18 buyers, 9 sellers. net flow: -$5.8 billion negative.
more filers bought than sold. yet the net was deeply negative.
this means: large holders exiting in size while smaller positions initiated.
big money is handing shares to new participants. retail reads that as bullish. it's distribution.
https://t.co/QI5nOaq3Hh
the Initial Balance is where institutions build their opening positions. 127 days of ES IB data.
double-break rate: only 22%. half the ORB's 45.7%.
wider range means cleaner signal. but the real edge isn't the range. it's the weekday variation. here's what the calendar actually pays.
monday: 50% breakout, 17% double break. institutions deploy capital on monday. half of all sessions broke above the IB and held.
tuesday: 43% double break. highest whipsaw rate of any weekday. tuesday's IB behaves like an ORB—both sides get tested. reduce size or skip it entirely.
wednesday: 50% breakdown, 10% double break. the most bearish AND most decisive IB day. half of all wednesdays broke below—and the 10% double-break rate means it was clean. one-directional selling.
thursday: 54% breakdown. the bearish mid-week continues. wednesday + thursday combined: 52% breakdowns.
professional IB targets use the range as the measuring stick:
1x extension: scale out 1/3, move stop to breakeven
1.5x extension: scale out another 1/3
2x extension: trail the remainder
the IB break at 12:15 that looked real. reversed by 1:00. noon-1:30 is the highest false breakout window. don't chase it.
the IB tells you what kind of day is developing:
narrow IB + directional break = trend day. hold and trail. wide IB + failed break = rotational day. fade the extremes. double break = two-sided auction. reduce size.
QUANTIS computes IB stats daily across every security. zones not levels.
https://t.co/QI5nOaqBwP
you entered the first ORB break at 9:35. stopped out by 9:38. watched it go back your direction by 10:00.
45.7% of the last 127 ES sessions did exactly that.
the first break was a trap nearly half the time. here's what professional traders actually do with that information.
the ORB isn't a buy-the-breakout signal. it's a liquidity map.
buy stops sit above the high. sell stops sit below the low. the first break sweeps one side's stops. the reversal sweeps the other.
the amateur trades the first break. the professional trades what happens after both sides get hit.
but not every tuesday is the same trap. weekday determines your probability:
monday: 40% clean breakout, 20% breakdown — bullish lean.
tuesday: 60% double break. 6 out of 10 tuesdays will stop you out. some traders just skip tuesdays. the data says that's rational.
thursday: 39% breakdown, 14% breakout — bearish lean.
same strategy. opposite edges by day.
here's where price actually closes when the ORB breaks:
41.7% close above the ORB range 37.8% close below the ORB range 20.5% close back inside
once confirmed, the break has follow-through. the key word is confirmed. you took profit at 1x because you were scared of giving it back. it ran to 2.5x without you.
professional ORB execution:
mark the range high and low
wait for the first break — don't enter it
watch for retracement of the ORB
enter on the retest with a stop at the range midpoint
target: 1x range height from the breakout
trail the rest if it extends beyond 1x
this filters the 45.7% of sessions that trap first-break traders. trade what is, not what you want to see.
if you want more setups like these: https://t.co/QI5nOaq3Hh
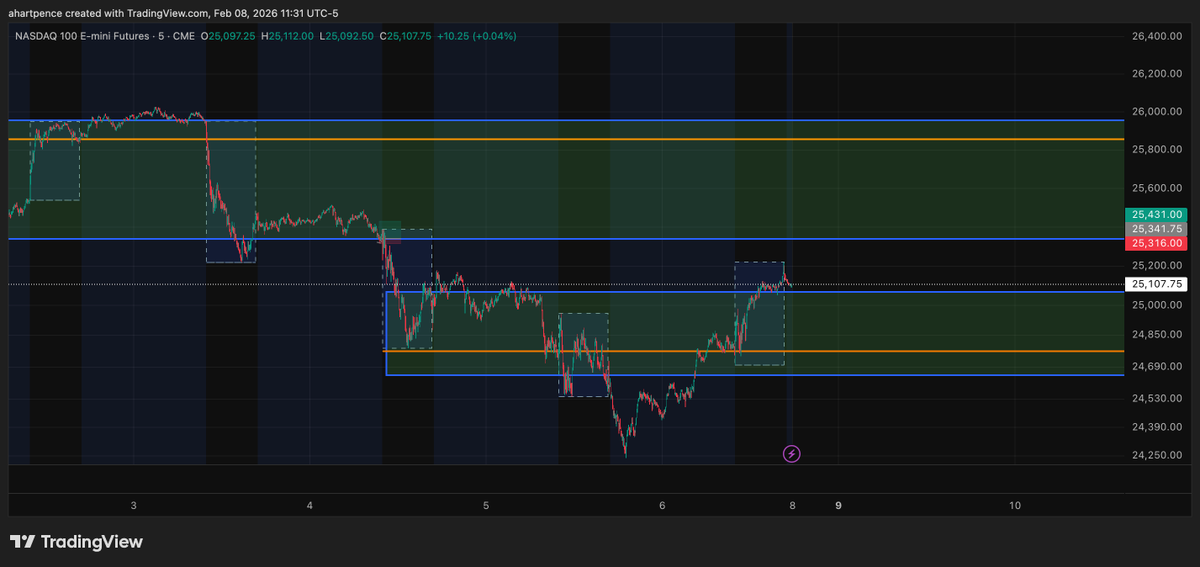
24 hours ago, we were pretty sure today's orb would be directional—and sure enough, it was. Today's trading couldn't have been easier. We just waited for the ORB to pick a direction, then retraced back in so we could enter, and went long.
Hope everyone else caught that one too.
Price on $NQ closed on friday right between two composite value areas.
Auction market theory tells us that once we accept back into a CVA we want to cross it (being mindful around the point of control)
That combined with the last 12 weeks proving that the Opening Range Breakout likes to be directional (breakout or breakdown) on mondays, are together my hypo that we accept into a CVA then cross it. Will need to wait for the opening range to form tomorrow to see where we're going.
Remember: zones not levels, wait for acceptance/retracement, and trade what is. Best of luck tomorrow.
#DayTrading #Futures #Nasdaq
I'd like to see a gap down day and an inside day form as well (yesterday's close was above today's open, and we opened inside yesterday's range), since we know Mondays often fill a gap down (bearish) and price wants to break out of yesterday's range (directional). But remember: trade what is, not what you want to see.
While version 0.3.1 is in review, I was playing with the idea of building the next version of QUANTIS: adding news articles directly on the strategy screen and updating you with news for the security you're currently trading
We’re still hard at work building the next iteration of QUANTIS but I wanted to share another feature of our upcoming update: QUANTIS will be available on iPhone.
Starting with version 0.3 (in review now) traders can access all of QUANTIS on their iPhone as well as their iPad.
Here’s what’s coming next in QUANTIS:
A trading journal. You’ll be able to import your trades from TradingView, visualize your PnL on a chart or calendar, create a trade idea and easily convert it to a trade. QUANTIS will also suggest trade ideas for you
@the_tradershop Took about 30 seconds to get set up, entered, then walked away.
ES this morning.
Grinding all session just keeps you emotionally involved. That does not work long term.
You have to trade with data, not your ego. check out QUANTIS https://t.co/tq8SCXoYbA
QUANTIS was showing that $ES had a 75% chance of reaching the 6954 level today. Today actually hit 6960
If you want to trade the gap fill and more strategies like it using data and machine learning, come sign up for a tree trial today (iPad Required): https://t.co/GAkACyPVbT
QUANTIS was showing that $ES had a 75% chance of reaching the 6954 level today. Today actually hit 6960
If you want to trade the gap fill and more strategies like it using data and machine learning, come sign up for a tree trial today (iPad Required): https://t.co/GAkACyPVbT