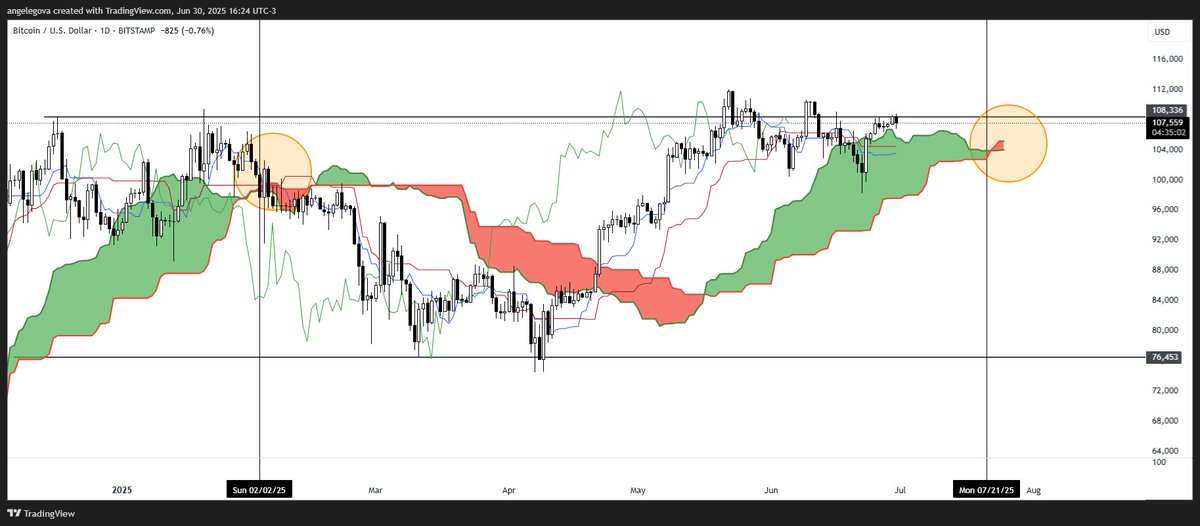
For 10+ years people have repeated the same lie about Ichimoku: “9, 26, 52 were just old trading days.”
No! Hosoda wasn’t building a crossover indicator.
He was building a time–space equilibrium model.
I’m unveiling the truth. This marks the start of a nice series I am going to produce for YouTube, hopefully we can all learn together the market is young, and there are MANY opportunities around the corner.
Time to level up! If you care about precision over noise, watch & share. If you want to help the community please RT so we can reach as many people as possible at least to understand the foundation of the system.
👉 https://t.co/FGWwzxuorA
@CryptoSays Piensas hacer algún video hablando acerca de estos análisis como los videos que hacías antes en YouTube? Personalmente me gustaría saber más acerca de esto, es interesante 🙏🏻
@CryptoSays Estuve investigando más acerca de esto porque lo habias mencionado en un video hace un par de años, esto generalmente atrae un poco de volatilidad al mercado no?
@CryptoSays Es increíble como a veces las cosas más simples son las más complejas de entender, la paciencia y el conocimiento correcto son la clave para generar riqueza en este mercado, gracias por el gráfico Boss 🚀
@DoctorCatX In the 1D TF, we are 3 days away from the kijun sen pointing downwards, in theory that would break the balance it is in now and would give way to testing the 4.11% support
@DoctorCatX What exactly are you looking for in the candles to be able to start counting a cycle of time? I mean, what did you see in those points to identify the cycles of 25/26? Thank you for your answer