You have learned Excel, SQL, Power BI: congratulations.
Practice here for free:
EXCEL: https://t.co/Fy8XuxqvkL
SQL: https://t.co/Zb4bqPqecU
Power BI: https://t.co/sDvIW6ls3z
Keep learning.
I have over 400+ videos on Data Analytics - that's too many for one person to watch.
Here are the top 5 that I would watch:
1. How to Become a Data Analyst - https://t.co/Jc5LoNCUaj
2. Complete FREE Data Analyst Bootcamp - https://t.co/2SjI9iVxr5
3. Learn Power BI in Under 3 Hours - https://t.co/CqE1ZqKUdC
4. Top 5 Reasons NOT to Become a Data Analyst - https://t.co/AYutUC6HkH
5. Learn SQL in 4 Hours - https://t.co/MTnjvTF7zw
Some of these videos are ones I made over 5 years ago, but they still hold true today.
🚨 MRBEAST JUST DROPPED THE EXACT BLUEPRINT TO HIT MILLIONS OF SUBS IN 6 MONTHS
No fluff. Straight fire:
>> Your first 100 videos are gonna suck… upload them anyway!
>> Every time you think “algorithm,” replace it with “audience”
>> Titles under 50 characters — make them as wild and extreme as possible
>> The first 5 seconds matter more than your thumbnail
>> Drop 1 absolute banger a month instead of 4 average videos a week
Save this. Bookmark it.
When you’ve got 18 minutes, watch the full thing like your future depends on it… because it does.
Then go make real money 👇
UPDATE: Acting Senate President Sherwin Gatchalian says he will preside over the impeachment trial of Vice President Sara Duterte. #VPSaraOnTrial | via @RG_Cruz12479
claude opus 4.8 is here and anthropic's finance lecture suddenly matters a lot more
1 free hour
claude for finance
quant workflows
research
models
market data
analysis
not a $500 course
the team building claude shows how to use it where mistakes actually cost money
most people use ai to summarize tweets
this shows how it starts fitting into real finance work
watch it today
bookmark it before it disappears in your feed
Anthropic just showed a 24-minute workshop on how to actually prompt Claude.
Taught by the people who built it.
Free. No signup. No paywall.
I've watched $300 courses that don't cover what they teach in the first 8 minutes.
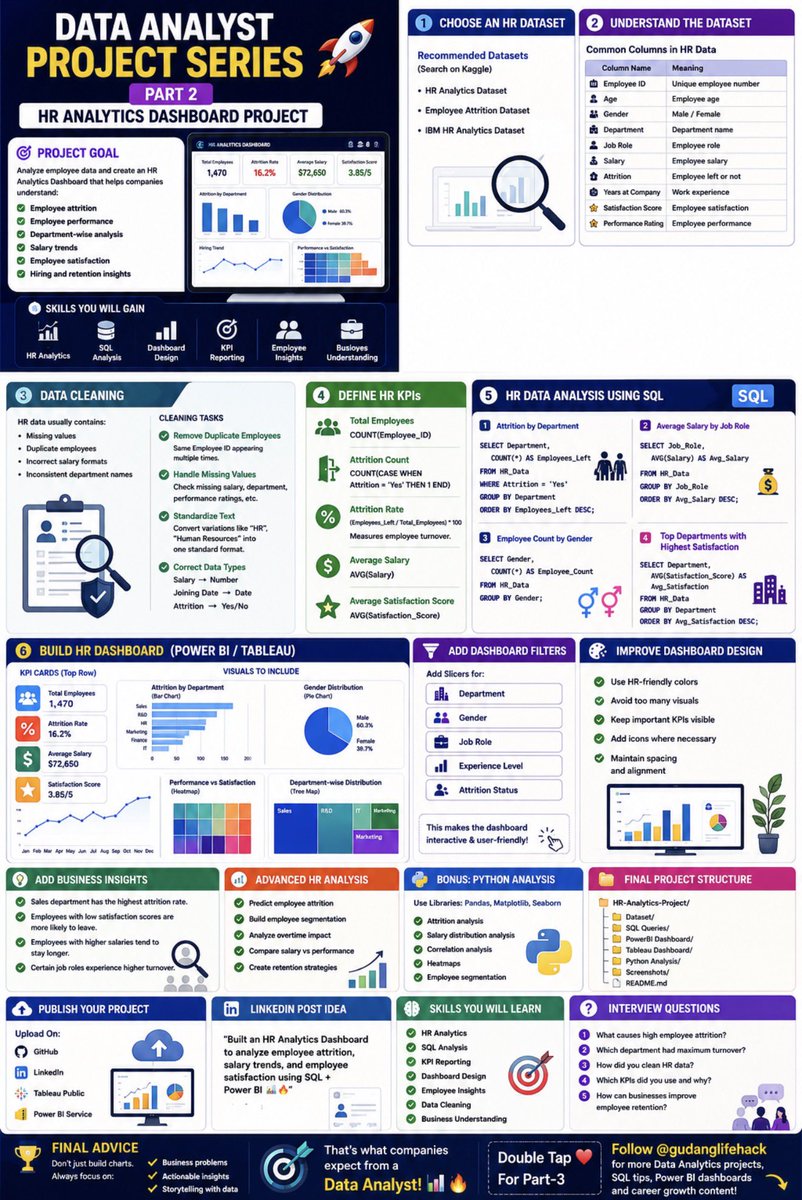
🚀 Data Analyst Project Series – Part 2
HR Analytics Dashboard Project
🎯 Project Goal
The goal of this project is to analyze employee data and create an HR Analytics Dashboard that helps companies understand:
- Employee attrition
- Employee performance
- Department-wise analysis
- Salary trends
- Employee satisfaction
- Hiring and retention insights
This is one of the most popular real-world Data Analyst projects because every company tracks employee performance and retention.
🛠 STEP 1: Choose an HR Dataset
*Recommended Datasets*
Search on Kaggle:
- HR Analytics Dataset
- Employee Attrition Dataset
- IBM HR Analytics Dataset
📂 STEP 2: Understand the Dataset
Common Columns in HR Data
Column Name: Employee ID
Meaning: Unique employee number
Column Name: Age
Meaning: Employee age
Column Name: Gender
Meaning: Male/Female
Column Name: Department
Meaning: Department name
Column Name: Job Role
Meaning: Employee role
Column Name: Salary
Meaning: Employee salary
Column Name: Attrition
Meaning: Employee left or not
Column Name: Years at Company
Meaning: Work experience
Column Name: Satisfaction Score
Meaning: Employee satisfaction
Column Name: Performance Rating
Meaning: Employee performance
🧹 STEP 3: Data Cleaning
HR data usually contains:
- Missing values
- Duplicate employees
- Incorrect salary formats
- Inconsistent department names
✔ Cleaning Tasks
Remove Duplicate Employees
Example:
Same Employee ID appearing multiple times.
Handle Missing Values
Check:
- Missing salary
- Missing department
- Empty performance ratings
Standardize Text
Example:
- “Human Resources”
- “HR”
- “human resources”
Convert all into one standard format.
*Correct Data Types*
Examples:
- Salary → Number
- Joining Date → Date
- Attrition → Yes/No
📊 STEP 4: Define HR KPIs
KPIs are very important in HR Analytics.
Essential KPIs
✔ Total Employees
COUNT(Employee_ID)
✔ Attrition Count
COUNT(CASE WHEN Attrition = 'Yes' THEN 1 END)
✔ Attrition Rate
(Employees_Left / Total_Employees) * 100
Purpose:
Measures employee turnover.
✔ Average Salary
AVG(Salary)
✔ Average Satisfaction Score
AVG(Satisfaction_Score)
🗄 STEP 5: HR Data Analysis Using SQL
Now start analyzing the HR data.
📌 SQL Query Examples
1. Attrition by Department
SELECT Department,
COUNT(*) AS Employees_Left
FROM HR_Data
WHERE Attrition = 'Yes'
GROUP BY Department
ORDER BY Employees_Left DESC;
2. Average Salary by Job Role
SELECT Job_Role,
AVG(Salary) AS Avg_Salary
FROM HR_Data
GROUP BY Job_Role
ORDER BY Avg_Salary DESC;
3. Employee Count by Gender
SELECT Gender,
COUNT(*) AS Employee_Count
FROM HR_Data
GROUP BY Gender;
(Save this for later).
How to make Excel in Claude Cowork in just 7 mins:
(even if you signed up for Claude yesterday)
1. Download Claude at claude .com/download.
2. Get a Pro account ($20/month). Worth it.
3. Open the app → click the "Cowork" tab.
4. Select a folder from your computer.
5. Pick "Opus 4.7" + "Adaptive thinking."
6. Click '+' → Connectors → connect Google Drive.
7. Paste this prompt template:
(from this guide: https://t.co/ZgmUFXdyy4)
"Create an Excel spreadsheet from: [DATA].
Purpose: [who uses it, what decision it supports - 1 sentence].
Sheets needed: [name + columns + formulas for each].
Formatting: [currency, dates, frozen rows, totals].
Before building, list your top 10 assumptions so I can sanity-check them, then execute."
8. The magic is in the last line.
✦ Cowork stops and shows its logic.
✦ Correct anything off, or say "build it now."
✦ You control the AI, not the other way around.
9. Let Cowork build for ~7 minutes.
✦ Watch tabs, formulas, dashboards populate.
✦ Don't touch anything until it finishes.
✦ Result: 6 tabs, 700+ working formulas, 1 prompt.
10. Click "Google Drive" inside Cowork.
✦ The file opens instantly in Google Sheets.
✦ All tabs, formulas, formatting carry over.
✦ Easier to use & share than Excel.
11. Stay inside Cowork for any big change:
✦ "Make the Bull scenario more optimistic."
✦ "Add a Dashboard tab with KPI tiles."
✦ "Add conditional formatting on margin %."
What Cowork still can't do (yet):
✗ No macros or VBA.
✗ No live database connections.
✗ Not for final client deliverables without review.
Pro tip: the prompt is 80% of the result.
Always force the "10 assumptions" check first.
Now you know what to do first.
7 mins setup to build what used to cost $5,000.
Full breakdown (for free): https://t.co/ZgmUFXdyy4
Stop sleeping on AI
Obsidian + Claude Code = your own JARVIS.
Takes 1 hour to build.
Most people will scroll past this and stay unproductive.
The ones who stop and build it will never work the same way again.
Instead of watching a tutorial video and forgetting 80% of it after just two days…
NotebookLM turns it into a personalized learning system built around you.
All you need is a YouTube link and the right prompt.
Here are 5 powerful prompts I’ve personally used — and the results are seriously impressive. Save them for later 👇





![rubenhassid's tweet photo. How to make Excel in Claude Cowork in just 7 mins:
(even if you signed up for Claude yesterday)
1. Download Claude at claude .com/download.
2. Get a Pro account ($20/month). Worth it.
3. Open the app → click the "Cowork" tab.
4. Select a folder from your computer.
5. Pick "Opus 4.7" + "Adaptive thinking."
6. Click '+' → Connectors → connect Google Drive.
7. Paste this prompt template:
(from this guide: https://t.co/ZgmUFXdyy4)
"Create an Excel spreadsheet from: [DATA].
Purpose: [who uses it, what decision it supports - 1 sentence].
Sheets needed: [name + columns + formulas for each].
Formatting: [currency, dates, frozen rows, totals].
Before building, list your top 10 assumptions so I can sanity-check them, then execute."
8. The magic is in the last line.
✦ Cowork stops and shows its logic.
✦ Correct anything off, or say "build it now."
✦ You control the AI, not the other way around.
9. Let Cowork build for ~7 minutes.
✦ Watch tabs, formulas, dashboards populate.
✦ Don't touch anything until it finishes.
✦ Result: 6 tabs, 700+ working formulas, 1 prompt.
10. Click "Google Drive" inside Cowork.
✦ The file opens instantly in Google Sheets.
✦ All tabs, formulas, formatting carry over.
✦ Easier to use & share than Excel.
11. Stay inside Cowork for any big change:
✦ "Make the Bull scenario more optimistic."
✦ "Add a Dashboard tab with KPI tiles."
✦ "Add conditional formatting on margin %."
What Cowork still can't do (yet):
✗ No macros or VBA.
✗ No live database connections.
✗ Not for final client deliverables without review.
Pro tip: the prompt is 80% of the result.
Always force the "10 assumptions" check first.
Now you know what to do first.
7 mins setup to build what used to cost $5,000.
Full breakdown (for free): https://t.co/ZgmUFXdyy4](https://pbs.twimg.com/media/HJPdgFKbEAEBgLc.png)


