Data Scientist 📊 | Running the numbers on Web3 I Decode crypto cycles with data — not vibes. NFT collector 🖼️ | Web3 builder | not financial advice DYOR
When Bitcoin gets unusually quiet, most people think it's boring.
I ran 6.7 years of Binance data. Turns out these are the moments when volatility bounces back 80% of the time within 5 days.
Baseline: 49%.
The signal, the caveats, and one measurement I disagree with myself on:
$BTC
the tug of war underneath: etfs have bought for 8 straight days, $2.95B in the last 30.
price still can't hold $85k. someone with a lot of coin is selling right into that demand.
pce tonight breaks the tie.
$BTC
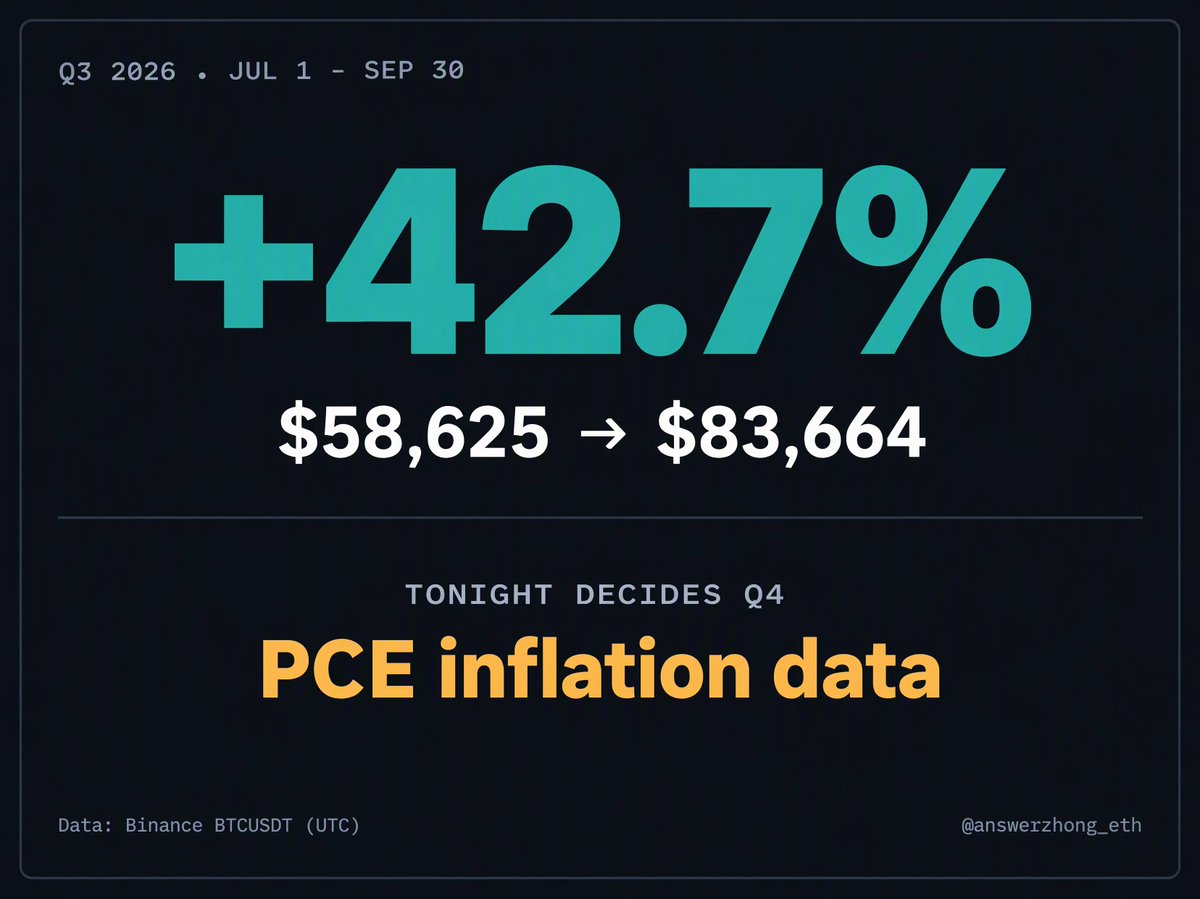
quarter ends today. up 42.7% since july 1, $58,625 to $83,664.
best q3 in years. nobody's celebrating though, tonight's pce print could set the tone for q4 before the confetti even settles.
$BTC
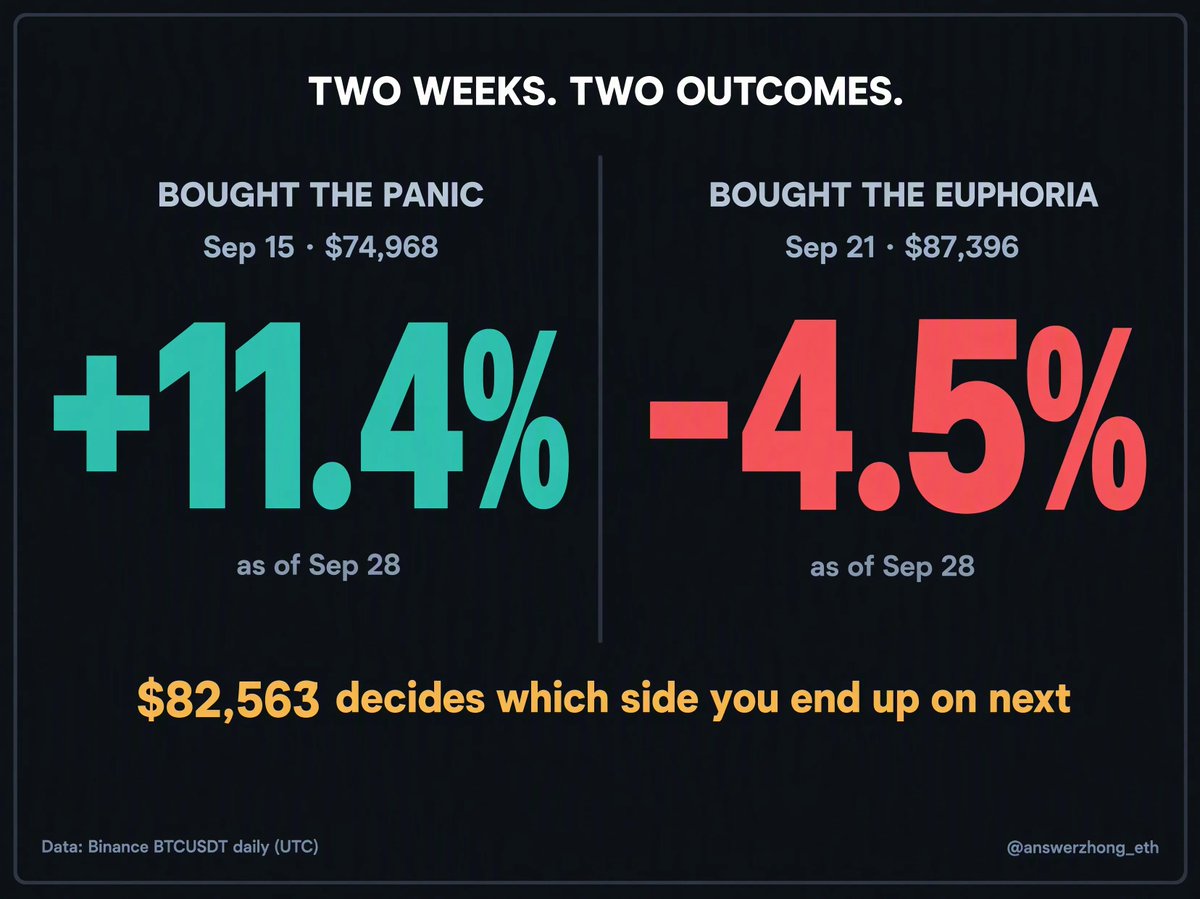
two weeks. two totally different people right now.
bought the panic at $75k on sep 15? you're up 11%.
bought the euphoria at $87k on sep 21? you're down 4.5%.
same coin, same two weeks. that gap is the whole game right now.
$82,563 decides which side you end up on next.
$BTC
pce data drops sep 30, same day as quarter close. btc's up ~43% this quarter, biggest single input into how funds rebalance books.
hot pce plus a weak quarter close could shake this range loose either direction.
$BTC
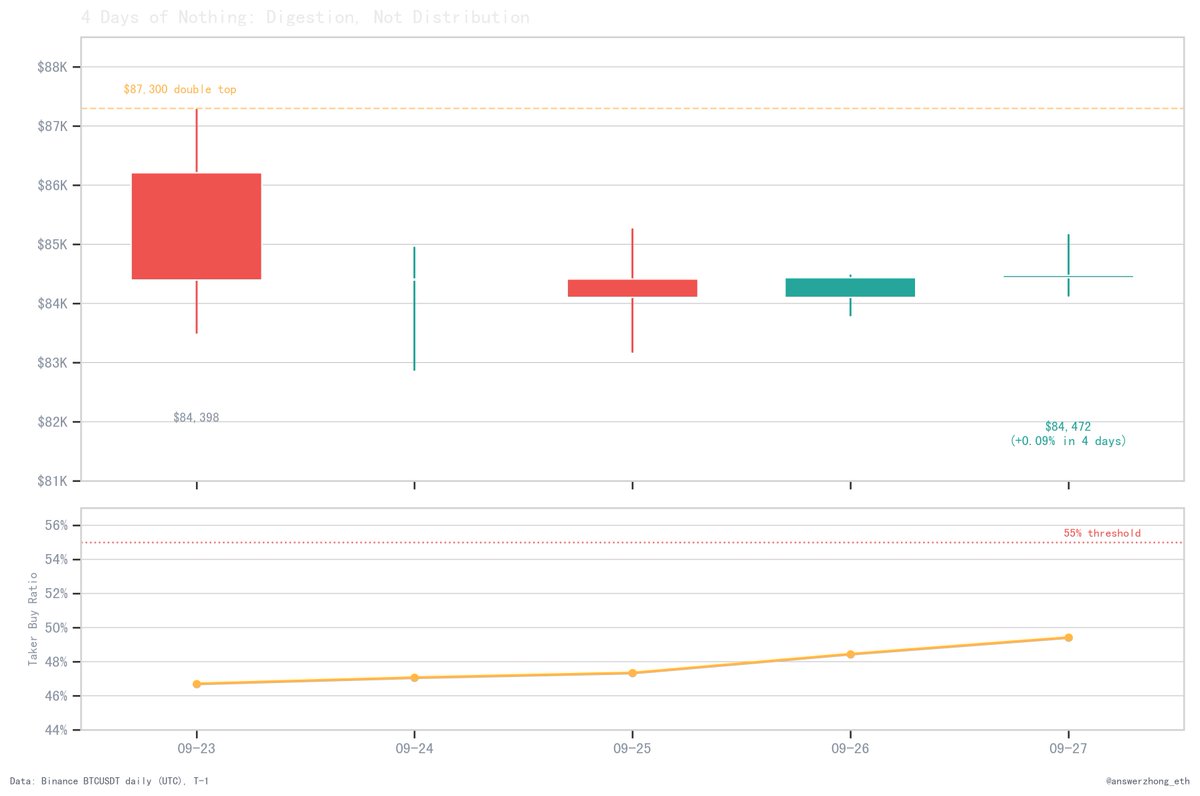
4 days since the double rejection at $87,300. price hasn't moved, $84,398 to $84,472.
buy ratio's been stuck under 55% the whole stretch, 46.7% to 49.4%. no breakout demand showing up yet.
this is what digestion looks like, not distribution.
$BTC
xi arrived in dc wednesday for a 3-day state visit through sep 25. the main sit-down and dinner fall in this window.
last time they met in may, btc dropped 5% the following week. de-escalation got priced in before, not after.
$BTC
called it yesterday, wanted buy ratio clearing 55% before trusting this rally. sep 23 came in at 46.7%. still no.
price rejected $87,279, almost the same spot as sep 21's $87,396 high. two rejections at the same level now.
$BTC
sep 22's pullback hit a 44.5% buy ratio, second lowest all month. that's actual selling, not quiet consolidation.
want to see buy ratio clear 55% before calling this demand-led instead of short-covering.
$BTC
pulled the taker buy ratio for sep 21, the +6.7% day. only 51.7%, barely above the month's 49.6% average.
that's not what aggressive buying looks like. a real squeeze day usually prints 55%+.
this move was more forced than chased.
$BTC
sep 21 close $86,620, only 0.89% off the $87,396 high. barely any pullback after a 6.7% day.
that's a strong tape, most days like that fade harder into the close.
$81,500 was resistance all weekend, now the level to hold. lose it on a close and this rally needs a rethink.
$BTC
so is this real demand or just a leverage flip?
etf inflows did return, $433M on sep 18 alone. that's the part keeping me from calling this purely a squeeze.
but funding at 60% annualized is hot. if that cools fast while price stalls, that's the tell to watch.
$BTC
been off a few days, sick. here's what i missed.
sep 15 low $74,968. sep 21 high $87,396, 8-month high. 16.6% in 6 days.
$750M liquidated in 24h, 87% shorts. funding went 9% to 60% annualized in 3 days.
oi rose 7.6% though. leverage didn't leave. it flipped sides.
$BTC
fomc dropped at 18:00 utc. this hourly candle says more than any headline.
open $75,770, dumped to $75,065 in minutes, then ripped to $76,561. closed $75,632.
$235M traded that hour, 5x the hour before. someone got run over on both sides.
$BTC
told you $77k was the line. it's gone.
75,644 close, right on the 50% fib. dipped to 74,968 intraday and crawled back.
still leaning long here. hold 75.6k through fomc and the bull case is alive. lose it on a daily close and 74k is next.
2pm et. this week just doesn't let up.
$BTC
update on yesterday's two calls.
the 38.2% fib at $77,182 held — close was $78,189. that played out.
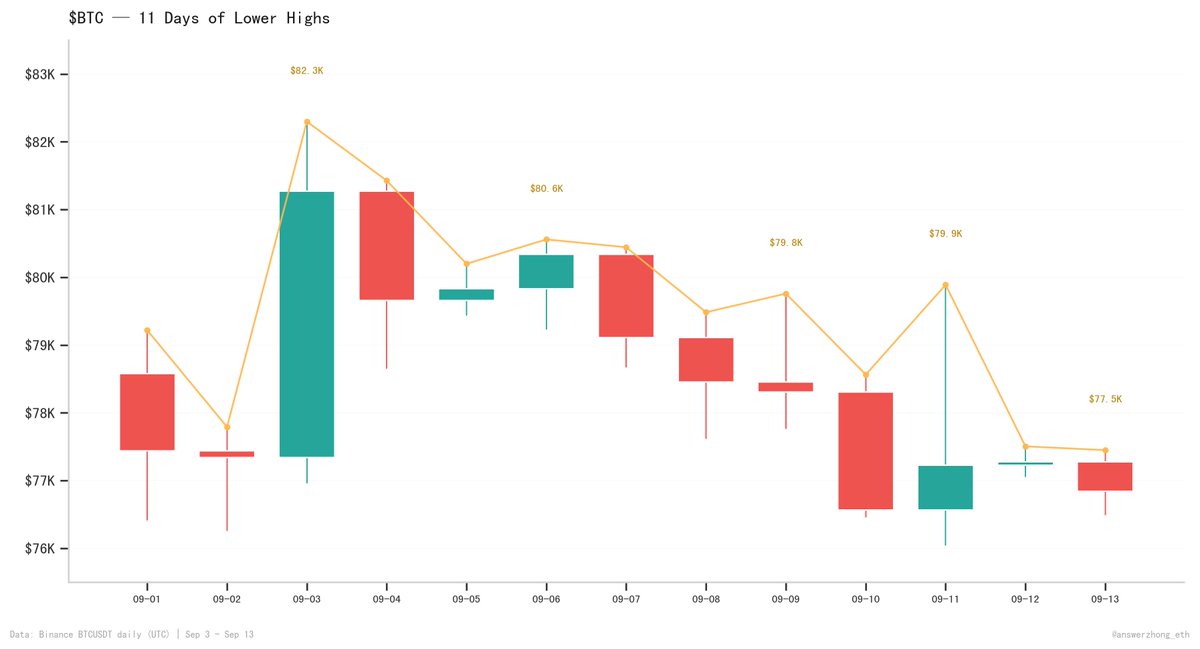
the "11 days of lower highs" didn't break though. sep 14 high was $79,600, sep 11 was $79,890. pattern technically still intact.
i called it wrong earlier. what actually happened: buyers showed up hard at the fib, but couldn't push through the old resistance.
revised read: $77k holds = bullish structure intact. $79.9k is the ceiling to watch. break above it with volume = structure shift.
$BTC
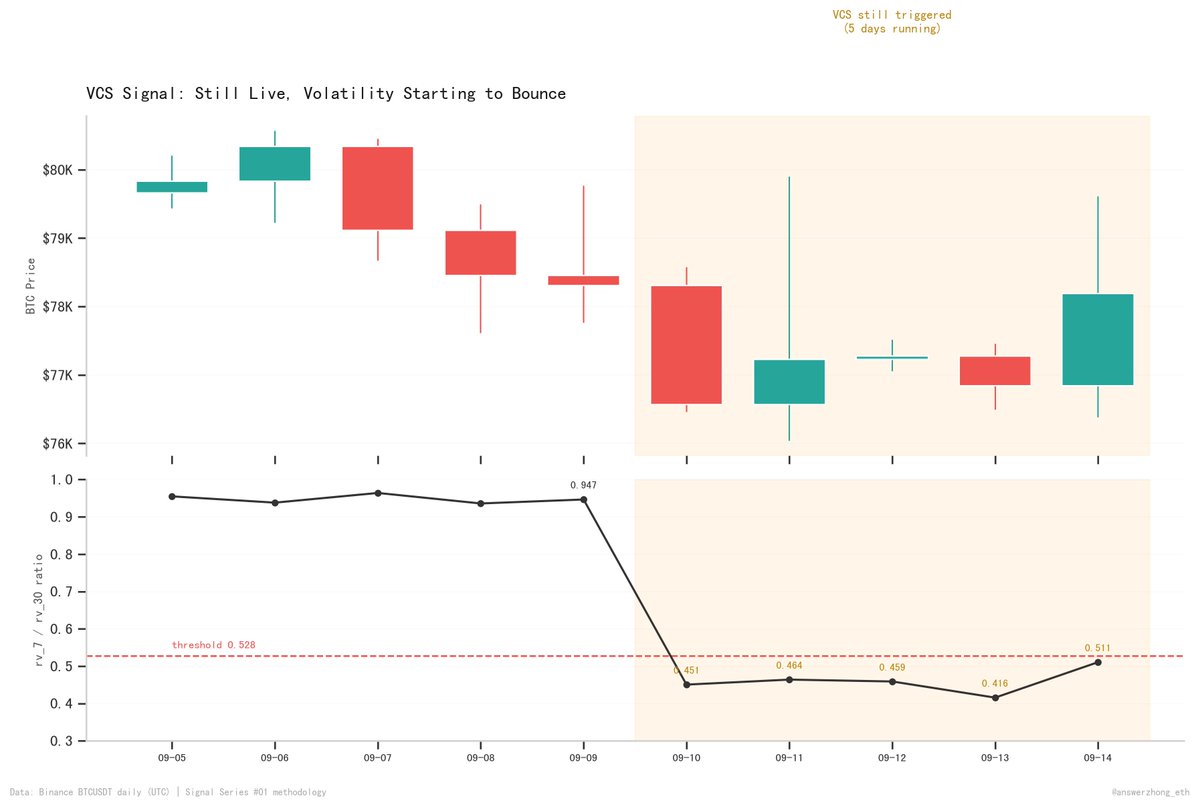
the VCS signal from last week's research has been live for 5 days straight.
triggered sep 10 at 0.451. bottomed at 0.416 on sep 13. yesterday pushed it back to 0.511 — still under threshold.
historically: 66% up rate, +2.3% median return over 10 days after this signal.
leaning long. $77k daily close is my invalidation.
When Bitcoin gets unusually quiet, most people think it's boring.
I ran 6.7 years of Binance data. Turns out these are the moments when volatility bounces back 80% of the time within 5 days.
Baseline: 49%.
The signal, the caveats, and one measurement I disagree with myself on: