Today's drop in gold prices was highly unusual.
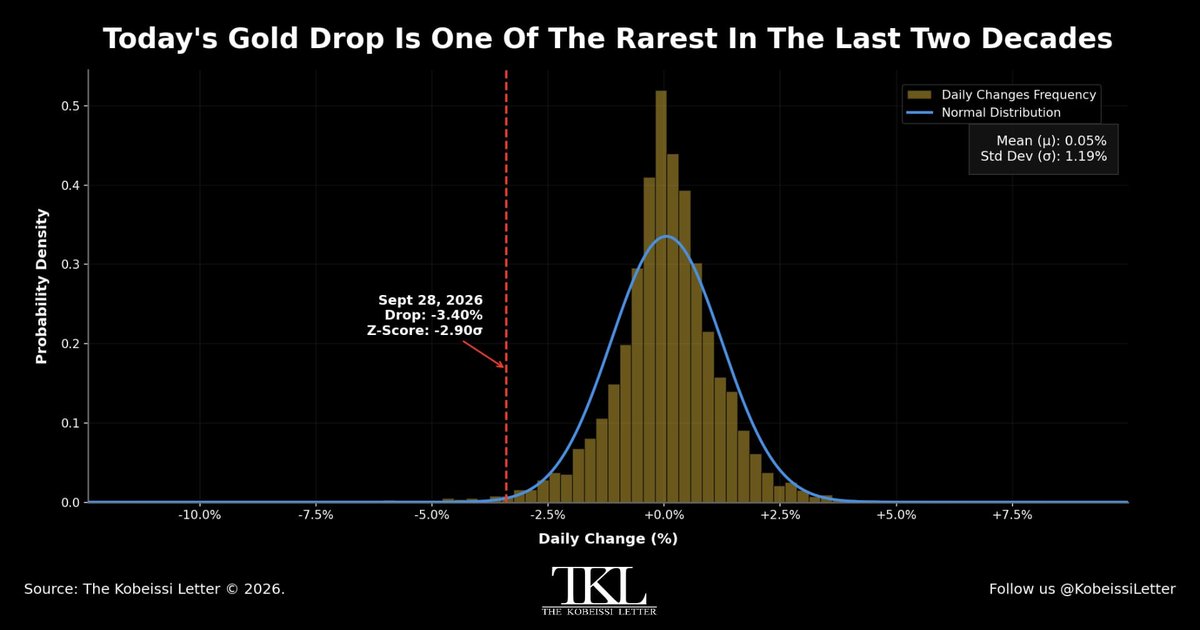
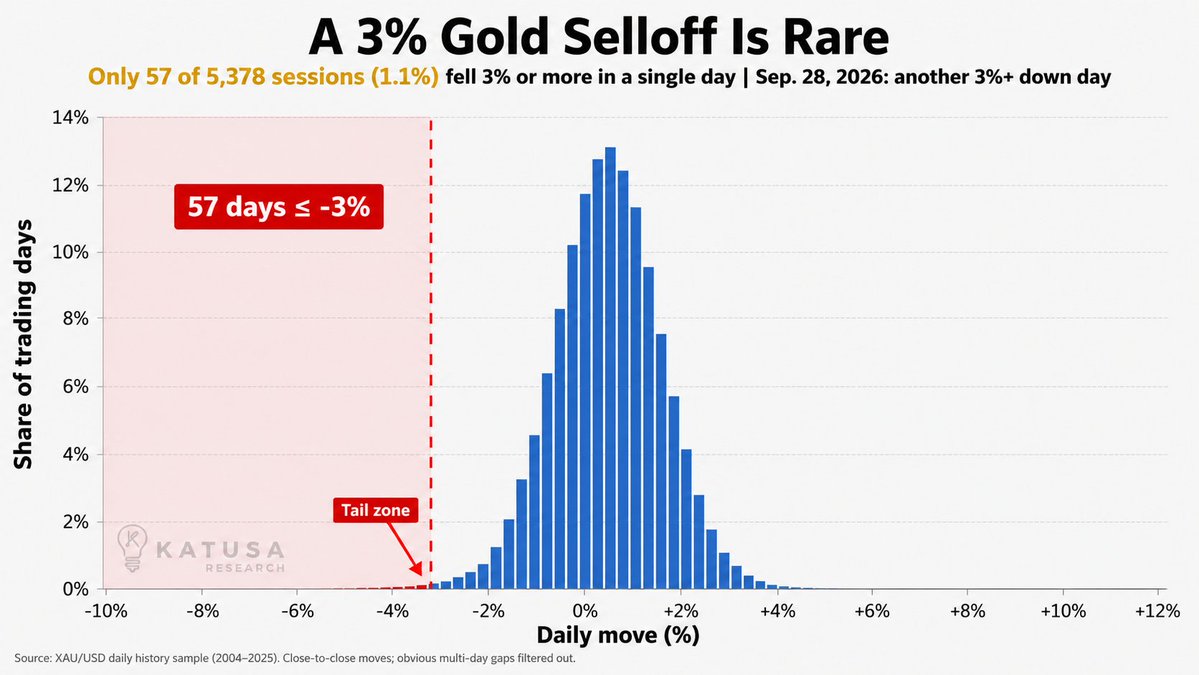
Gold prices fell -3.4% today, marking one of the rarest single-day declines of the last two decades.
Since 2006, gold has recorded an average daily change of +0.05%, with a standard deviation of 1.19%.
Today’s selloff registered a Z-score of -2.90, placing it deep in the left tail of the distribution.
Statistically, a daily decline this extreme occurs just ~0.2% of the time, or roughly once every 2 years assuming a normal distribution.
The surge in yields is creating an extraordinary disruption across the precious metals market.
US Treasuries are experiencing one of the worst bear markets in history:
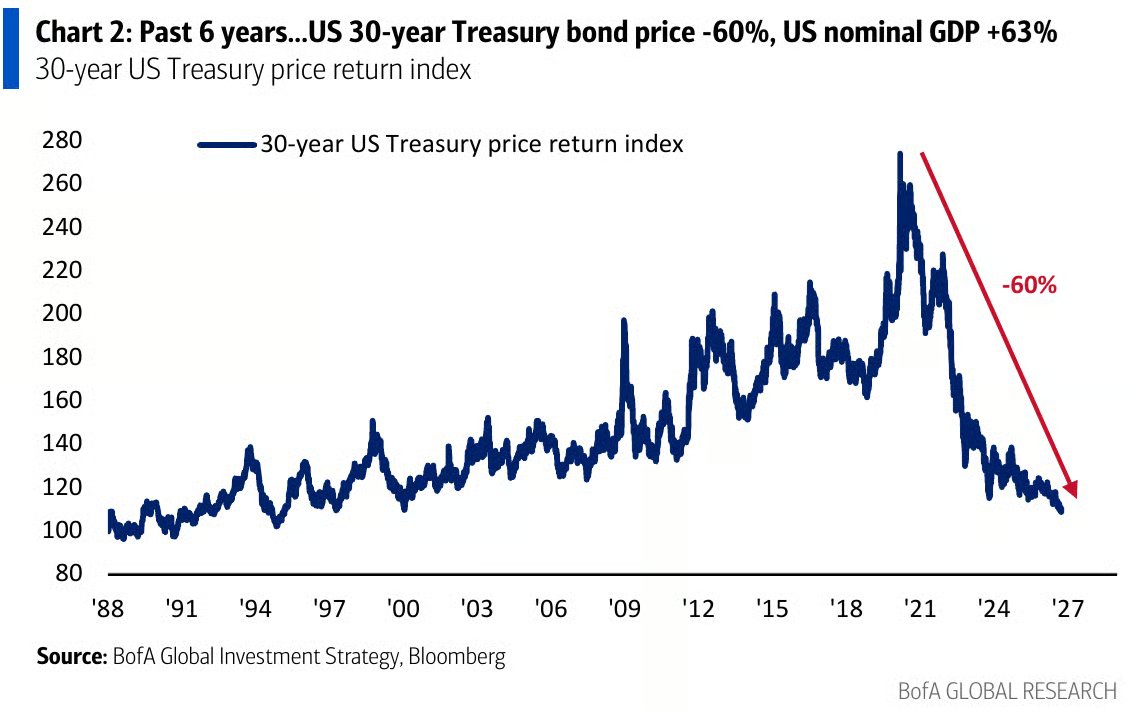
The 30Y US Treasury price return index has dropped -60% since 2020, to ~107, matching its lowest level in 2000.
In other words, in just 6 years, the index has erased nearly 20 years of gains.
By comparison, US nominal GDP has grown +63% over the same period.
This comes as the 30Y Treasury yield has surged +478 basis points from its intraday low of 0.71% set in March 2020.
To put this into perspective, its previous largest drawdown over the past 40 years was -35% during the 2008 Financial Crisis.
We are witnessing a historic bond market decline.
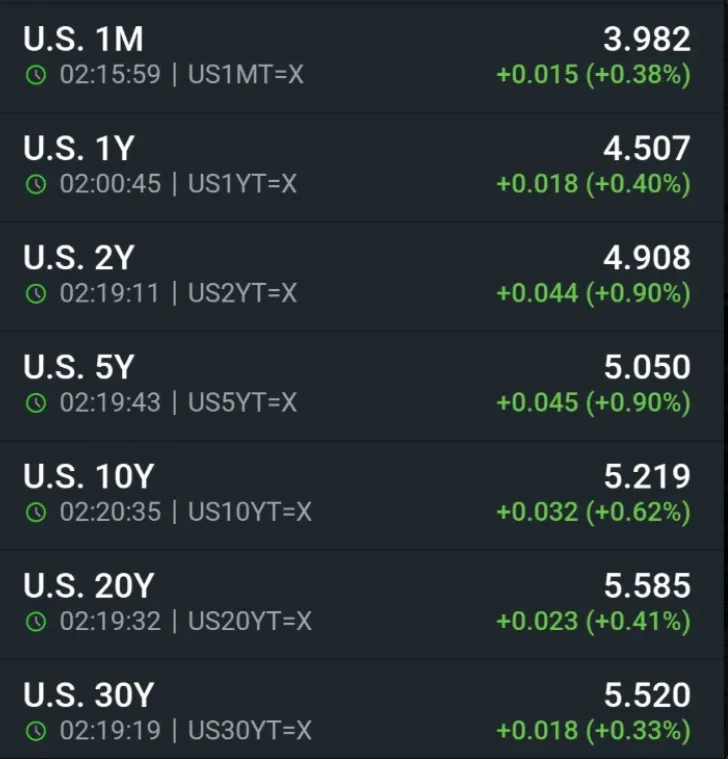
The same rising bond yields that knocked gold lower today are the yields Washington D.C. cannot let run forever. That’s the truth. A 5% 10-year and a 5.5% 30-year on more than $40 trillion of debt means interest will crest over $2 trillion a year as the debt grows. They know the math.
The Treasury is already the first backstop, buying bonds and using cash on hand. If yields keep climbing, the Federal Reserve is next. That means creating more dollars to hold rates down.
If you believe that is coming, gold does not have to look strong on a Monday in late September. You only need to trust that officials will keep printing rather than let the bond market break.
The US Treasury and Federal Reserve are at odds with the bond market.
The government simply cannot afford higher interest rates.
But the people who own the debt no longer think the risk is worth the reward, and they’re demanding higher rates.
That is fiscal dominance.
Money printing is inevitable. Gold and silver should be front-running that, but we’re currently seeing the opposite.
Don’t let the short-term price action distract you from the bigger picture.
The bond market is crashing, and in the short term, it’s taking down precious metals.
But just like in 2008, when the stock market crashed, gold and silver were among the first assets to skyrocket.
Know this:
Precious metals investors are the house now.
#gold #silver
Panic selling in bonds is starting to create systemic instability across markets.
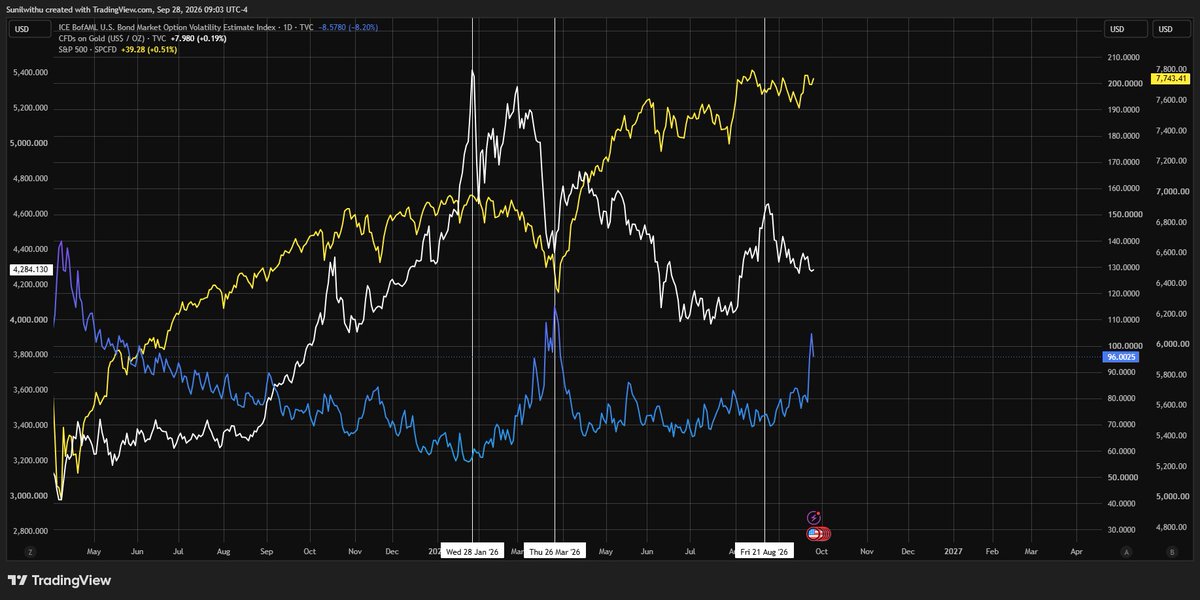
Look at the MOVE Index, essentially the VIX of the bond market.
During the initial phase of the Iran war, the spike in MOVE coincided with selling across gold, metals and equities.
The same pattern is appearing again.
Equities have been more resilient this time, but if bond volatility stays elevated, that resilience won’t last. Even fundamentally strong assets will get dragged lower when the bond market is forcing deleveraging.
But that panic is exactly when we should add strong assets.
I’m waiting for the right moment for another significant deployment into metals. I’m not trying to avoid the volatility, I’m waiting for it to create the opportunity.
Watch the MOVE Index closely.
Right now, it is telling you almost everything.
According to SovEcon, September wheat exports from Russia are expected to drop 56% from a year ago. Wheat exports in Ukraine are forecast to fall 52%.
WAR HAS SHUT OFF THE RUSSIAN & UKRAINIAN GRAIN TAPS, WHICH TRADITIONALLY ACCOUNT FOR 30% OF WORLD SUPPLY.
STAY LONG WHEAT.
The global money supply is surging:
M2 Money Supply of 4 major central banks rose +$1 trillion in August, to a record $103.66 trillion.
This covers the Fed, the European Central Bank, the Bank of Japan, and the People's Bank of China.
This also marks the 10th consecutive monthly increase.
Since 2020, M2 across these central banks has risen +$36 trillion, or over $5 trillion on average a year.
The purchasing power of currencies is eroding.
محافظ بنك فرنسا إيمانويل مولان: على فرنسا بذل كل ما في وسعها لتجنب أزمة ديون سيادية مع اقتراب الانتخابات الرئاسية العام المقبل، والتعويل على البنك المركزي الأوروبي للتدخل لإنقاذ البلاد سيكون «تفكيراً خاطئاً»
للمزيد| https://t.co/FVRJXJEENb
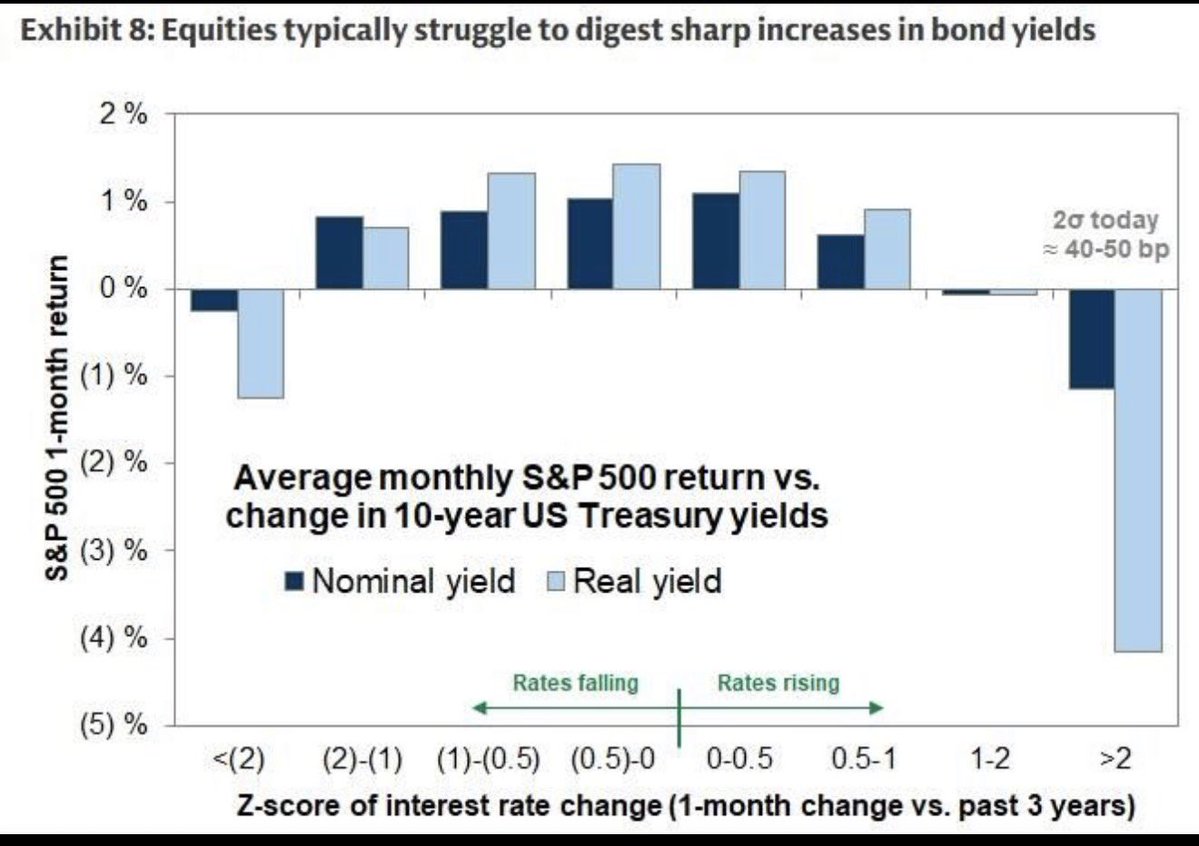
🚨 السر ليس في ارتفاع عوائد السندات بل في سرعة الارتفاع
تحليل مهم من متداولي جولدمان ساكس يكشف متى تبدأ الأسهم بالتأثر فعليا بعوائد السندات:
الأسواق لا تتأثر بمدى ارتفاع العائد بل بالسرعة التي يرتفع بها.
قاعدة جولدمان ساكس الذهبية:
تبدأ الأسهم في التراجع عندما تتحرك عوائد السندات لأجل 10 سنوات بمقدار انحرافين معياريين، وهو ما يعادل:
50 نقطة أساس خلال شهر واحد
أو 30 نقطة أساس خلال أسبوعين
أين نحن الآن؟
العوائد ارتفعت بالفعل نحو 25 نقطة أساس في أسبوعين، و 35 نقطة أساس خلال شهر، مما يعني أننا اقتربنا جدا من الخط الأحمر.
الأسهم تعاني دائما في هضم الارتفاعات السريعة والمفاجئة للسندات.
The MOVE Index is basically the VIX for the Treasury market, and MOVE often leads the VIX.
The fact that MOVE is seeing one of its biggest daily spikes in years today is a major warning sign.
Silver looks remarkably strong
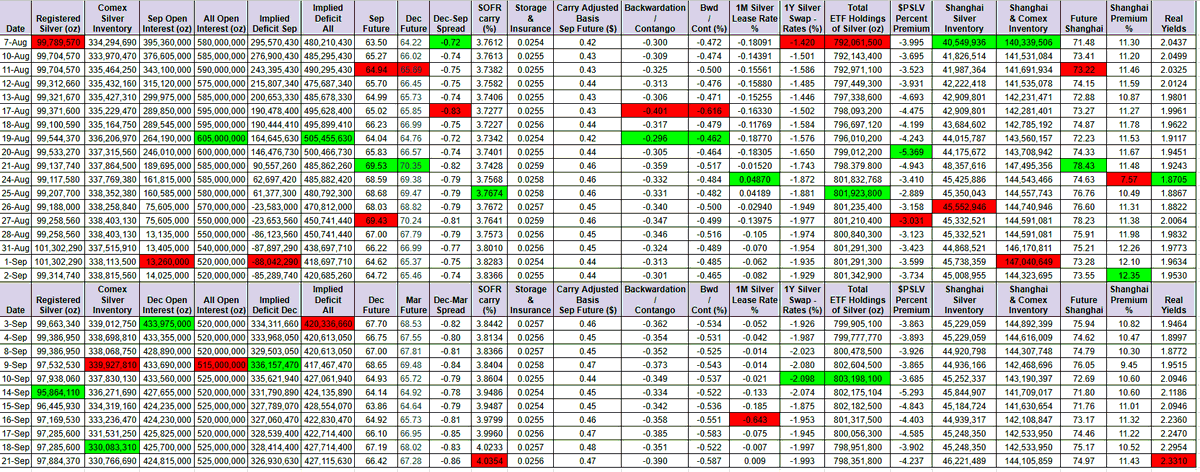
3month SOFR keeps hitting 52-week highs, while the 2year real yield rises too. Yet silver holds around $67 and the China premium keeps climbing
If the energy crisis breaks something in the West, silver will enter one of its strongest bull markets
In his interview with @PeterMcCormack Russell Napier points out that a 50-year French government bond issued in 2021 with a 0.5% coupon has, as of the interview, lost roughly 78% of its capital value, while French CPI has risen 18% over the same period. This has effectively wiped out the purchasing power of the supposedly "risk-free" asset.
https://t.co/54lp4ZYVNw
Stanley Druckenmiller: “We own copper. There is no new supply coming over the next 8 years, and we have a big add-on from the data center buildout.”
Copper is up 50% over the past year.
And we haven’t seen the peak shortage.
More than 70% of the world’s silver does not come from silver mines.
It falls out of lead-zinc, copper, and gold operations as a byproduct.
That is why “silver company” is such a messy label.
Top 100 public silver names:
→ $646.3B combined market cap
→ +11.7% average YTD gain
→ top 3 = 54.1% of the board
→ Honey Badger Silver: +337.8% YTD
A silver company can be:
1️⃣ a primary silver producer
2️⃣ a copper giant with silver output
3️⃣ a gold miner with polymetallic assets
4️⃣ a zinc-heavy producer
5️⃣ a streamer taking silver ounces without running the mine
6️⃣ an explorer with no cash flow but massive optionality
Same metal.
Six very different bets.
So when someone says they are bullish silver, which version do they really mean?
المستثمرون يشترون الذهب بقوة… والسعر ينزل.
هذا ليس تناقضًا عابرًا.
من منتصف أغسطس، حيازات صناديق الذهب ETF ترتفع بقوة، بينما سعر الأونصة يتراجع.
السهم البرتقالي (الحيازات) يصعد. السهم الأبيض (السعر) يهبط.
هذا الانفصال نادر… وغالبًا ما يسبق حركة كبيرة.
🧵👇
They are going to let inflation run hot intentionally but they will lie to the public about it and that's what will make the debt disappear. We are at the 'inflate it away part' and the only people that will pay are the ones holding dollars.
The 0.25% rate hike is pure theater. It gives the impression they are trying to fight inflation but they really aren't.
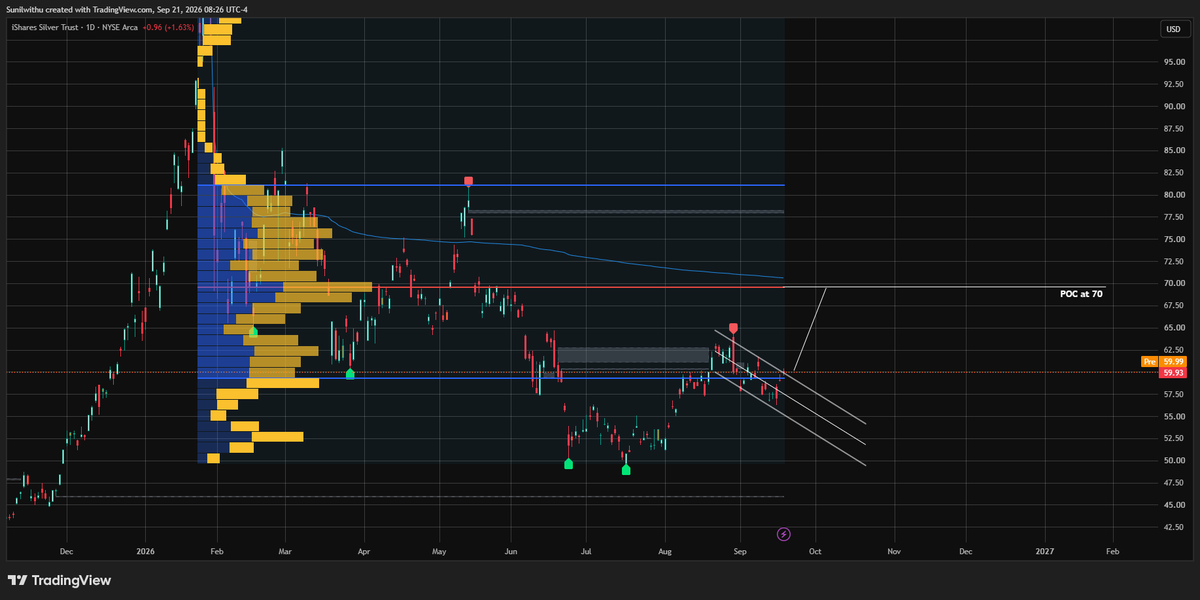
Silver is setting up for a strong move higher.
The volume profile and anchored VWAP drawn from the January peak on SLV are both pointing to the same conclusion: SLV should be testing 70 soon, which implies silver moving toward the 75–80 dollar zone very soon.
The structure is clear.
The anchored VWAP from the January peak is now around 71. That means shorts as a system are profitable below that level, and 71 is their breakeven zone. Once short-term reverses (which happened), price tends to get pulled back toward that level.
The volume profile from the same January peak also shows the POC around 70. That is the heaviest area of positioning, and when momentum shifts, algos love to chase those levels. They often act like magnets.
So both the anchored VWAP at 71 and the POC at 70, both measured from the January peak, are telling you the same thing: SLV is likely to be pulled higher toward that zone.
The gold/silver ratio is also pointing lower, which further supports more silver outperformance ahead.
Message is simple: the January peak structure is now acting like a roadmap, and it points higher.