#BTC Weekly Chart
50W SMA (blue line)
200D SMA (white line)
In the previous 3 cycles, once $BTC reclaimed the 200D SMA the bottom was in. Worth noting though that depending on which historical Bitcoin chart you use, some show January 2015 as the cycle bottom and others show August 2015.
Also, shortly after $BTC broke above the 200D SMA, the first test of the 50W SMA resulted in a rejection before it was eventually reclaimed.
What stands out is that all of this happened at the start of the pre-halving year in each cycle. If $BTC's price action follows this setup, it would be the first time it plays out in a mid-term year.
If history repeats and there's a rejection at the approaching 50W SMA, where it bottoms will be very interesting. How much it corrects, and the way it corrects, could give us a clue about the path $BTC takes afterward. Each of the past cycles took very different paths during the early bull cycle phase.
Not saying the bottom is definitely in because nobody knows for sure but the recent price action has increased the odds the bottom could be in.
@juxtathepozer@RobinhoodApp@coinbase@krakenfx Might be time to bust out the old paper wallets. These centralized hardware wallets seem like it gives people a false sense of security.
🚨 CRITICAL ETH SECURITY UPDATE
A critical vulnerability has been discovered in the Ethereum app on Ledger hardware wallets.
The flaw could allow a malicious application to alter ETH transaction details during signing without the change being visible on your Ledger device screen.
Fixed in Ethereum app v1.22.2
If you use Ledger for ETH or Ethereum assets:
• Update the Ethereum app to v1.22.2+
• Update Ledger Live
• Update your Ledger firmware
• Avoid signing transactions until everything is updated
If you hold ethereum:native on Ledger, update ASAP.
#BTC Weekly Chart
50W SMA (blue line)
200D SMA (white line)
In the previous 3 cycles, once $BTC reclaimed the 200D SMA the bottom was in. Worth noting though that depending on which historical Bitcoin chart you use, some show January 2015 as the cycle bottom and others show August 2015.
Also, shortly after $BTC broke above the 200D SMA, the first test of the 50W SMA resulted in a rejection before it was eventually reclaimed.
What stands out is that all of this happened at the start of the pre-halving year in each cycle. If $BTC's price action follows this setup, it would be the first time it plays out in a mid-term year.
If history repeats and there's a rejection at the approaching 50W SMA, where it bottoms will be very interesting. How much it corrects, and the way it corrects, could give us a clue about the path $BTC takes afterward. Each of the past cycles took very different paths during the early bull cycle phase.
Not saying the bottom is definitely in because nobody knows for sure but the recent price action has increased the odds the bottom could be in.
We have some difficult news to share. Unfortunately, one of our shipping providers has experienced a data breach that exposed sensitive order data. This affects new customers in the US, UK, Sweden, Colombia, Brazil, Italy, and Portugal who received an order within the 90 days prior to August 8th, 2026.
The data exposed:
- Full names
- Shipping addresses
- Phone numbers
- Email addresses
The incident affects 11,742 customers with full exposure (name, email, phone number, shipping address) and 1,947 customers with partial exposure (name, city, email). The breach is limited due to Trezor’s strict 90-day data storage policy (we were also able to negotiate the same terms with fulfillment partners, who follow the same policy).
All affected customers have been contacted separately by email.
Our systems and devices remain secure, but affected customers could experience an increase in phishing attempts.
NEVER enter your wallet backup on a website or share it with anyone, and only check for updates on official Trezor channels.
We are deeply sorry to the community and those affected.
We are investigating this situation and will post updates on our blog:
https://t.co/JGrttMs4Ev
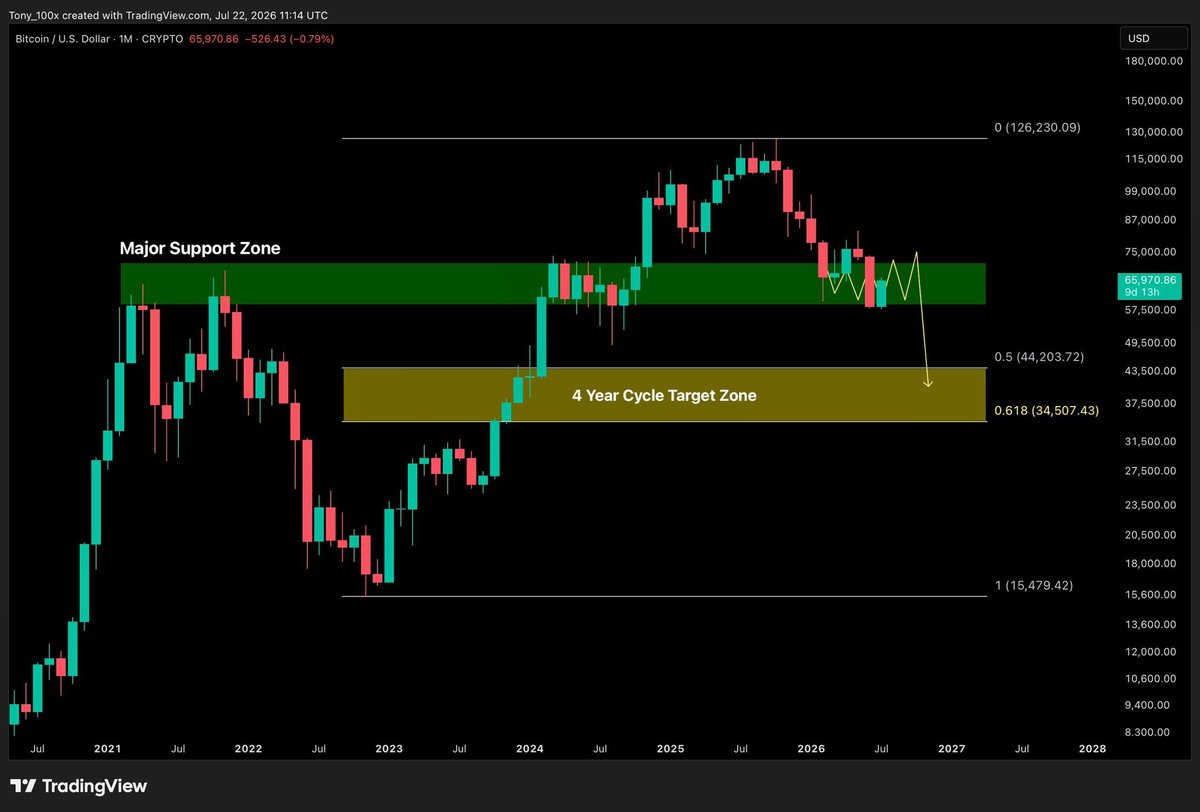
#BTC Monthly Chart
DUBIOUS SPECULATION
Major Support Zone vs 4 Year Cycle
So far, the Major Support Zone has held over the last 6 months. This zone is the single biggest threat to the 4 Year Cycle.
The 4 Year Cycle is simply the historical pattern of $BTC putting in a cycle low every 4 years. The reason the Major Support Zone is such a threat is that if it keeps holding as support on a monthly closing basis until the next bull cycle begins, it would mean $57k (the lower boundary) may have already been the cycle bottom back in June, many months ahead of the Q4 4 Year Cycle schedule.
However, if the 4 Year Cycle prevails once again as it has in past cycles, then the Major Support Zone has to break. If the MSZ breaks, the implications wouldn't just be for the current cycle but possibly the next one too, because the MSZ would flip into a Major Resistance Zone. Losing the MSZ on a monthly closing basis during this bear cycle could also kick off a decline into the 4 Year Cycle Target Zone, which aligns with the Deepening Fib Bottom Trend we've been covering for months in the ITC Cryptocosm Telegram alerts.
Obviously nobody knows what plays out over the coming months, but these 2 opposing forces will have to decide which one is stronger relatively soon. One would make history, the other would repeat it.
#BTC Monthly Chart
DUBIOUS SPECULATION
Major Support Zone vs 4 Year Cycle
So far, the Major Support Zone has held over the last 6 months. This zone is the single biggest threat to the 4 Year Cycle.
The 4 Year Cycle is simply the historical pattern of $BTC putting in a cycle low every 4 years. The reason the Major Support Zone is such a threat is that if it keeps holding as support on a monthly closing basis until the next bull cycle begins, it would mean $57k (the lower boundary) may have already been the cycle bottom back in June, many months ahead of the Q4 4 Year Cycle schedule.
However, if the 4 Year Cycle prevails once again as it has in past cycles, then the Major Support Zone has to break. If the MSZ breaks, the implications wouldn't just be for the current cycle but possibly the next one too, because the MSZ would flip into a Major Resistance Zone. Losing the MSZ on a monthly closing basis during this bear cycle could also kick off a decline into the 4 Year Cycle Target Zone, which aligns with the Deepening Fib Bottom Trend we've been covering for months in the ITC Cryptocosm Telegram alerts.
Obviously nobody knows what plays out over the coming months, but these 2 opposing forces will have to decide which one is stronger relatively soon. One would make history, the other would repeat it.
#BTC 12 Month Chart
Unlike the stock market, $BTC is the first generation lifetime guinea pig for everyone over the age of 17, the test of whether we turn out to be the first ones to kick off a hundred year uptrend like the $SPX.
The risk of being that first generation is the danger of extreme volatility in a new asset class that is younger than any living adult. That said, the excitement of being lucky (or unlucky) enough to experience a once in a generation or two opportunity is exactly what has fueled Bitcoin's massive growth since birth.
Holding or DCAing $BTC could turn out to be a huge win over the course of our lifetime, but sitting through its traditional bear cycles can be unnerving, especially for the noobs, while the OGs have gone numb to it. Based on the 12 month chart, though, there's a real possibility that a bigger and longer bear market than usual could smack the numbness right out of the OGs and make them question the Bitcoin proposition.
Each bear cycle is marked on the chart and clearly visible as a red candle. The 2014 candle looks almost like a blip between massively bullish green ones. The 2018 red candle is still relatively small next to the green candles before it. The 2022 red candle is where it became noticeably larger, engulfing the 2021 post-halving green candle.
The current 2026 red candle, which is only halfway in, appears to be confirming the first ever red post-halving year candle, which happens to be a doji, suggesting a HTF topping signal. I'm not saying the $126k peak in 2025 is the absolute Bitcoin top, but one has to wonder, without bias, what this weakening trend becomes over the next couple of cycles. Could we one day get a cycle with a lower peak and a lower bottom? If that happens, we'll be able to point back to exactly what we're discussing now and say the signs were there.
Despite this grim but non-negligible possibility, for a new asset class to build a 100+ year uptrend like the $SPX, it needs deep and long corrections to reset the HTF. The stock market has had brutal, drawn out bear markets in every generation's lifetime, and pretending Bitcoin won't is foolish. And I'm not talking about your average 4 year cycle bear markets, which are basically little pullbacks on the 12 month chart.
#BTC Next Cycle Peak
I asked Claude Opus 4.8 a follow-up: if BTC bottoms at ~$36K in Nov 2026, where and when does the NEXT cycle peak — using only the math and historical patterns?
Here's what it came up with 👇
🚨 BITCOIN'S NEXT PEAK — THE MATH SPLITS 🚨
⏱️ TIMING — the strong call
Rising phase (bottom → next peak): 24, 35, 35, 35 months. Last three identical.
Nov 2026 + 35 = October 2029.
Peak → peak: 29, 49, 47, 47 months. Last two identical.
Oct 2025 + 47 = September 2029.
Two independent clocks land one month apart → ~Sep–Oct 2029. High confidence.
💰 MAGNITUDE — no clean answer (and that's the finding)
Five extrapolation methods, anchored on a $36K bottom:
• Log-gain decay → $176K
• Log-gain (last ratio) → $169K
• Excess-multiple decay → $155K
• Log-linear multiples → $79K
• Rally-from-bottom → $69K
They split into two camps:
🟧 New all-time high: ~$155K–$176K (3 methods)
🟥 NO new high — at/below the current $126K peak: ~$69K–$79K (2 methods)
Across all five:
• Median: ~$155K
• Geometric mean (best single point for multiplicative data): ~$120K
• Full range: ~$69K–$176K
🎯 BOTTOM LINE
Timing: ~Sep–Oct 2029 (robust)
Magnitude: central ~$120K, range $69K–$176K — a genuine coin-toss between a modest new high and no new high at all.
The takeaway: diminishing returns have compressed the cycles so far that the math no longer guarantees a higher high. That's a legitimate output of the trend — not an error.
⚠️ Curve-fitting on 5 cycles. The timing is tight; the magnitude is fragile. Not financial advice.
I’ve always believed that cycle bottoms are much easier to forecast than cycle peaks. And that the likelihood of a higher cycle peak reduces each cycle due to the aggressive diminishing return for the upside. Interestingly, Claude appeared to reach the same conclusion, as it also seemed to struggle with producing a high confidence forecast for the next cycle peak.
https://t.co/FrER4WVzvK
🤖 I asked **Claude Opus 4.8** one question: using nothing but the math and historical patterns of past Bitcoin cycles — no fundamentals — where and when does this cycle bottom?
Here's what it came up with 👇
🚨 BITCOIN'S BOTTOM IS HIDING IN THE MATH 🚨
Four cycles. One pattern. Here's where Cycle 5 lands.
The Question:
Using only mathematics and historical price patterns (no fundamentals), where and when will the current cycle bottom — based purely on the timing and magnitude of prior cycle peaks and bottoms?
📊 The Data
Cycle 1 — Peak Jun 2011 $31.91 → Bottom Nov 2011 $1.99
Cycle 2 — Peak Nov 2013 $1,242 → Bottom Jan 2015 $152
Cycle 3 — Peak Dec 2017 $19,804 → Bottom Dec 2018 $3,125
Cycle 4 — Peak Nov 2021 $68,998 → Bottom Nov 2022 $15,474
Cycle 5 — Peak Oct 2025 $126,219 → Bottom = ?
1️⃣ MAGNITUDE — each crash is shallower than the last
The key measure: how much of its peak price did BTC hold onto at the bottom? (bottom ÷ peak)
• Cycle 1: kept 6.2% → fell ~94%
• Cycle 2: kept 12.2% → fell ~88%
• Cycle 3: kept 15.8% → fell ~84%
• Cycle 4: kept 22.4% → fell ~78%
The amount it holds onto rises every single cycle — meaning the crashes are getting less brutal as Bitcoin matures. Extend that trend → ~27% held for Cycle 5.
$126,219 × 0.27 ≈ $34,000
Cross-checks (drawdown decay + peak/bottom multiple) land in the $34k–$38k zone. Note: ~$35k is also ½ of the prior cycle's $69k peak — a clean confluence.
2️⃣ TIMING — two clocks agree
Peak → bottom durations: 5, 14, 12, 12 months.
Last three cluster tight → ~12–15 months → late 2026 / early 2027.
Bottom → bottom intervals: 38, 47, 47 months.
Nov 2022 + 47 = October 2026.
Peak → peak also locked near 47 months — rhythm is internally consistent.
Both independent clocks point to late 2026.
🎯 BEST ESTIMATE
~$36,000 (range $32k–$40k)
Timing: ~Oct–Dec 2026
⚠️ Caveats
Curve-fitting on 4.5 data points. The magnitude trend is clean and monotonic (the stronger signal); timing rests on a recurring ~47-month rhythm that can break anytime. Not financial advice.
🤖 I asked **Claude Opus 4.8** one question: using nothing but the math and historical patterns of past Bitcoin cycles — no fundamentals — where and when does this cycle bottom?
Here's what it came up with 👇
🚨 BITCOIN'S BOTTOM IS HIDING IN THE MATH 🚨
Four cycles. One pattern. Here's where Cycle 5 lands.
The Question:
Using only mathematics and historical price patterns (no fundamentals), where and when will the current cycle bottom — based purely on the timing and magnitude of prior cycle peaks and bottoms?
📊 The Data
Cycle 1 — Peak Jun 2011 $31.91 → Bottom Nov 2011 $1.99
Cycle 2 — Peak Nov 2013 $1,242 → Bottom Jan 2015 $152
Cycle 3 — Peak Dec 2017 $19,804 → Bottom Dec 2018 $3,125
Cycle 4 — Peak Nov 2021 $68,998 → Bottom Nov 2022 $15,474
Cycle 5 — Peak Oct 2025 $126,219 → Bottom = ?
1️⃣ MAGNITUDE — each crash is shallower than the last
The key measure: how much of its peak price did BTC hold onto at the bottom? (bottom ÷ peak)
• Cycle 1: kept 6.2% → fell ~94%
• Cycle 2: kept 12.2% → fell ~88%
• Cycle 3: kept 15.8% → fell ~84%
• Cycle 4: kept 22.4% → fell ~78%
The amount it holds onto rises every single cycle — meaning the crashes are getting less brutal as Bitcoin matures. Extend that trend → ~27% held for Cycle 5.
$126,219 × 0.27 ≈ $34,000
Cross-checks (drawdown decay + peak/bottom multiple) land in the $34k–$38k zone. Note: ~$35k is also ½ of the prior cycle's $69k peak — a clean confluence.
2️⃣ TIMING — two clocks agree
Peak → bottom durations: 5, 14, 12, 12 months.
Last three cluster tight → ~12–15 months → late 2026 / early 2027.
Bottom → bottom intervals: 38, 47, 47 months.
Nov 2022 + 47 = October 2026.
Peak → peak also locked near 47 months — rhythm is internally consistent.
Both independent clocks point to late 2026.
🎯 BEST ESTIMATE
~$36,000 (range $32k–$40k)
Timing: ~Oct–Dec 2026
⚠️ Caveats
Curve-fitting on 4.5 data points. The magnitude trend is clean and monotonic (the stronger signal); timing rests on a recurring ~47-month rhythm that can break anytime. Not financial advice.
It has finally begun...
Bitcoin's monthly Bollinger Bands are expanding from the tightest squeeze in its entirely history of price action
And it is happening below the Bollinger Band basis, just $5,000 away from the lower Bollinger Band
A monthly close below the lower Bollinger Band will be the first ever sell signal according to the indicator