$TRAC ran about 5x after it first came to my attention in 2023.
It has now found its way back to the original accumulation zone that I had marked off back then.
Fully diluted supply of 500M and current marketcap of 200M means zero token inflation and plenty of upside potential for @origin_trail.
It has been a core holding for me since I spoke about it a couple of years ago and it seems fundamentals have only gotten stronger since then.
I don't think you can go wrong with picking up some spot again at these levels.
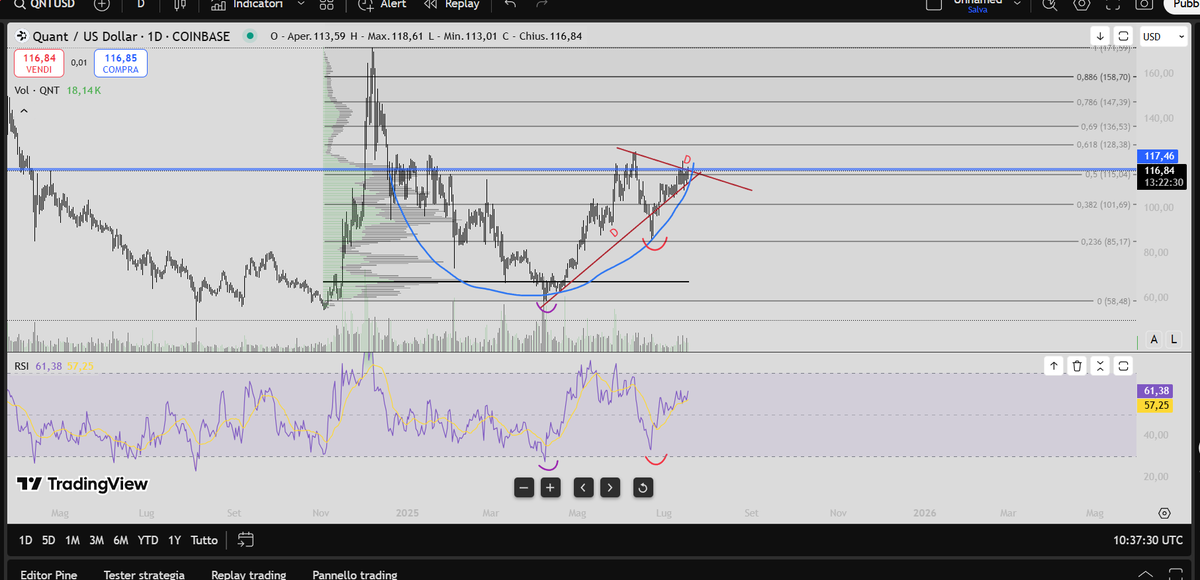
@QuamfyOnly let him to do QNT things. It's just reaching again the hig level of neck line. We can only expect a bull case or bear case. Only the next days can reveal us which
Classic bullrun cycle: BTC→ETH→ALTSZN
Everyone think "this cycle is different". It’s not
The reason alts didn’t pump before is BTC hadn’t hit ATH
BTC just hit ATH
Retail & alt index still bottomed
ALTSZN is near. Here’s when, why, and how to prepare 🧵👇
Furthermore, this candle has found support at the Fibonacci level just like it happened in 2023. This is information that you can confirm yourself on TW. It's time for the alts to pump again
$BTC $ALT $TOTAL
Total 3. Dominance of all Crytpo except the top 10. Monthly timeframe to be even more reliable. AD+ Divergence and Price Action. Typically all the lows recorded by AD+ are 100% of the time (at least so far) recorded in cases of local bottom. You understand that in a monthly timef
rame the vision is long-term and therefore accuracy increases. As of today, as you can see, both RSI and AD+ are prone to inverting. The candle we are writing this month really looks like a bottom candle, full shadow and with the possible start of a new bullish impulse.
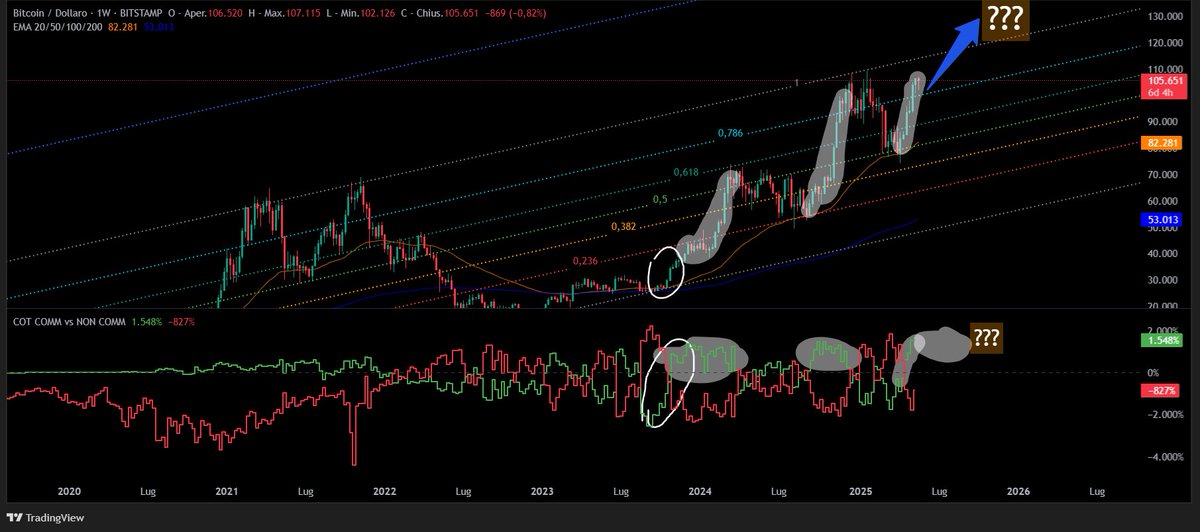
$BTC in thic chart u can followe the moviment of price action based on COT. In the description of the photo u can read more about it
Source: Trading View, CFTC (Commodity Futures Trading Commission)
#COTBTC#COT#BTC