🔊WEBSITE LAUNCH
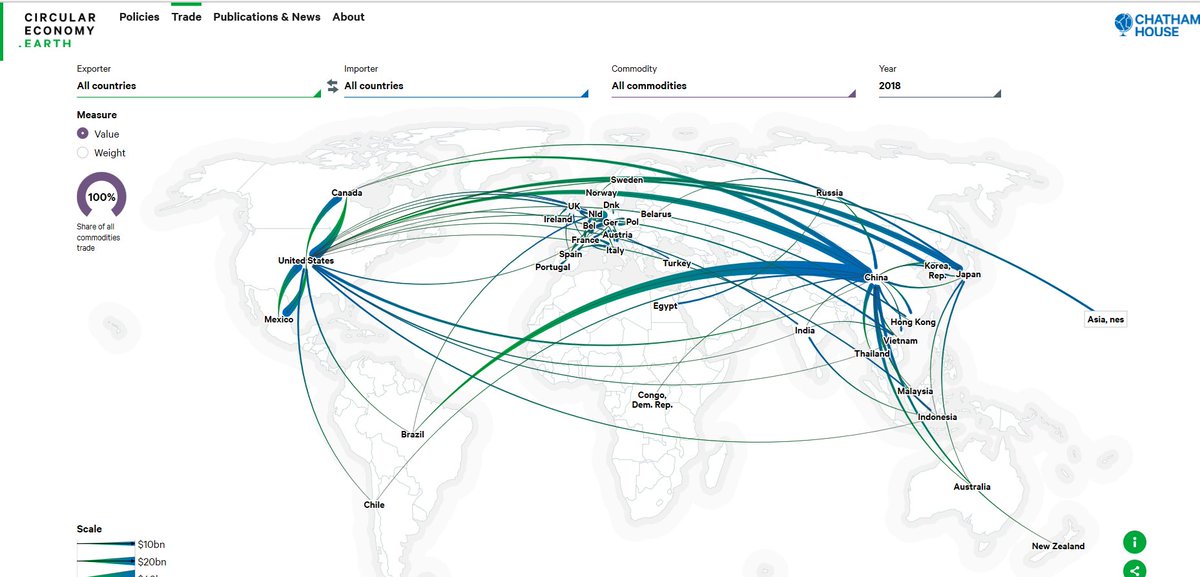
We are delighted to launch https://t.co/YBcL3JGi2R, which allows users to explore the #policy and #trade dynamics associated with transitioning to a #circulareconomy.
Click here to check it out: https://t.co/MemZSQ2ZlI
No coding required. Create on-brand, interactive, shareable charts quickly and easily inside your CMS with #AppliedCharts. Find out more at https://t.co/J7FrfSrW2O
#charts#dataviz#data
.@ChathamHouse has launched an online tool to help analyze circular economy #trade flows and trends
The tool uses available data from UN Comtrade, and focuses on resources which are of particular significance to the #circulareconomy@circulareconomy
https://t.co/mQARbr3Bio
Custom styling built in for superior consistency. It takes only minutes to design and brand your charts. Learn more at https://t.co/J7FrfSrW2O 📊
#AppliedCharts#charts#dataviz#data
Resource Trade is an explorative data platform by @ChathamHouse that visualises the trade patterns of our planet’s natural resources. The publications section features many charts created using #AppliedCharts: https://t.co/ueK5Xpkug1
#ChathamHouse#ResourceTrade#dataviz#data
Applied Works @appliedworks recently launched this interactive data explorer from @ChathamHouse, giving the circular economy global attention. Great to see #AppliedCharts being used within the publications section: https://t.co/bXZcqgmeLl
#ChathamHouse#CircularEconomy#dataviz
Hello Twitter! At a time when publishing and sharing data has never been more important, @appliedworks reimagines a solution for easy chart authoring. Learn more at https://t.co/gLjzIPwYT8 #AppliedCharts#dataviz#charts#data#chartbuilder