@TheWiseIC@shmidtqq Ok to summarize: concentration of power in the hands of the entities and corporations that control these country of geniuses in a datacenter (automating <50% of human labour). It would be deflationary if demand is below the increased supply this can go either way.
@tenaglia_john@StealthQE4 UST rates traded sideways since 2023 in step with the rate of change in inflation which really should not happen with m2 resuming its perpetual rise. M2 purchases equities has a counterparty, the counterparty either buys UST or gets eaten by 2% inflation. Equilibrum if S&P +EPS.
@TradersCult_IN@riteshmjn services + remittances -> $697B USD <-> INR. Total external debt $736B. Current account break even. The fed sits on 3.4 trillion external revenue in 2025. Focus on actual NDP quality durable net wealth creation, trade surplus. external revenue.
@CNBCTV18News FDI inflows (foreign currency exchanged for domestic) is future repatriation of profits (their income). They are not investing to give capital away.
Another case of how to lie with statistics by Kobeissi - 2nd chart crime of his today I have debunked!
Again, there is data and then there is CONTEXT…
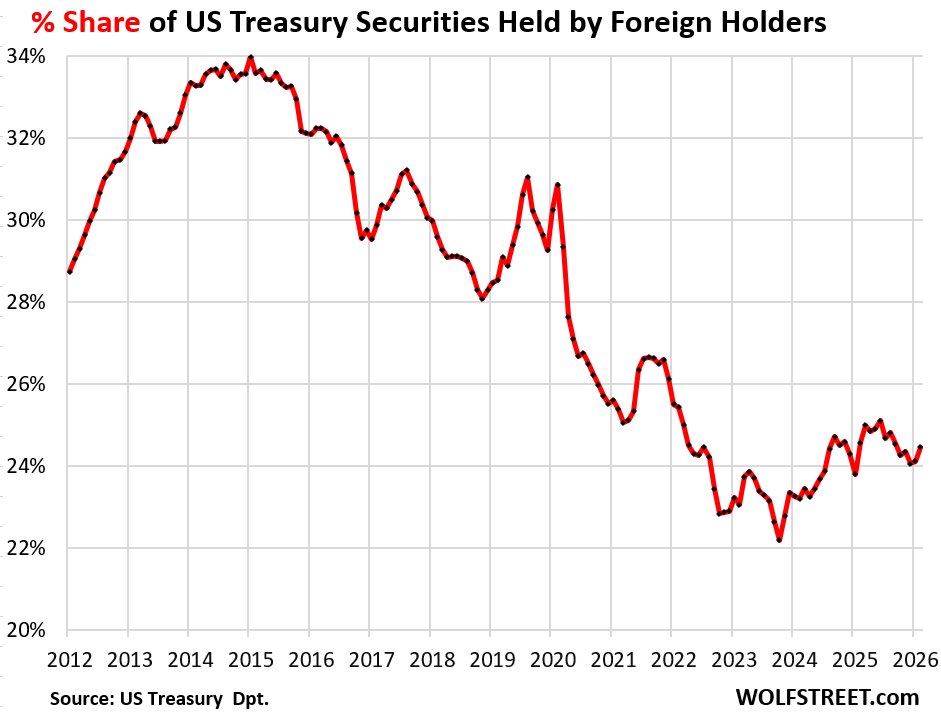
The share of total Treasury securities held by foreign entities peaked at 34% in 2015, then fell to a low of 22% in October 2023… but let’s see what has trended higher to make up for all that - and more!
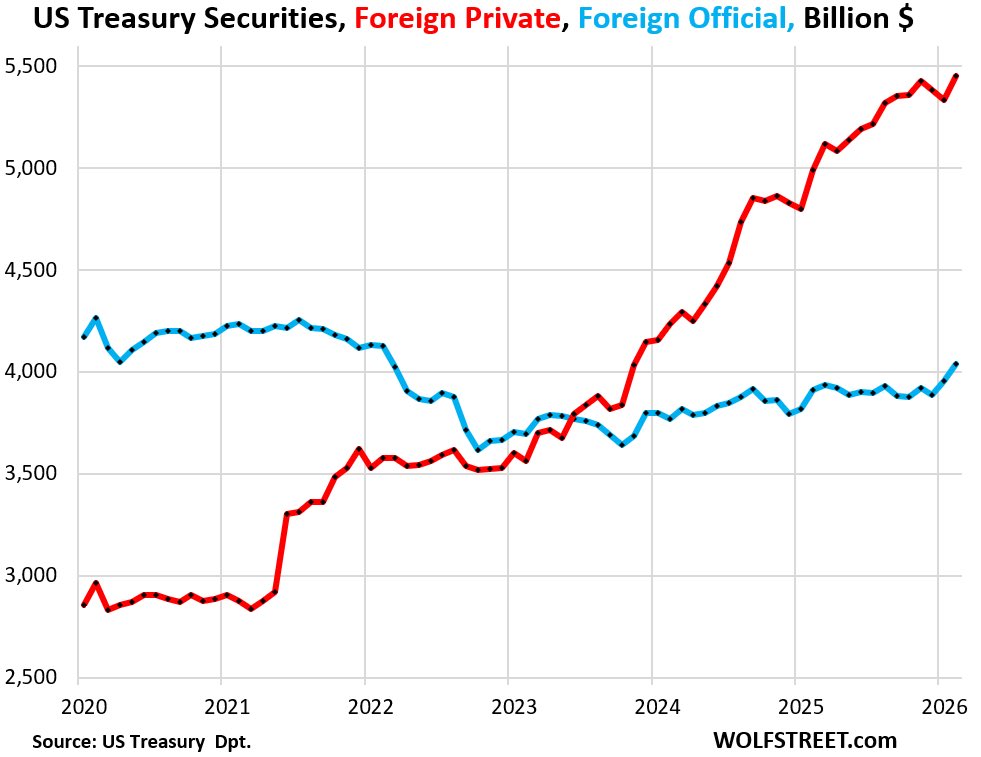
“The driver behind the multi-year increase were “PRIVATE foreign” holders: they increased their Treasury holdings by $117 billion in February, and by $461 billion over the 12-month period, to a record $5.45 trillion (red in the chart below).
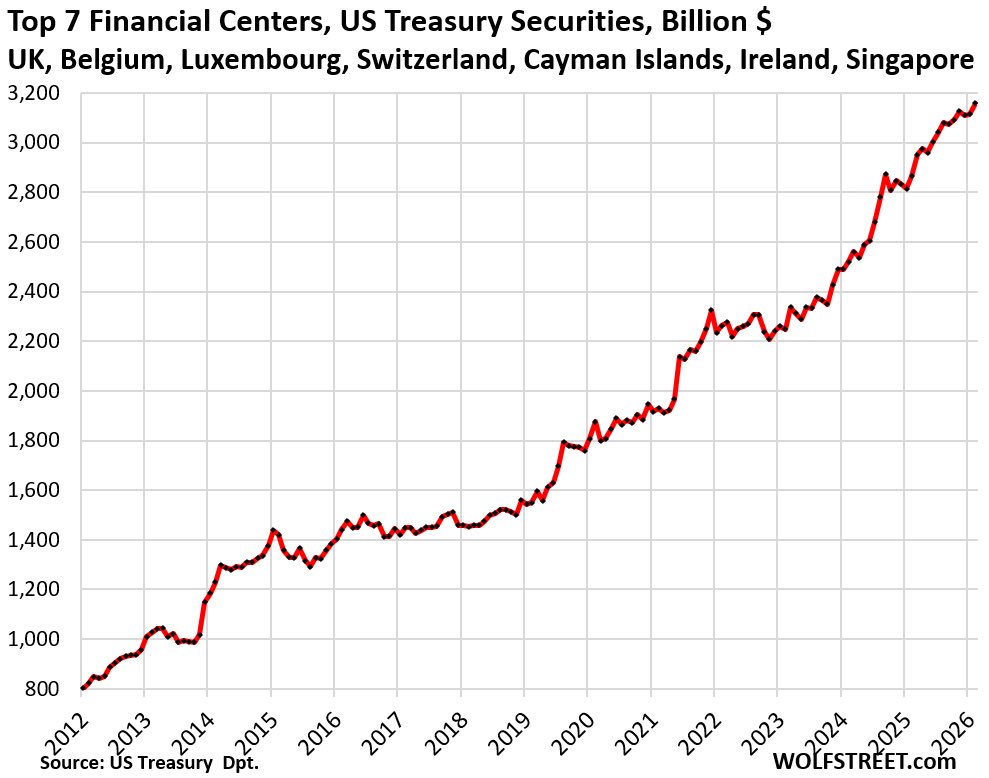
These private foreign investors include financial firms in other countries, foreign bond funds, foreign companies, individuals in foreign countries, but also US HEDGE FUNDS domiciled in the Cayman Islands, such as those engaged in the “Basis Trade,” and Corporate America with financial entities in Ireland, such as to legally dodge US taxes.
These Cayman-domiciled US hedge funds engage in the basis trade. They’re highly leveraged in these positions. They’re long (they buy) Treasury securities and are short (they sell) Treasury cash-futures. It’s a massive business.
In normal times, it provides liquidity to the Treasury market. During times of turmoil, such as in March 2020, those trades cause the Treasury market to seize – and the Fed ended up stepping into it to get it going again.
So the actual Treasury holdings in the Cayman Islands would be close to $2 trillion, not $443 billion – more than any other country.
But these holdings by Cayman-domiciled US hedge funds are foreign holdings in name only. That’s the same issue with the other financial centers that hold Treasuries of US entities. That’s not really “foreign” demand for US Treasury securities.”
H/t @wolfofwolfst 🎩
 https://t.co/lXXxYpBWMP
S&P 500 / M2 is repeating the dot-com fractal.
Not a coincidence. It's structure.
Dividing S&P 500 by M2 removes monetary noise and reveals the market in real liquidity terms.
The 2000 peak and the 2026 peak are nearly identical on this metric. Same extension. Same momentum. Same denial at the top.
The market didn't change. The narrative did.
In 1999 it was "the internet changes everything."
In 2026 it's "AI changes everything."
Both statements are true. The valuations are not.
The dot-com bubble didn't burst because the technology failed. It burst because expectations drifted too far from reality. Speculation assigned a weight that fundamentals couldn't support.
Same structure. Same behavior. Different story.
The chart projects a return to the 0.382 Fibonacci level as the first real support, a zone that aligned with the 2002~2003 lows in the previous structure.
Below that, 2009 marked the definitive bottom of the S&P 500 / M2 crash. Coincidentally, that's when Bitcoin was born.
Global liquidity will determine the speed. Not the direction.
The question is not whether this is a bubble. It's where in the cycle we are.
History doesn't repeat.
It rhymes.
When scarcity is anticipated, the futures curve is always in backwardation. I would hope you'd understand that. Are you leaving something out of your argument?
When the premium on "oil now" spikes sharply over "oil later," the market signal is "oil higher." The bull market normally has a positive roll yield. The out-month contracts roll up in price to the in-month contracts. The appreciation is the premium for going long.
When the case reverses and the out-month contracts price higher than the in-month contracts, then you have a bearish market. Then you have a short premium. Then you have anticipated abundance. You have it exactly backwards.
It's like you're trying to trick people who don't know better.
People often ask if something is a cult when what they actually want to know is if it's a form of extremism: does it cause people to deviate far from moral instinct or convention? Ideas that successfullly overcome mechanisms selected for social stability can be quite dangerous.
@investor1858 It means that new highs produce more new highs and you’ll never the guess final high so you might as well ride ‘em all until the trend ends.