Day 50/120 – Guided project
I continued building my retail dashboard in Power BI and started connecting more meaning to the numbers I've been working with.
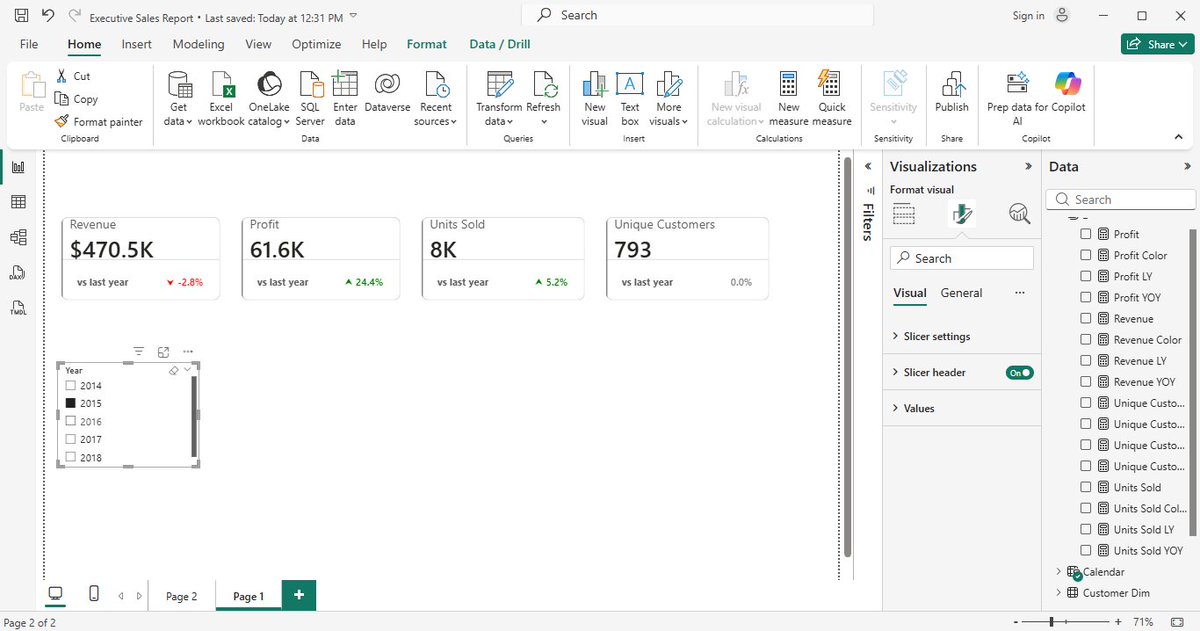
Day 47/120 – Building a Dashboard in Power BI
Raw data can be difficult to understand until it's presented visually and that's where dashboards come in.
Dashboard help stakeholders spot trends, patterns, and relationships in data to support decision-making.
He’s currently in Australia, doing so well
Two remote jobs
Married with a baby girl.
Time, what a concept.
He buzzed me, guy how far where I fit put this 50m, I just begin smile on his behalf
Two Anthropic engineers spent 24 minutes exposing every Claude Code feature you didn't know existed.
Most people will scroll past this. Don't be most people.
Next April, 2027 at this exact time, you’ll be standing in the places you used to dream about. Living your most beautiful rich life. Send this to yourself.
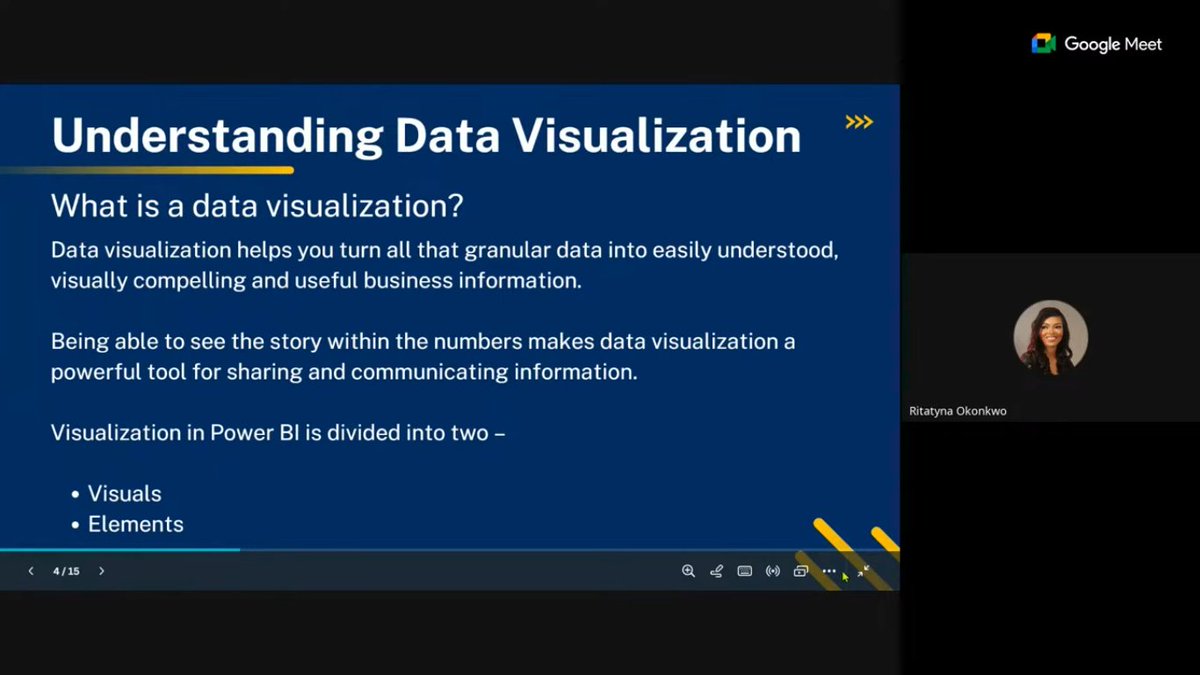
Day 40/120– Data Visualization
Today I focused on data visualization in Power BI, not just building charts but understanding how and when to use them. Data visualization turns raw data into something easier to understand, making patterns and trends easier to spot at a glance.
Nobody talks about supply chain as a career path and it is a mistake. Supply chain analyst. Average salary $90,000 to $110,000. Senior roles at $130,000+. Remote friendly. Needed in every industry. Healthcare, manufacturing, tech, retail, government. The Google Supply Chain certificate on Coursera is under $300. Most people chasing tech overlook the fact that every company on earth has a supply chain that needs managing.