We fine-tuned CodeLlama-13B on spreadsheets! The result: the first "GitHub Copilot for spreadsheets", predicting formulas with GPT-4 level accuracy in under ~300ms.
We've also trained it on complex cross-sheet aggregations, making financial reports a cinch:
Today marks the one-year anniversary of our original essay on Generative AI. Nobody could have predicted the firestorm that ensued.
In this new essay, we discuss what we got right and wrong, where we stand, and where we go from here.
https://t.co/qHwMNWlmUq
At Flexport, I learned a ton about logistics, especially about how the hardest part is often the “last mile”. The same lessons apply for data.
Read more about the last mile of data analytics here: https://t.co/TsHoh1xV73
Key points incoming as a thread! 🚚📊
Excited to see Arcwise coming to life! It feels so great to work my normal spreadsheet on REAL (15m row) data. Normally would need to ping a Data Analyst to help write some SQL. https://t.co/FQBLeX5uv7
100M rows in your spreadsheet ✅
Pivots on 100M rows in your spreadsheet ✅
Visuals and reports ✅
Excited to see spreadsheets get the power they deserve. https://t.co/RhKG7jp42r
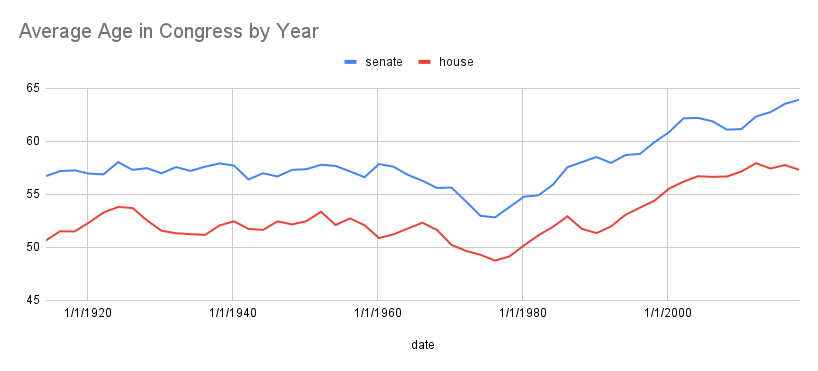
👨🦳 👵 🇺🇸 It always feels like US Congress is getting older. But did you know that in the 1970's Congress was actually trending YOUNGER?! 👶 🍼
Check out the data yourself with Arcwise in Google Sheets: https://t.co/y1kCn28OKT
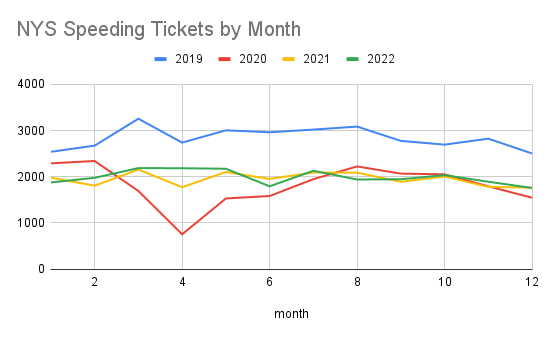
🚦🚨 New York State traffic ticket data is SUPER fun to explore. Arcwise lets you explore all 10M rows directly in your Google Sheet! Can anyone tell when the Covid 19 lockdowns started? 🤔
Check out the data yourself with Arcwise: https://t.co/XDTeQV9gKP
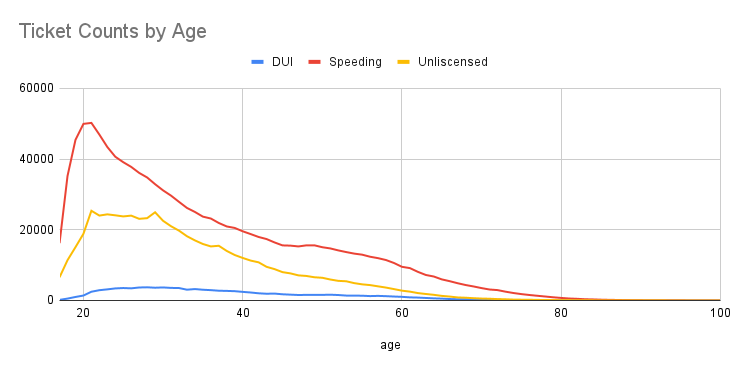
🚗 🚦 New York State traffic ticket data is 10M+ rows 📈 📊 . But you can still explore it in Google Sheets with Arcwise! Ever wonder what day of week tickets are most common?
Explore the data yourself with Arcwise: https://t.co/XDTeQV9gKP
Create a report on 15M rows in Google Sheets 📊 📈 with Arcwise. Sign up for the beta here: https://t.co/D6g5cOvO8y
Connect data with 1 click, write formulas on ✨ billions✨ of rows, and make scalable reports directly in your sheets.
https://t.co/HaElZr1LXT
Data logistics is the process of ensuring the right data is available to the right place at the right time, and in the right format.
This includes:
data creation
data integration
data transformation
data transfer
data storage
data retrieval
data governance
...to name a few.
Time for our Data Jargon decorder series 🔮
Our goal is to make all the fancy data terms you might hear as simple to understand as possible.
First up? Data logistics
Data has a supply chain just like physical goods do.
It needs to be created, transformed (sometimes) into a different state, transported, and then be available in the right format for the end user at the right time.