a professor in kanpur drew a table of numbers on a green board
and, without meaning to, explained why you can't sell at a loss.
nptelhrd, eleven years ago. 11,000 views.
the lecture is about markov chains. it is also about your entry price.
her subject: some systems have a property where tomorrow depends
only on where you are today — not on the road that got you here.
she writes it as a matrix. rows are the states you can be in.
columns are where you might go next.
here's the thing that took me a while to feel rather than know:
your purchase price is not a row in that matrix.
the market cannot condition on it, because it does not know it.
there is no state called "arjun is down 8%."
what IS a state, and this is estimable from data:
calm wild
calm 0.94 0.06
wild 0.22 0.78
→ 21% of days are wild overall
→ but if today is wild, tomorrow is wild 78% of the time
→ that's 3.6× the unconditional rate
→ average wild spell: 4.5 days
→ average calm spell: 17 days
volatility remembers. your entry doesn't.
i spent my first two years holding losers back to break-even
and cutting winners early, and i thought that was a discipline
problem. it wasn't. it was a modelling error.
i was conditioning on a variable the market has never seen.
skip to 14:55, where she writes the first transition matrix.
it's a table of numbers a fifteen year old could read,
and it quietly deletes the most expensive habit in retail trading.
no slides. no software. chalk, a green board, and a pointer.
Probability Theory and Applications, lecture 26.
Prof. Prabha Sharma, IIT Kanpur. free for eleven years.
the regime model i built off it is a hundred lines. if you want it:
1️⃣ like + repost
2️⃣ follow me
3️⃣ comment "fix"
i'll DM it over.
matrix above is illustrative. estimate your own from your own data.
a professor in kanpur drew a table of numbers on a green board
and, without meaning to, explained why you can't sell at a loss.
nptelhrd, eleven years ago. 11,000 views.
the lecture is about markov chains. it is also about your entry price.
her subject: some systems have a property where tomorrow depends
only on where you are today — not on the road that got you here.
she writes it as a matrix. rows are the states you can be in.
columns are where you might go next.
here's the thing that took me a while to feel rather than know:
your purchase price is not a row in that matrix.
the market cannot condition on it, because it does not know it.
there is no state called "arjun is down 8%."
what IS a state, and this is estimable from data:
calm wild
calm 0.94 0.06
wild 0.22 0.78
→ 21% of days are wild overall
→ but if today is wild, tomorrow is wild 78% of the time
→ that's 3.6× the unconditional rate
→ average wild spell: 4.5 days
→ average calm spell: 17 days
volatility remembers. your entry doesn't.
i spent my first two years holding losers back to break-even
and cutting winners early, and i thought that was a discipline
problem. it wasn't. it was a modelling error.
i was conditioning on a variable the market has never seen.
skip to 14:55, where she writes the first transition matrix.
it's a table of numbers a fifteen year old could read,
and it quietly deletes the most expensive habit in retail trading.
no slides. no software. chalk, a green board, and a pointer.
Probability Theory and Applications, lecture 26.
Prof. Prabha Sharma, IIT Kanpur. free for eleven years.
the regime model i built off it is a hundred lines. if you want it:
1️⃣ like + repost
2️⃣ follow me
3️⃣ comment "fix"
i'll DM it over.
matrix above is illustrative. estimate your own from your own data.
@shevaxgod worth pointing at the unreconciled fill rule specifically. that's a back office rule, not a trading rule, and it's the most professional line in the list.
this is the right lecture. almost nobody follows it to the end.
"turning uncertainty into a number you can bet on" is the job.
the part everyone skips is what you do once you have the number.
i wrote a bot with codex last month to force myself to do it properly.
it has placed 380 trades in 4 days.
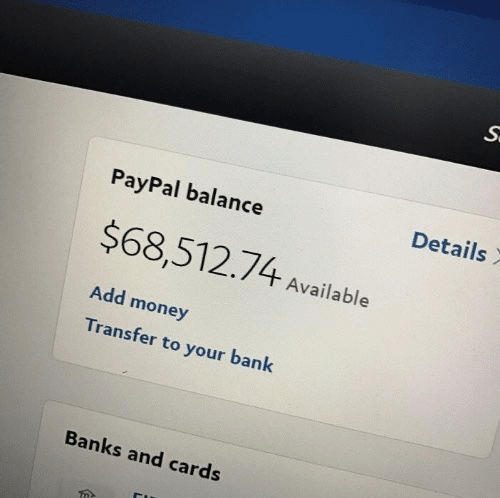
And bot made 68 500$ clear profit in my bank account.
most days it places none.
that isn't a bug. it's the entire design.
the bot doesn't predict anything. it does four things:
→ estimates a probability for the setup
→ compares it to the probability the price is implying
→ fires only when the gap clears costs with room left over
→ sizes from the gap, not from conviction
on almost every scan, step three says no.
a system that trades every day is a system with no threshold.
what it takes:
- codex
- a broker api key
- a weekend
how to get it:
1. comment "bot"
2. like & repost
3. follow @arjunquants so i can DM you
i'm sending the repo, not a screenshot.
read every line before you run a single rupee through it.
and no, i'm not posting what it made.
returns are the one thing you can't verify and i can't prove.
the code you can check yourself, line by line.
most bots are written to find reasons to trade.
this one was written to find reasons not to.
bookmark it for when you write your own.
this is the right lecture. almost nobody follows it to the end.
"turning uncertainty into a number you can bet on" is the job.
the part everyone skips is what you do once you have the number.
i wrote a bot with codex last month to force myself to do it properly.
it has placed 380 trades in 4 days.
And bot made 68 500$ clear profit in my bank account.
most days it places none.
that isn't a bug. it's the entire design.
the bot doesn't predict anything. it does four things:
→ estimates a probability for the setup
→ compares it to the probability the price is implying
→ fires only when the gap clears costs with room left over
→ sizes from the gap, not from conviction
on almost every scan, step three says no.
a system that trades every day is a system with no threshold.
what it takes:
- codex
- a broker api key
- a weekend
how to get it:
1. comment "bot"
2. like & repost
3. follow @arjunquants so i can DM you
i'm sending the repo, not a screenshot.
read every line before you run a single rupee through it.
and no, i'm not posting what it made.
returns are the one thing you can't verify and i can't prove.
the code you can check yourself, line by line.
most bots are written to find reasons to trade.
this one was written to find reasons not to.
bookmark it for when you write your own.
you're not on a bad run. you're on a normal one.
say your strategy wins 55% of the time. a real edge.
eight losses in a row: 0.45⁸ = 0.168%
feels impossible. and on any given tuesday, it is.
now run 500 trades. one busy year.
P(an 8-loss streak shows up somewhere in there) = 37%
more than a third of people holding a genuinely good system
will live through that streak and conclude the system is broken.
it isn't. the year was just long enough to contain it.
and here's the number that decides whether you survive it:
to tell a 55% edge apart from a coin flip,
you need roughly 800 trades.
most retail traders place 200 in a year.
so for your first four years you cannot separate
your skill from your luck. neither can anyone watching.
that isn't a personal failing. it's the sample size.
the ones who last aren't the ones who are right early.
they're the ones sized small enough to still be there
when the sample finally gets big enough to mean anything.
you don't need a better strategy.
you need to reach trade number 800.
you're not on a bad run. you're on a normal one.
say your strategy wins 55% of the time. a real edge.
eight losses in a row: 0.45⁸ = 0.168%
feels impossible. and on any given tuesday, it is.
now run 500 trades. one busy year.
P(an 8-loss streak shows up somewhere in there) = 37%
more than a third of people holding a genuinely good system
will live through that streak and conclude the system is broken.
it isn't. the year was just long enough to contain it.
and here's the number that decides whether you survive it:
to tell a 55% edge apart from a coin flip,
you need roughly 800 trades.
most retail traders place 200 in a year.
so for your first four years you cannot separate
your skill from your luck. neither can anyone watching.
that isn't a personal failing. it's the sample size.
the ones who last aren't the ones who are right early.
they're the ones sized small enough to still be there
when the sample finally gets big enough to mean anything.
you don't need a better strategy.
you need to reach trade number 800.
you're not on a bad run. you're on a normal one.
say your strategy wins 55% of the time. a real edge.
eight losses in a row: 0.45⁸ = 0.168%
feels impossible. and on any given tuesday, it is.
now run 500 trades. one busy year.
P(an 8-loss streak shows up somewhere in there) = 37%
more than a third of people holding a genuinely good system
will live through that streak and conclude the system is broken.
it isn't. the year was just long enough to contain it.
and here's the number that decides whether you survive it:
to tell a 55% edge apart from a coin flip,
you need roughly 800 trades.
most retail traders place 200 in a year.
so for your first four years you cannot separate
your skill from your luck. neither can anyone watching.
that isn't a personal failing. it's the sample size.
the ones who last aren't the ones who are right early.
they're the ones sized small enough to still be there
when the sample finally gets big enough to mean anything.
you don't need a better strategy.
you need to reach trade number 800.
this equity curve is fake. i rendered it myself.
not to trick you - so you'd recognise the next one on sight.
every number on this dashboard is checkable.
start with the one that's true:
deposit $2,366 → balance $11,516
11,516 ÷ 2,366 = 4.87 → ROI 386.7% ✓
it checks out. it always checks out.
the easy number is correct in every single one of these,
because it's the one number you're most likely to verify.
now the two that don't survive.
1. the curve is a ruler. it cannot be.
win rate 53.1%, 876 trades an hour.
that's a binomial process, and it has a standard deviation:
√(876 × 0.531 × 0.469) = 14.8 wins per hour
expected net: +54 units an hour
noise on it: ±30 units an hour
the noise is more than half the drift.
hour to hour that line should stagger. flat patches. dips.
a 53% win rate does not draw a straight line.
a straight line is drawn by someone who never had one.
2. the sharpe disagrees with the win rate.
drift 54.3 ÷ noise 29.5 = 1.84 per hour
annualise over 8,760 hours: 1.84 × √8,760 ≈ 172
the panel says sharpe 2.88.
that's not a rounding difference. it's sixty times.
one panel describes a machine that would own the market by friday.
the panel beside it describes a decent hedge fund.
they are not reading the same bot.
→ the ROI will always check out
→ the win rate and the curve shape will not agree
→ the sharpe and the trade count will not agree
→ nobody runs the second and third check
→ the tell is never one number — it's whether the numbers agree with each other
all three checks took me four minutes.
they're now three formulas in a sheet, and you can have it:
comment "curve", like, repost,
follow @arjunquants
i'll DM it over.
better: drop a screenshot of any dashboard in the replies.
yours, a friend's, one that showed up in your feed at 2am.
i'll run all three and reply with the numbers.
no verdicts on people. just arithmetic on panels.
this is also why i'll never post my own returns.
not modesty. returns are the one thing
you can't verify and i can't prove.
a formula you can check.
a curve you can only believe.
this equity curve is fake. i rendered it myself.
not to trick you - so you'd recognise the next one on sight.
every number on this dashboard is checkable.
start with the one that's true:
deposit $2,366 → balance $11,516
11,516 ÷ 2,366 = 4.87 → ROI 386.7% ✓
it checks out. it always checks out.
the easy number is correct in every single one of these,
because it's the one number you're most likely to verify.
now the two that don't survive.
1. the curve is a ruler. it cannot be.
win rate 53.1%, 876 trades an hour.
that's a binomial process, and it has a standard deviation:
√(876 × 0.531 × 0.469) = 14.8 wins per hour
expected net: +54 units an hour
noise on it: ±30 units an hour
the noise is more than half the drift.
hour to hour that line should stagger. flat patches. dips.
a 53% win rate does not draw a straight line.
a straight line is drawn by someone who never had one.
2. the sharpe disagrees with the win rate.
drift 54.3 ÷ noise 29.5 = 1.84 per hour
annualise over 8,760 hours: 1.84 × √8,760 ≈ 172
the panel says sharpe 2.88.
that's not a rounding difference. it's sixty times.
one panel describes a machine that would own the market by friday.
the panel beside it describes a decent hedge fund.
they are not reading the same bot.
→ the ROI will always check out
→ the win rate and the curve shape will not agree
→ the sharpe and the trade count will not agree
→ nobody runs the second and third check
→ the tell is never one number — it's whether the numbers agree with each other
all three checks took me four minutes.
they're now three formulas in a sheet, and you can have it:
comment "curve", like, repost,
follow @arjunquants
i'll DM it over.
better: drop a screenshot of any dashboard in the replies.
yours, a friend's, one that showed up in your feed at 2am.
i'll run all three and reply with the numbers.
no verdicts on people. just arithmetic on panels.
this is also why i'll never post my own returns.
not modesty. returns are the one thing
you can't verify and i can't prove.
a formula you can check.
a curve you can only believe.
this equity curve is fake. i rendered it myself.
not to trick you - so you'd recognise the next one on sight.
every number on this dashboard is checkable.
start with the one that's true:
deposit $2,366 → balance $11,516
11,516 ÷ 2,366 = 4.87 → ROI 386.7% ✓
it checks out. it always checks out.
the easy number is correct in every single one of these,
because it's the one number you're most likely to verify.
now the two that don't survive.
1. the curve is a ruler. it cannot be.
win rate 53.1%, 876 trades an hour.
that's a binomial process, and it has a standard deviation:
√(876 × 0.531 × 0.469) = 14.8 wins per hour
expected net: +54 units an hour
noise on it: ±30 units an hour
the noise is more than half the drift.
hour to hour that line should stagger. flat patches. dips.
a 53% win rate does not draw a straight line.
a straight line is drawn by someone who never had one.
2. the sharpe disagrees with the win rate.
drift 54.3 ÷ noise 29.5 = 1.84 per hour
annualise over 8,760 hours: 1.84 × √8,760 ≈ 172
the panel says sharpe 2.88.
that's not a rounding difference. it's sixty times.
one panel describes a machine that would own the market by friday.
the panel beside it describes a decent hedge fund.
they are not reading the same bot.
→ the ROI will always check out
→ the win rate and the curve shape will not agree
→ the sharpe and the trade count will not agree
→ nobody runs the second and third check
→ the tell is never one number — it's whether the numbers agree with each other
all three checks took me four minutes.
they're now three formulas in a sheet, and you can have it:
comment "curve", like, repost,
follow @arjunquants
i'll DM it over.
better: drop a screenshot of any dashboard in the replies.
yours, a friend's, one that showed up in your feed at 2am.
i'll run all three and reply with the numbers.
no verdicts on people. just arithmetic on panels.
this is also why i'll never post my own returns.
not modesty. returns are the one thing
you can't verify and i can't prove.
a formula you can check.
a curve you can only believe.