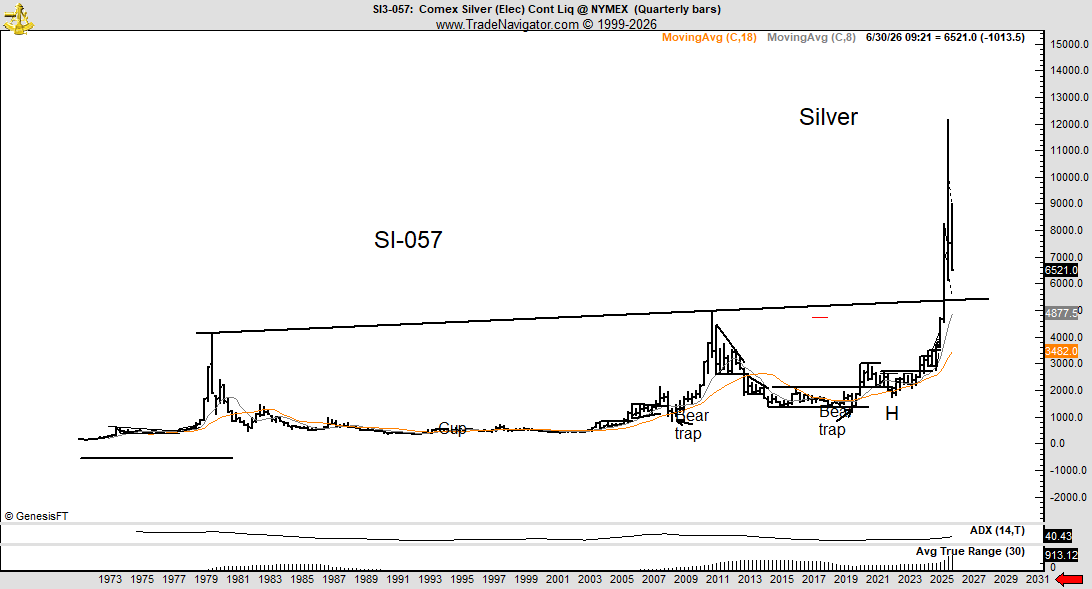
Major support in Silver comes in at $54
Here is how the dynamics of price behavior works:
Late comer bulls who bought >$90 missed the top and have sworn to themselves that they will never sell out
In fact, they have stated their intent to buy more at $65 and more at $60
They will mark the bottom by puking out their positions below $60 swearing to never trade Silver again
This is how bottoms are made every time in every market be it Silver or Bitcoin or Soybeans or Sugar or the S&Ps
$SI_F #silver
As a general rule, periods of uncertainty on a chart are resolved in the direction of the trend on the next larger time frame for market in question.
E.G. Periods of confusion on daily chart are resolved in direction of trend on weekly chart, and so on
FRIDAY CLOSING LOSS RULE
My trading policy is to liquidate any trade that shows a loss on a Friday for two reasons
1. Enjoy a weekend without sweating a loser
2. Friday losses often get worse the following week
Rules rule
@BigSkyHODL I trade futures markets, not equities. I am a swing trader. No desire to pick tops or bottoms. My niche is catching chunks in the middle of a trend. I trade set ups, not fundamentals, not narratives.
$BTC is in a daily bear flag. Price is rising. OI is rising. Volume is declining.
Most people see the green candles and get excited.
Here's what the data is actually telling you 👇
📈 Rising price inside a flag = relief rally.
This is not a reversal. It's a retracement. Price is simply filling liquidity overhead before the next move.
The flag is the trap.
📊 Rising OI alongside price = fresh longs being opened into the bounce.
But who's taking the other side of those trades?
In a bear flag context, smart money is shorting into the retail FOMO.
The OI build isn't confirming the move. It's loading the trap.
📉 Declining volume = no conviction behind the buyers.
A real reversal needs expanding volume to show genuine absorption of supply.
A low-participation grind up is exactly what bear flags look like internally.
So what's the probable macro move?
↗️ Price squeezes into the LIQ zone (50-61.8% fib) to grab liquidity
📌 OI spikes → maximum long exposure
🔻 Volume fails to confirm
💥 Flag breaks down → measured move targets previous lows
The ONE thing that invalidates this:
A high-volume daily close above the 61.8% fib with OI holding and volume expanding.
That would signal real absorption, not distribution.
Until then, the weight of evidence favours continuation.
Watch how price REACTS to resistance. Not just whether it touches it.
The reaction tells you everything.
I posted about this level 5 weeks ago. All I've been doing since is waiting for price to get here.
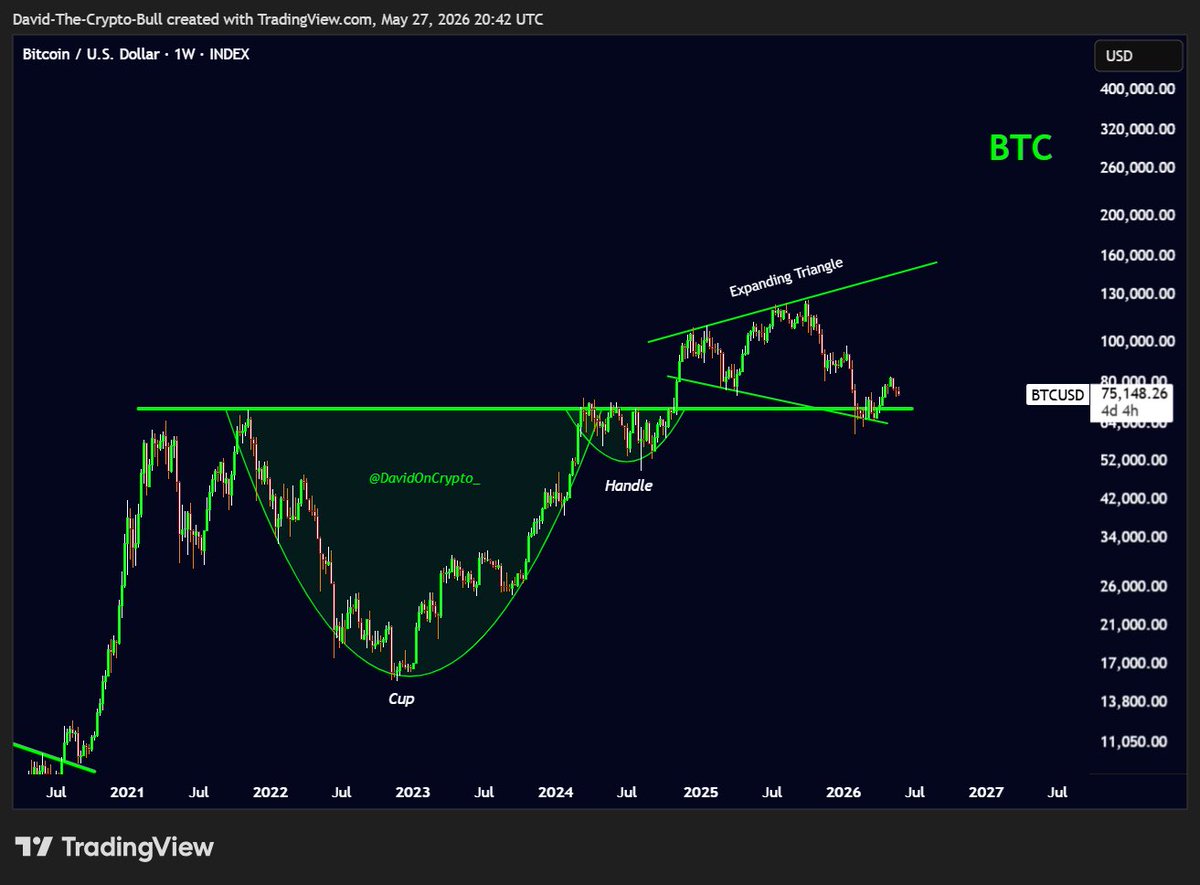
#Bitcoin testing the lower boundary of the bullish expanding triangle for the second time on the weekly. This is a major S/R level, not where to turn bearish (again).
Weekly close in 3d 14h.
Crazy how Bitcoin has spent the entire period since November 2024 carving out this expanding triangle. (Some call it a megaphone pattern.) And as said before, the full resolution of this pattern points to my macro target 🎯 of $300k+.
Conviction isn’t tested when everyone agrees with you. It’s tested when they think you’re crazy.
🚨 RUMOR:
Institutions are pushing Bitcoin lower so they can buy at cheaper prices before the Clarity Act is SIGNED INTO LAW.
We’ve seen a similar pattern before.
In August 2022, BlackRock filed for a private Bitcoin trust, and Bitcoin later dropped about -36% before forming a bottom.
In June 2023, BlackRock filed for the first spot Bitcoin ETF, and Bitcoin later surged by 95%.
By January 2024, when spot ETFs were approved, Bitcoin hits a new highs of $126k
Insider institutions are repeating the same strategy with the Clarity Act narrative.
$BTC weekly
This is not the time to tune out, it is time to lock in.
2 weeks ago we looked at the possibility of a retest of the Hull Moving Average and today we got it.
Every one of these retests felt like death, but historically, this is the time to build your stack.
GOLD JUST PAUSED. BITCOIN IS STANDING AT THE HANDOFF POINT.
And this is where cycles change.
Gold absorbs fear.
Stabilizes at the top.
Liquidity searches for higher returns.
Then Bitcoin responds.
Every. Single. Cycle.
Gold completed the breakout.
Now it's pausing.
From protection to growth. From safety to Bitcoin.
This is the transition zone.
Where narratives change quietly before price does.
The rotation is coming.
By the time everyone sees it…
It's already too late.
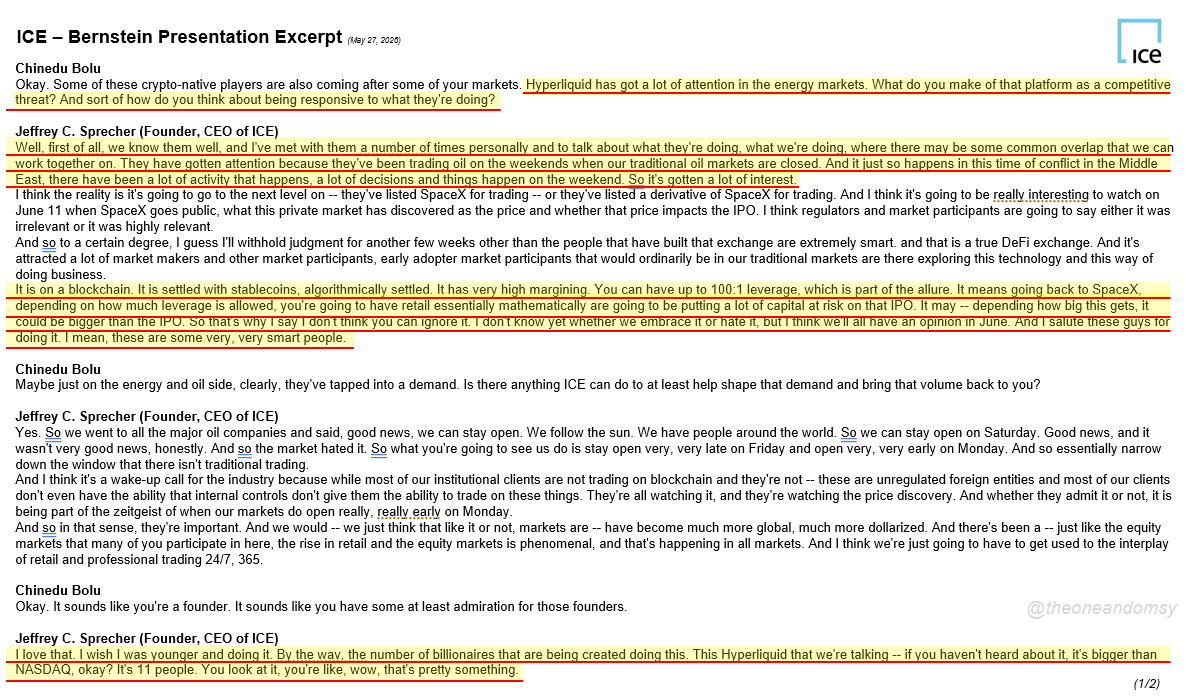
Jeff Sprecher, founder and CEO of $ICE (owns the NYSE) on Hyperliquid:
"This Hyperliquid that we're talking -- if you haven't heard about it, it's bigger than NASDAQ, okay? It's 11 people. You look at it, you're like, wow, that's pretty something."
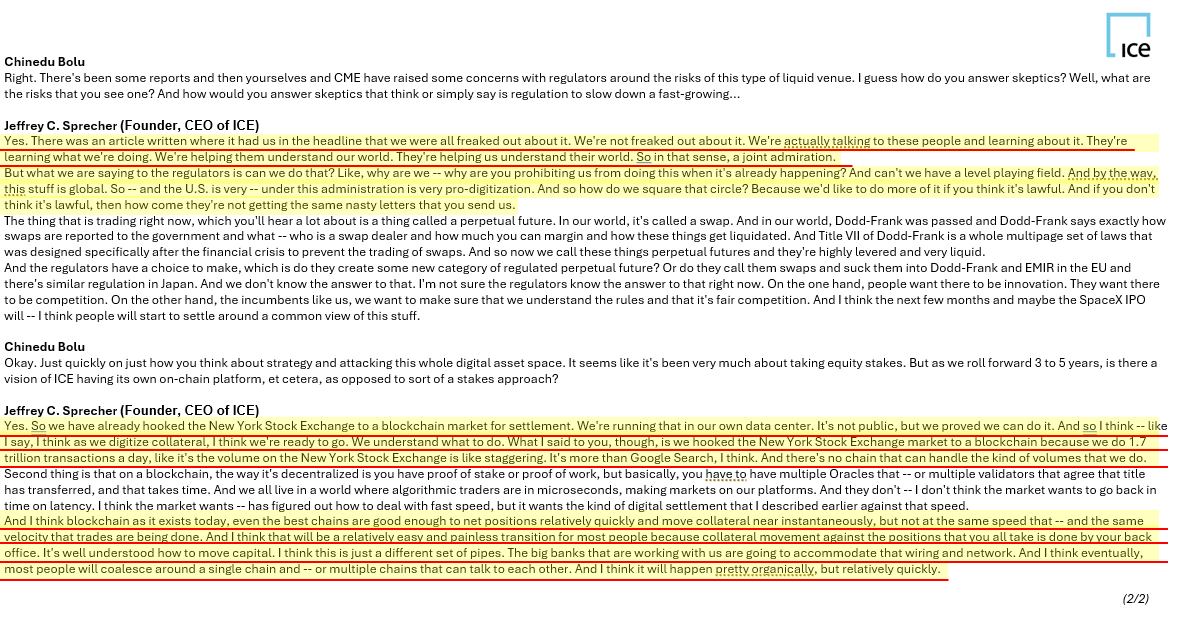
If it wasn't clear before, hyperliquid:native has grown far beyond crypto. The incumbents have noticed, are paying close attention, and even spending time with the team
Bernstein excerpt below and worth the read imo:
#Bitcoin: While we still have the HTF C&H targeting $300K+ even after the throwback to the 2021 highs, the October to February correction also shaped the entire price action we’ve seen since November 2024 into an expanding triangle, with the full resolution of the pattern aligning with my $300K+ macro target.
And like I said back in February: “Based on traditional technical patterns, which continue to work regardless of the market era, Bitcoin should see $300K+ before a bear market.”
My stance on October 2025 to February 2026 being a mid-cycle correction remains unchanged.
NOBODY IS TALKING ABOUT WHAT GOOGLE JUST PREDICTED FOR BITCOIN.
And it changes everything.
Google:
Broke 2021 highs. DONE.
Retested breakout zone. DONE.
Entered expansion phase. DONE.
Bitcoin:
Broke 2021 highs. DONE.
Retested breakout zone. DONE.
Bounce happening right now. DONE.
One cycle behind.
Same structure. Same setup. Same result incoming.
When Google completed this pattern…
Nobody was ready for what followed.
Bitcoin is next.
Are you positioned?
THE CHART ALREADY KNOWS WHERE BITCOIN IS GOING.
And it's not $100K.
It's not $200K.
It's not even $300K.
$600,000.
The structure has been building toward this the entire time.
The chart doesn't lie.
The chart doesn't have emotions.
The chart doesn't care if you believe it.
It just prints the next target.
$600,000.
Laugh now.
Bookmark this later.
I'M SORRY BUT BITCOIN JUST COMPLETED A PATTERN THAT TAKES YEARS TO BUILD.
And almost nobody noticed.
Multi-year Cup and Handle. Complete.
Breakout. DONE.
Perfect retest. DONE.
Structure confirmed. DONE.
Cup and Handle breakouts don't move 20%.
They move hundreds of percent.
The retest just finished.
The launch is next.
$220K is the minimum target.
Most people will only find out after it happens.
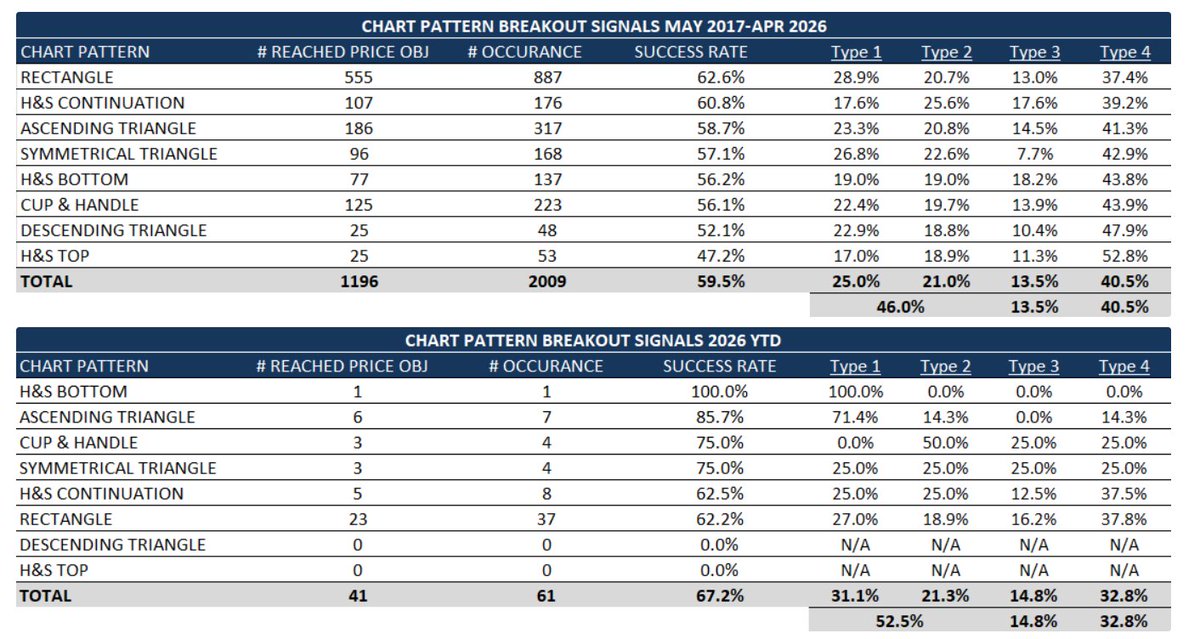
Past 9 years, I focused on "old school" classical chart patterns. 8 classical chart pattern.
These can easily be reduced to 2-3 favorite setups and successfully traded across different assets and time frames.
#Gold is down 2.2% today and continues to look weak. As I posted yesterday, I now favour a move down to $4380 more than the push up to $5000.
If it does tag $4380 that would be a day trade level for me BUT not a swing trade as ultimately I still think this goes lower.
I think over the next few months gold will drop to at least $3915 and I still think $3430 is quite possible.
$GLD $GLL $GDX #metals