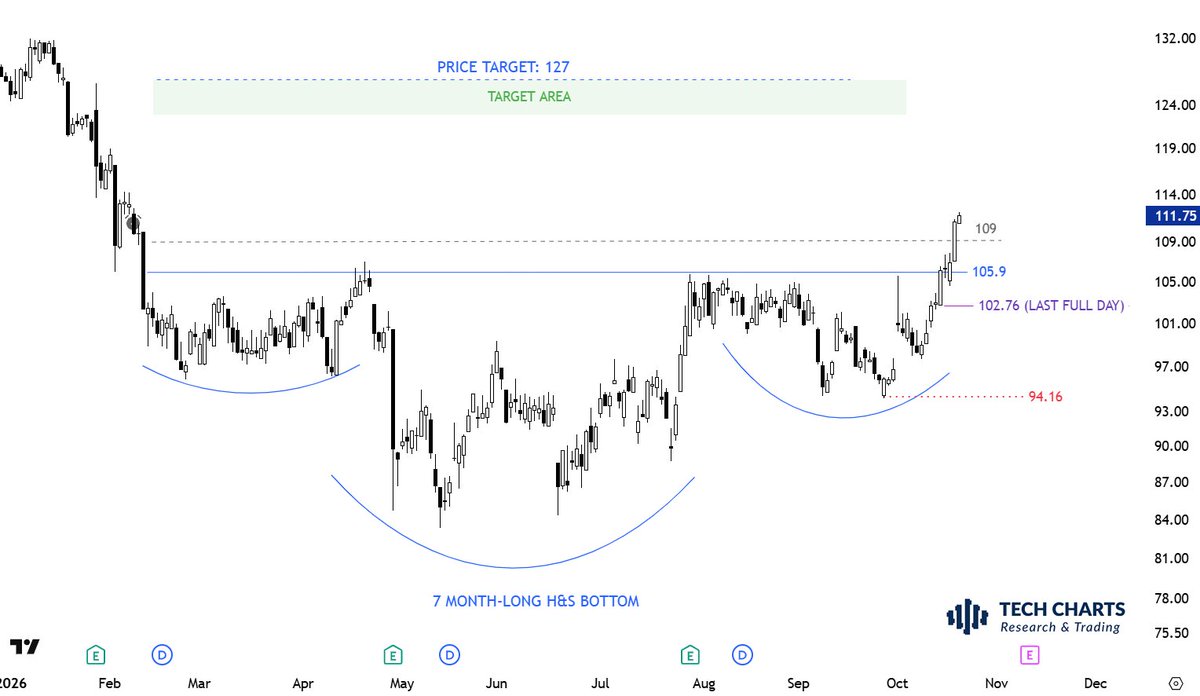
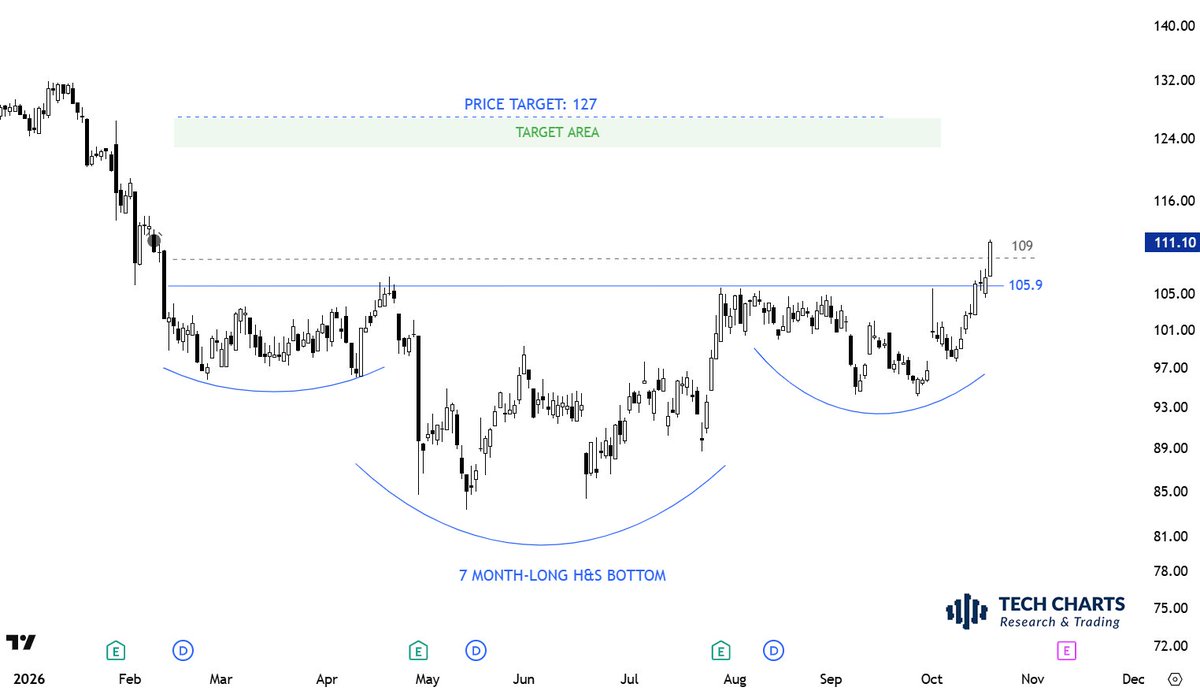
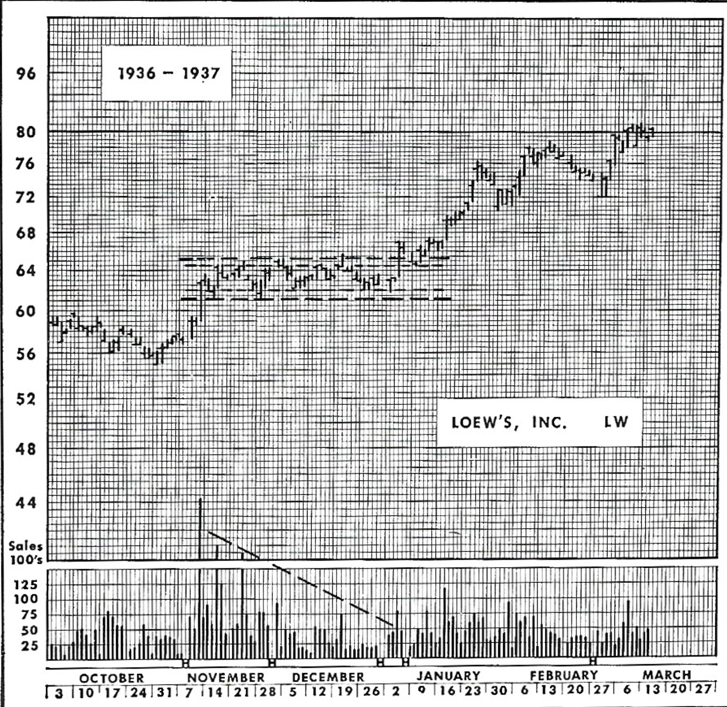
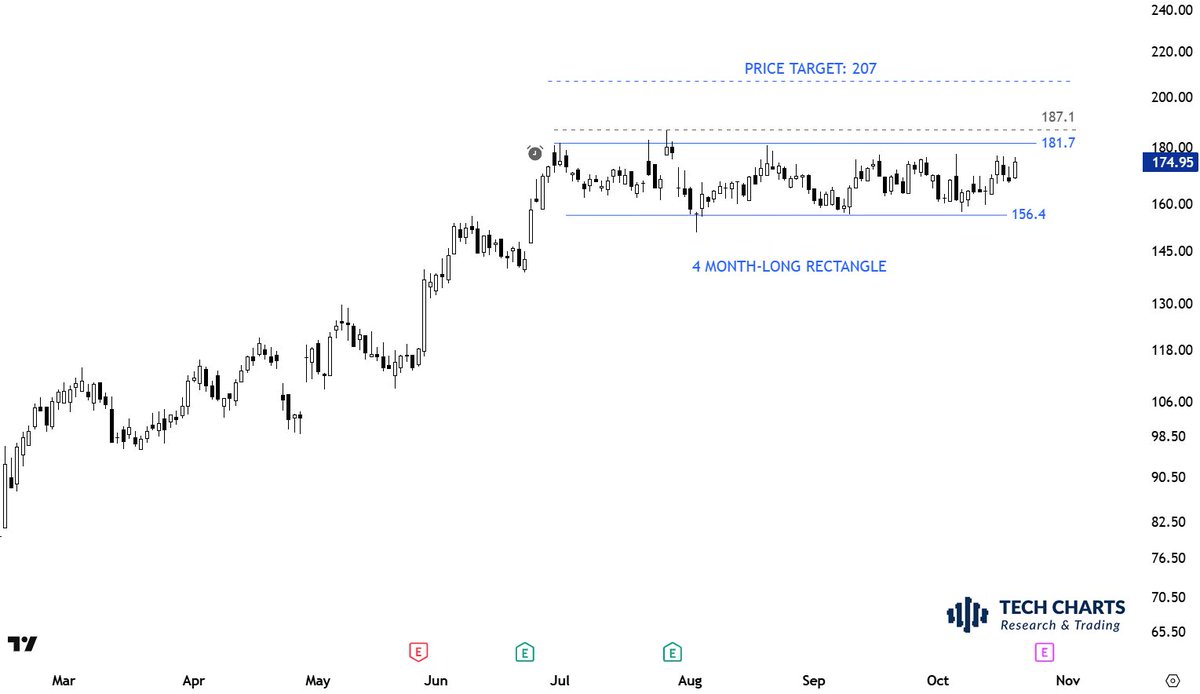
#TECHCHARTSMEMBERS This H&S continuation was covered under the #watchlist. Getting ready for a breakout. On my radar.
Access >> https://t.co/d7BDenMcJf
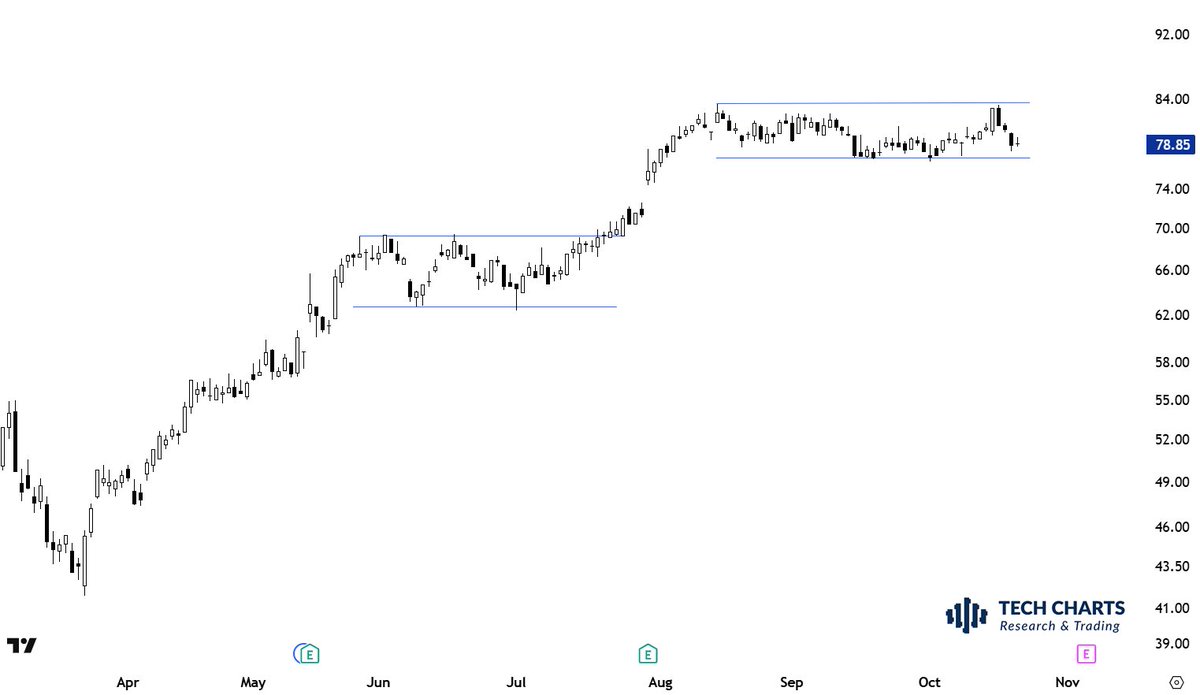
Several tests of a pattern boundary usually indicate that the level is recognized by market participants. You want to act on a breakout that will change the supply/demand balance. Not a random line.
I covered this #rectangle setup in the latest report
#TECHCHARTSMEMBERS
Access >> https://t.co/Dj4DVjckOg
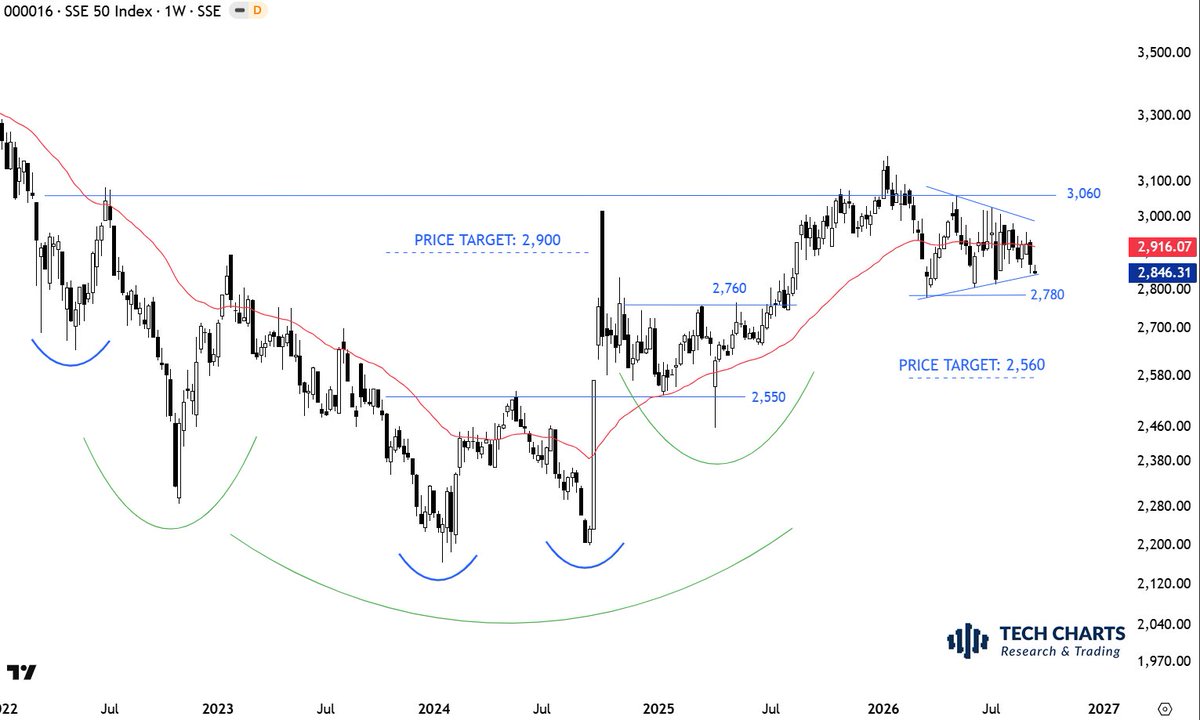
The symmetrical triangle (coil) on #CHINA#SSE50 is on my radar. If it completes below the year-long average, it can result in a sharp correction towards 2,560 levels.
This is how Edwards & Magee labelled an ascending triangle as a bottom reversal. In fact the ascending triangle later on became part of a larger scale bottom reversal, H&S.
The chart on the left was a breakout alert. #ascendingtriangle can form as a bottom reversal. It is a bullish chart pattern.
The chart on the right is a setup I'm considering for the upcoming #watchlist.
I might send out an #INTERIM#UPDATE before the week finalized.
Stay tuned >> https://t.co/V1T7ssPR2B
I'm excited to find more setups like these and bring them to your attention. These are my bread and butter setups.
More with the upcoming report. Stay tuned >> https://t.co/xNhByOrUN4
26 years ago, when I was starting with charting/trading and investments if someone gave me this advice, I would thank him/her every single day:
Print this chart. Put it on your desk.
Expand your research/investment universe.
Look for only 1 setup. The setup that is on this chart.
Go and look for this setup, if possible, across 2000 charts.
All your trades will be executed through this basic chart pattern setup.
When you revisit the charts you will be able to identify the setup you traded again and again.
You can thank me later. Don't forget to print it.
Chart of The Day: Russell 2000 Retakes Key Support Level
“ $RUT exactly the type of price action bulls need. A quick recovery above the year-long average. Horizontal support at 2,750 is intact.” @TechCharts
Possible developing #theme in #financials. I will feature some good looking setups in the upcoming report. In summary, the consolidations look more like continuation chart patterns in uptrends.
More >> https://t.co/xNhByOrUN4