The full top 10, the two sub-.510 teams in it, and what the rating deliberately leaves out: injuries, schedule strength and roster continuity.
https://t.co/6XiwmrFhUu
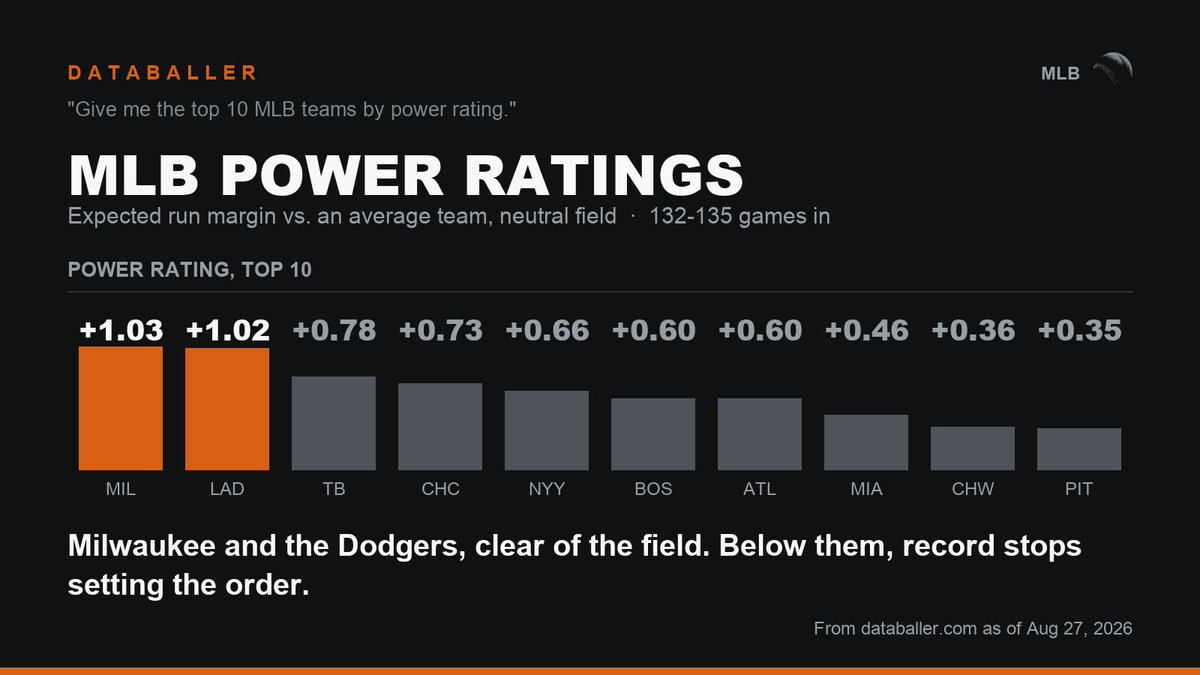
"Give me the top 10 MLB teams by power rating."
Milwaukee (+1.03) and the Dodgers (+1.02), in a tier of their own on DataBaller's power rating. Below them it stops matching the standings: the Cubs rank 4th at +0.73, above an Atlanta team two games better in the win column.
Miami (68-66) and Pittsburgh (65-70) crack the top 10 too, while Philadelphia, San Diego and Arizona, all ahead of them in the standings, don't. It's a lean, not a verdict.
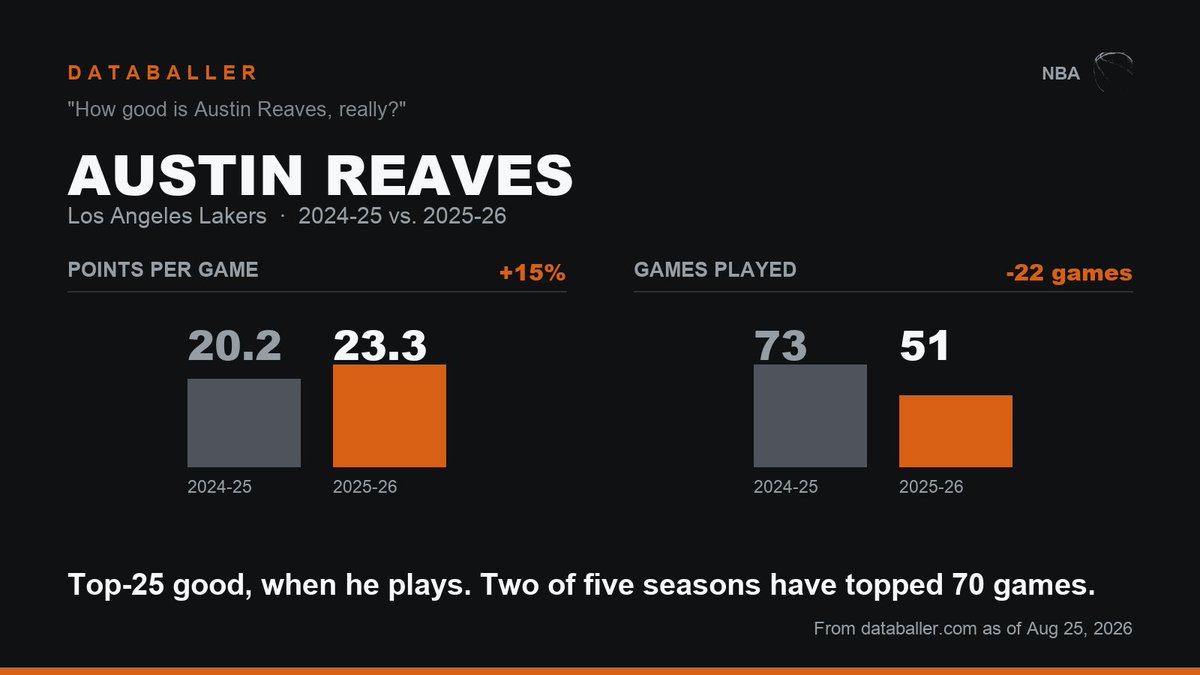
"How good is Austin Reaves, really?"
Top-25 good, with an asterisk. He averaged 23.3 points last season, 22nd in the league, and the Sustainability Score reads it as process-supported rather than a lucky stretch. He also played 51 of 82 games.
Five seasons: 61, 64, 83, 73, 51 games. The 83-game year is the outlier, not the 51. His scoring has risen every year. His availability never has.
The per-opponent splits, the schedule-adjusted pitching numbers, and where the Power Rating puts them against Milwaukee and the Dodgers are all in the story: https://t.co/jvAC2ElO9w
"Nine straight wins, so are the Phillies one of baseball's best now?"
Not yet. The bats are elite even after adjusting for the schedule: 7.11 runs a game, up from 4.22. But every opponent was .511 or below, and the full-season Power Rating still says above average, not top tier.
The pitching is the modest half: 3.33 runs allowed a game, about one run better than those lineups usually manage. Seattle, Arizona and Atlanta are the next test.
Also in there: where he actually lands in the top five, and why a .174 BABIP over his last 8 starts says the hottest part of this run is borrowed.
https://t.co/YOyvZlEVRV
"Cease nearly threw another no-hitter. Is he the most dominant starter in baseball?"
No, and the walks are why. He misses bats like Jacob Misiorowski does, 13.03 per nine to 13.41. He walks nearly twice as many hitters, 3.99 to 2.05.
Saturday's near-no-hitter came with 5 walks in 6.2 innings. Even in his best start of the season, the thing between him and the top of the list was still there.
Also in there: the 0-for-12 against Tampa Bay that dragged the number down, and why the model's own confidence grade says to read the direction rather than the score.
https://t.co/SfO4jEIBkl
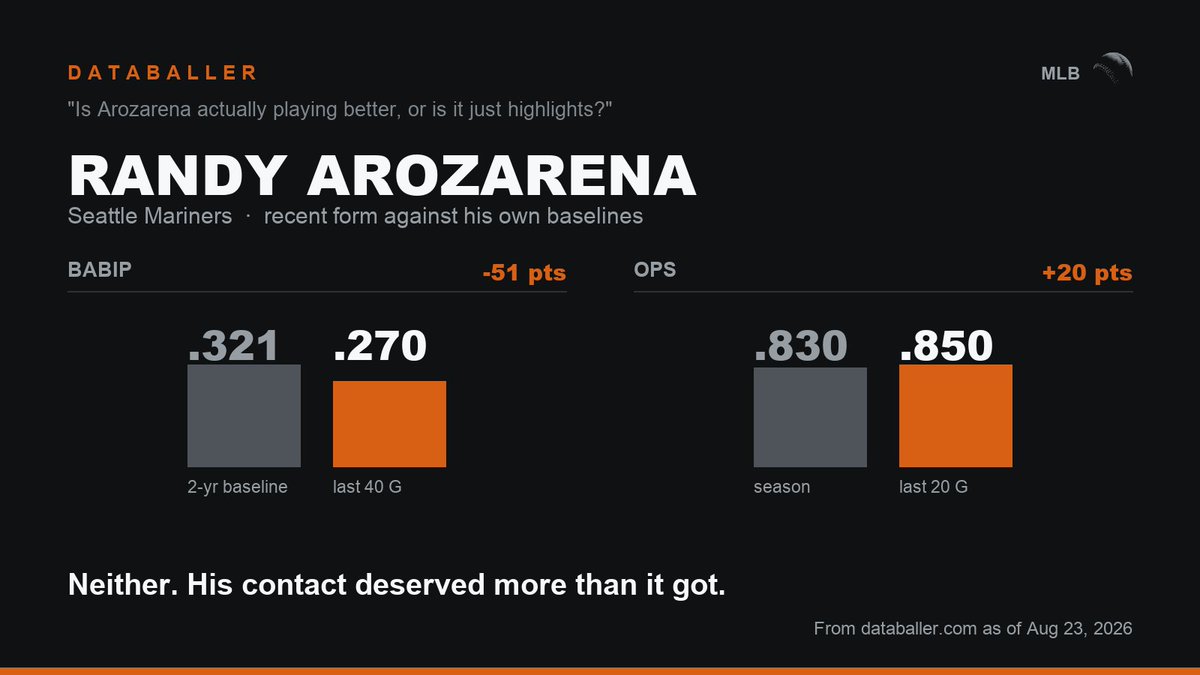
"Is Arozarena actually playing better, or is it just highlights?"
Neither. He has been playing worse than his contact deserved. His BABIP is .270 against a .321 baseline, five or six hits short. The Cubs games are that gap closing.
What held his line up in the meantime was power: 6 home runs in 20 games, which is why the OPS reads .850 while the luck reads worse.
Jumped in and gave it our web address. Looks like it picked up an old description of the domain that was a placeholder for a very different business model (we used to do customer engagement tech, now we do sport analytics), so not giving us the right leads that way.
Also, my 2 cents, the stuff below the fold on the home page where you list out "Learns what you sell, Figures out who buys it, etc." I saw too late because I just jumped in with my domain. And the UI is very slick but not intuitive. I would love to have seen those 6 or 7 things listed act as way-finding/on-boarding guides as the app was walking through each of those steps.
One last thing, looks like your target is B2B, maybe? Would be good to lock in on that angle up front.
Anyway- good luck! Let me know if I should try again and it will pick up the proper business model.
Our content strategy here on X is still very much a work in progress. Trying to find that sweet spot where the content is informative and valuable in its own right, and that also encourages folks to check out DataBaller and the great features we have on the web app. We'll get there.
@LegionHoops@BannedMacMahon Don't need an insider to tell you teams are monitoring the situation with Jokic and Wemby too. That's what team executives do.
Spencer Jones's Power Surge Is Real, but the Role Change Is Half the Story
Jones has posted a .772 OPS and .246 ISO over his last 20 games, but a jump from 2.4 to 3.45 at-bats per game explains much of the counting-stat rise. The power is genuine; the sustainability question stays open.
https://t.co/4beTmr4Aag