$MU's business is surging. At about $930, the stock is asking a harder question: can AI demand and multi-year customer agreements make roughly $98 of normalized EPS durable by fiscal 2030? https://t.co/FqeY8afVte
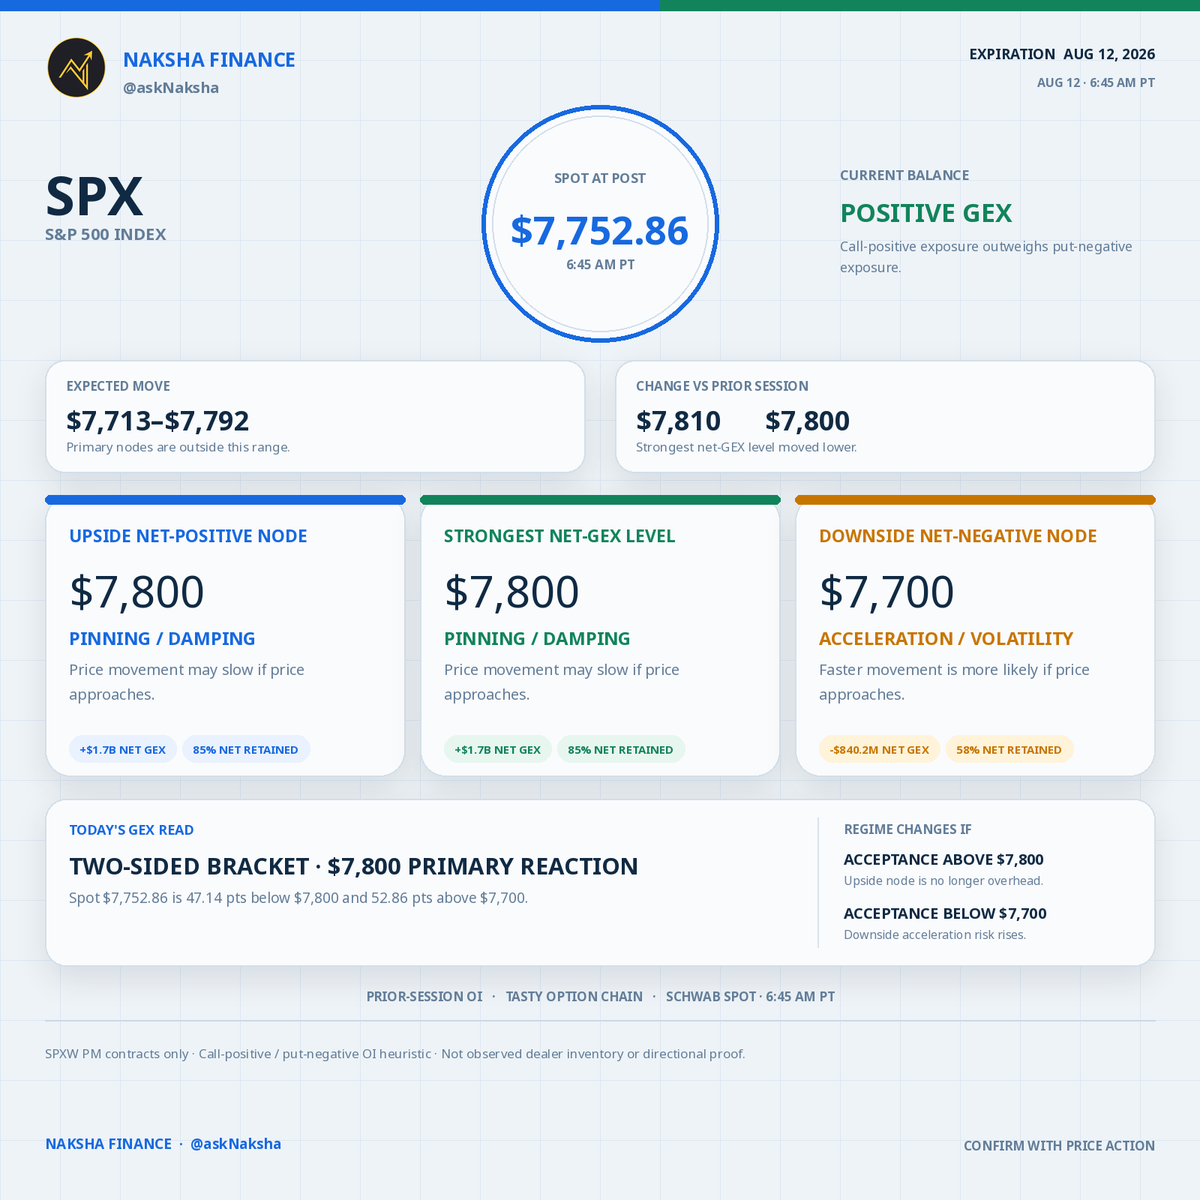
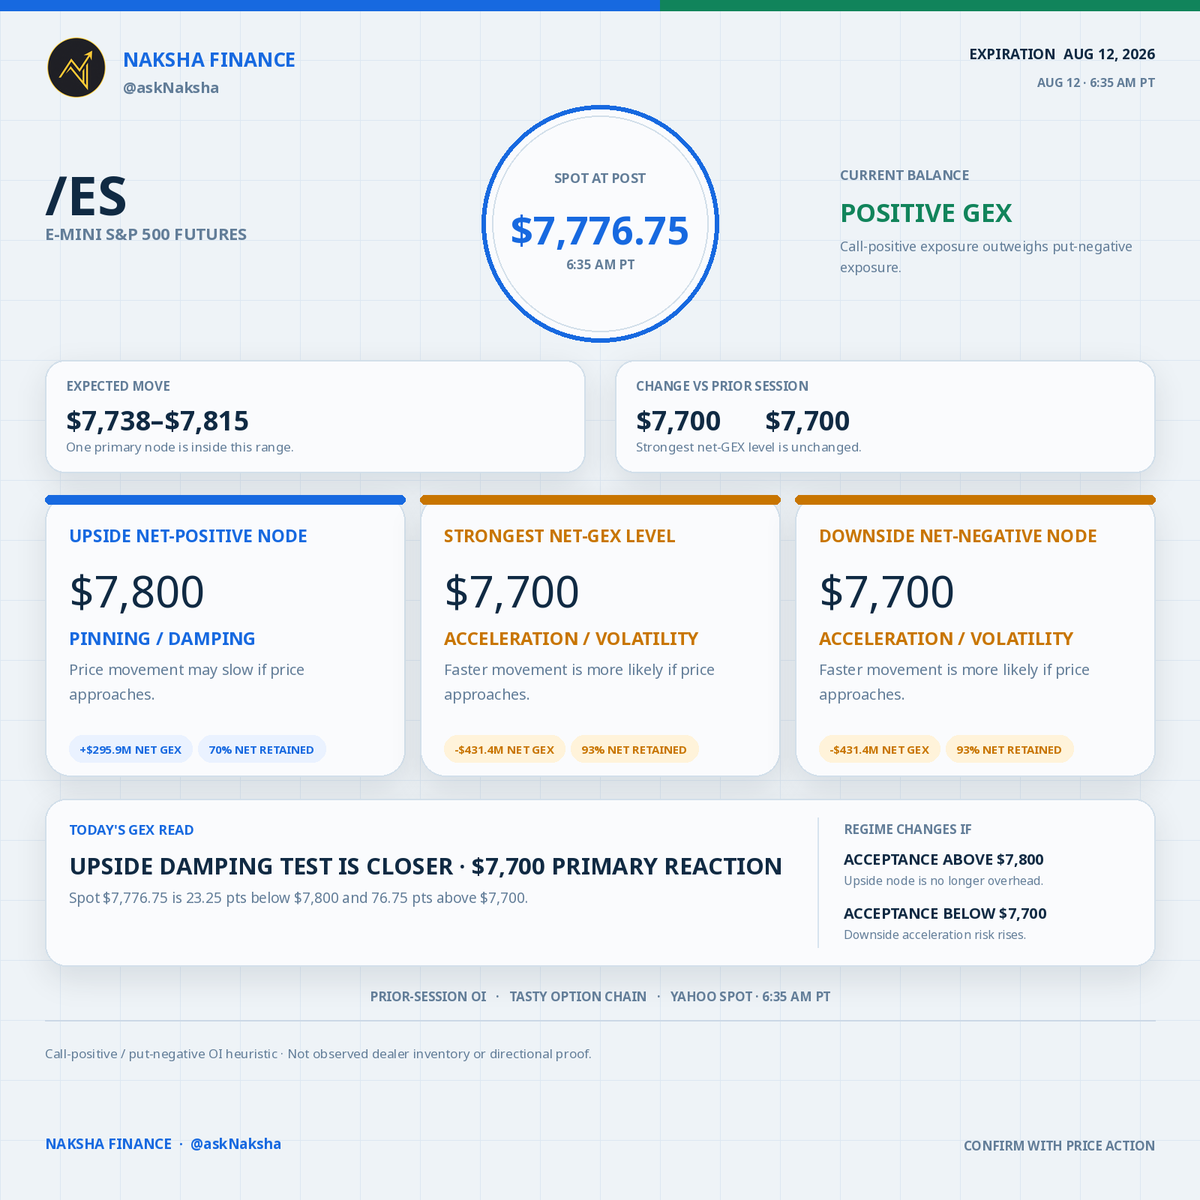
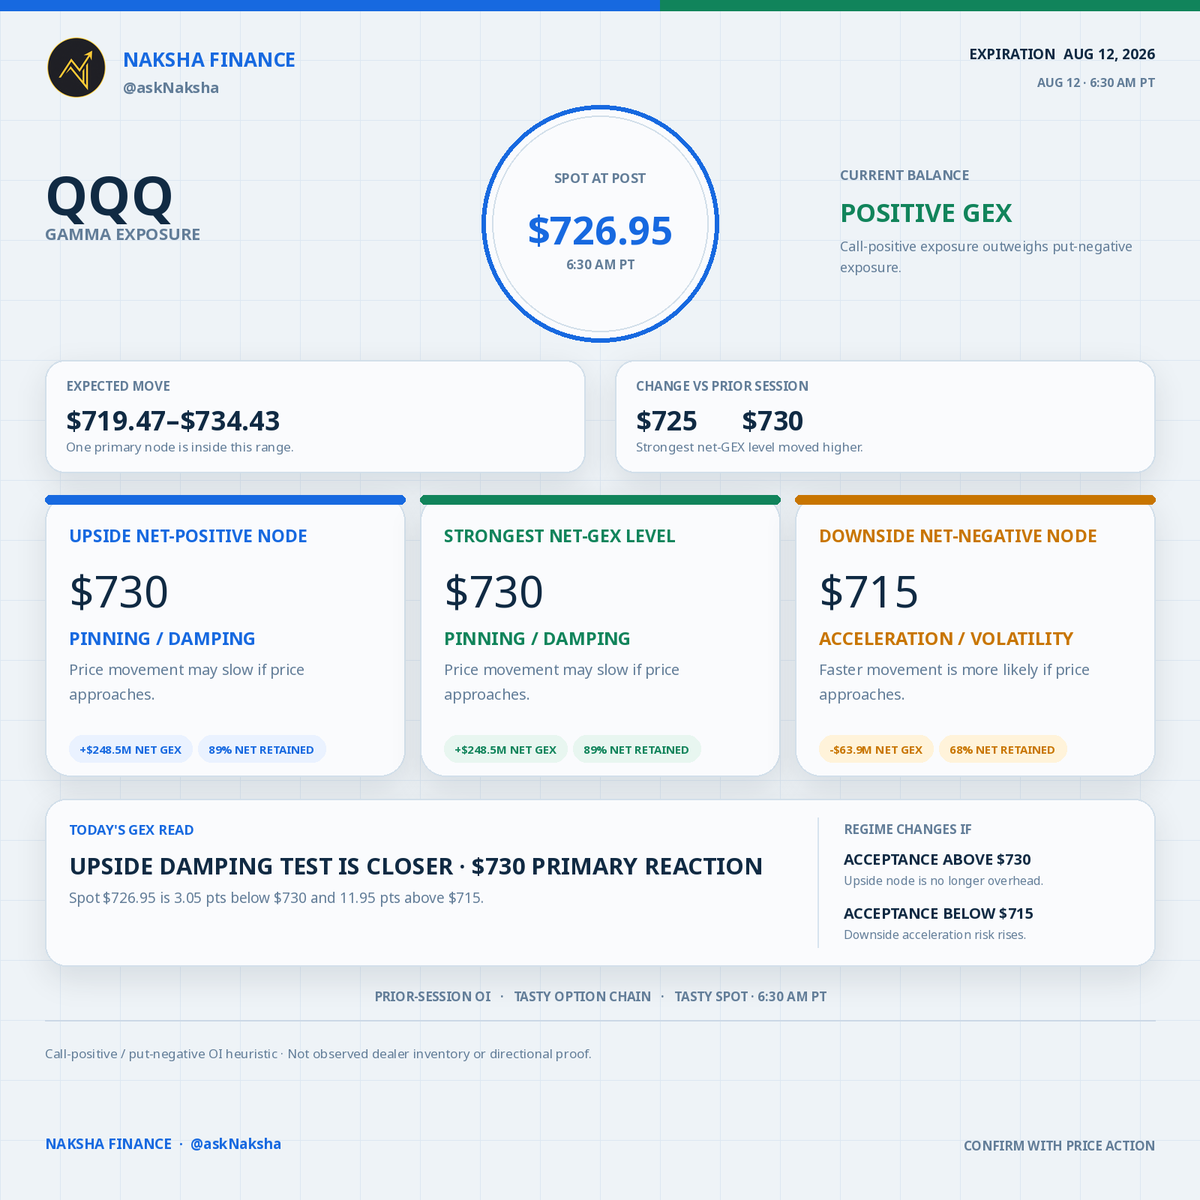
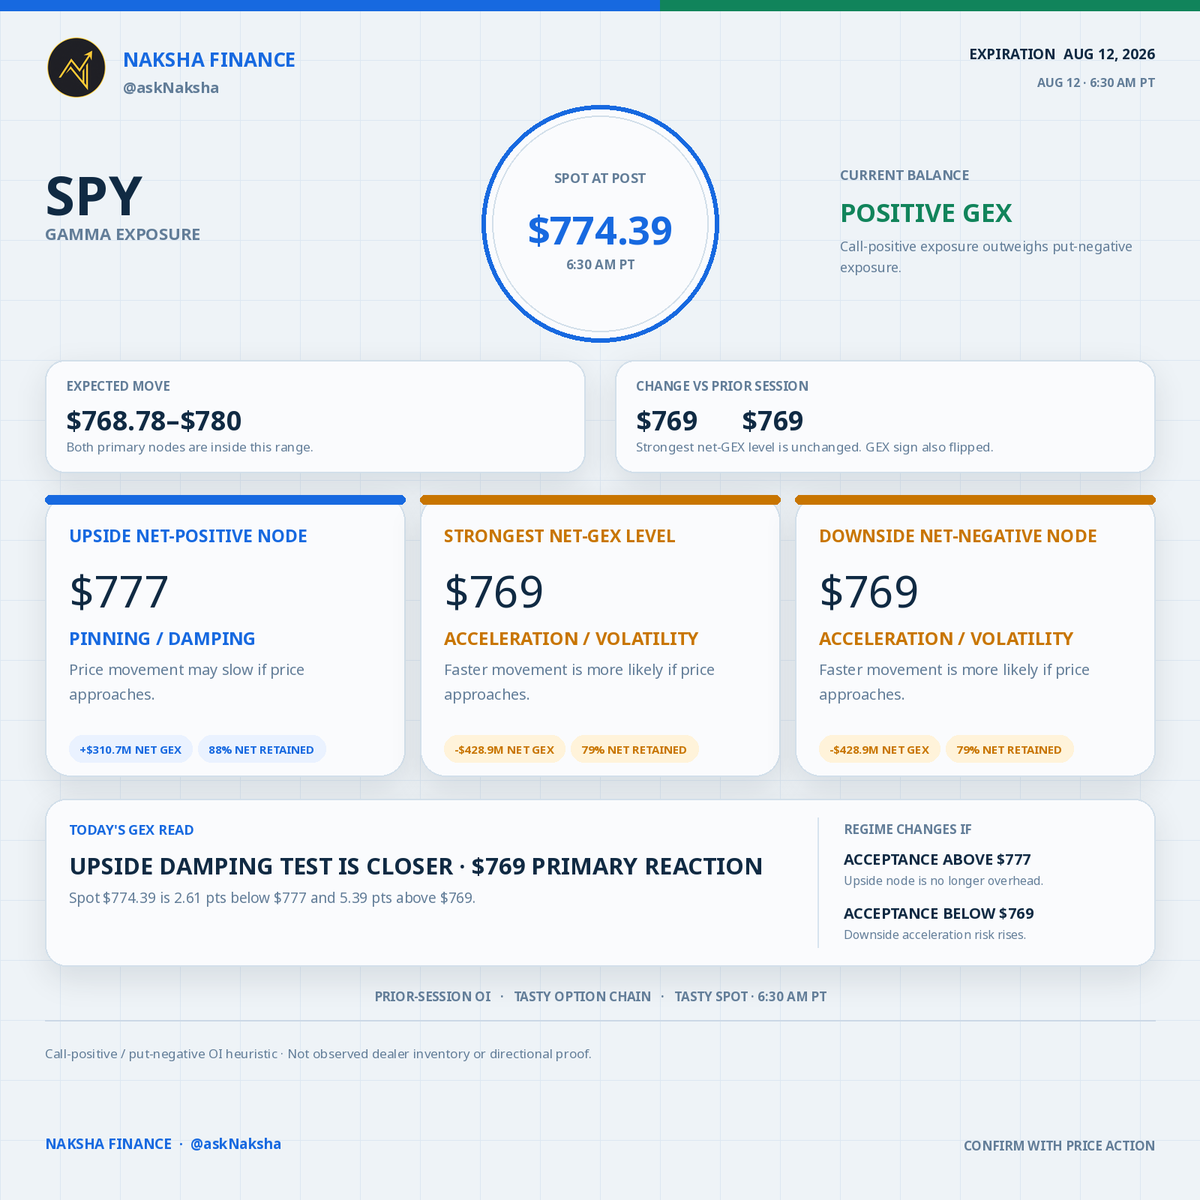
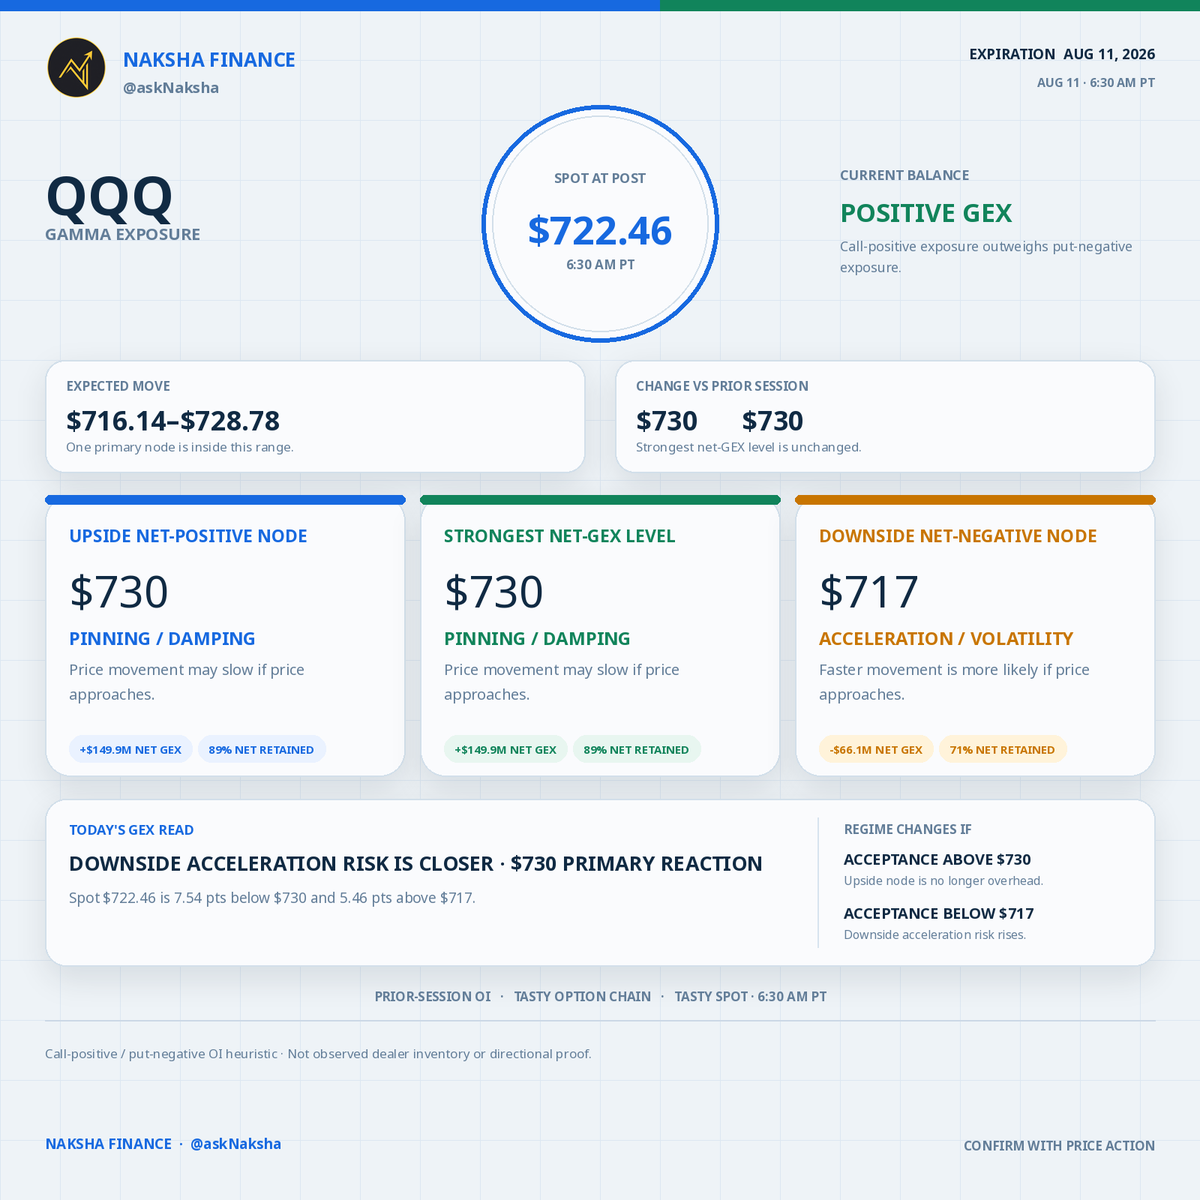
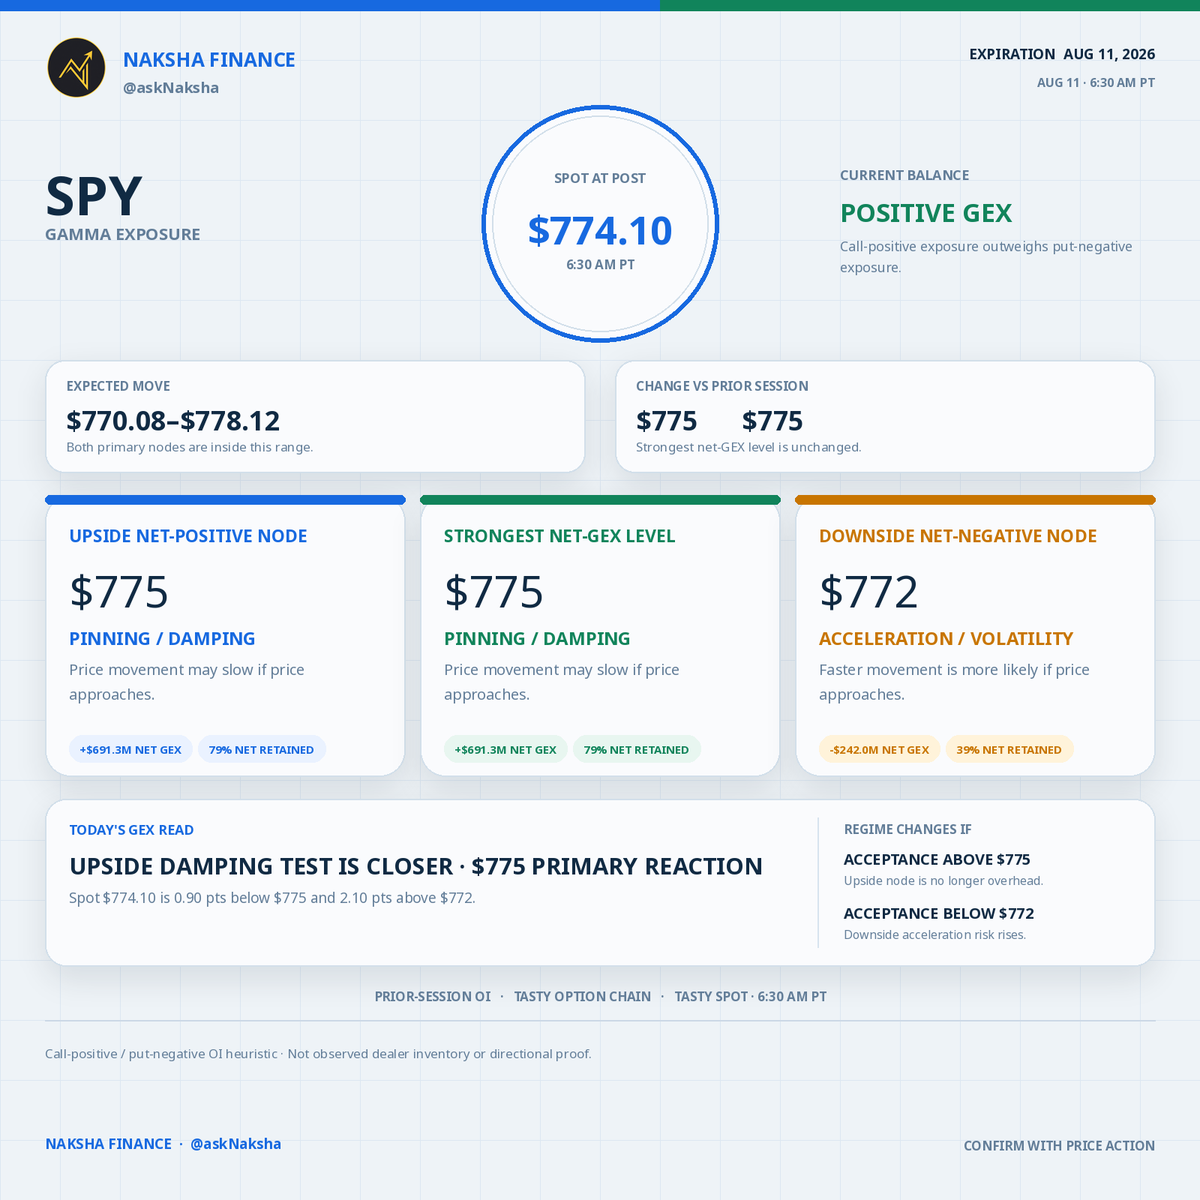
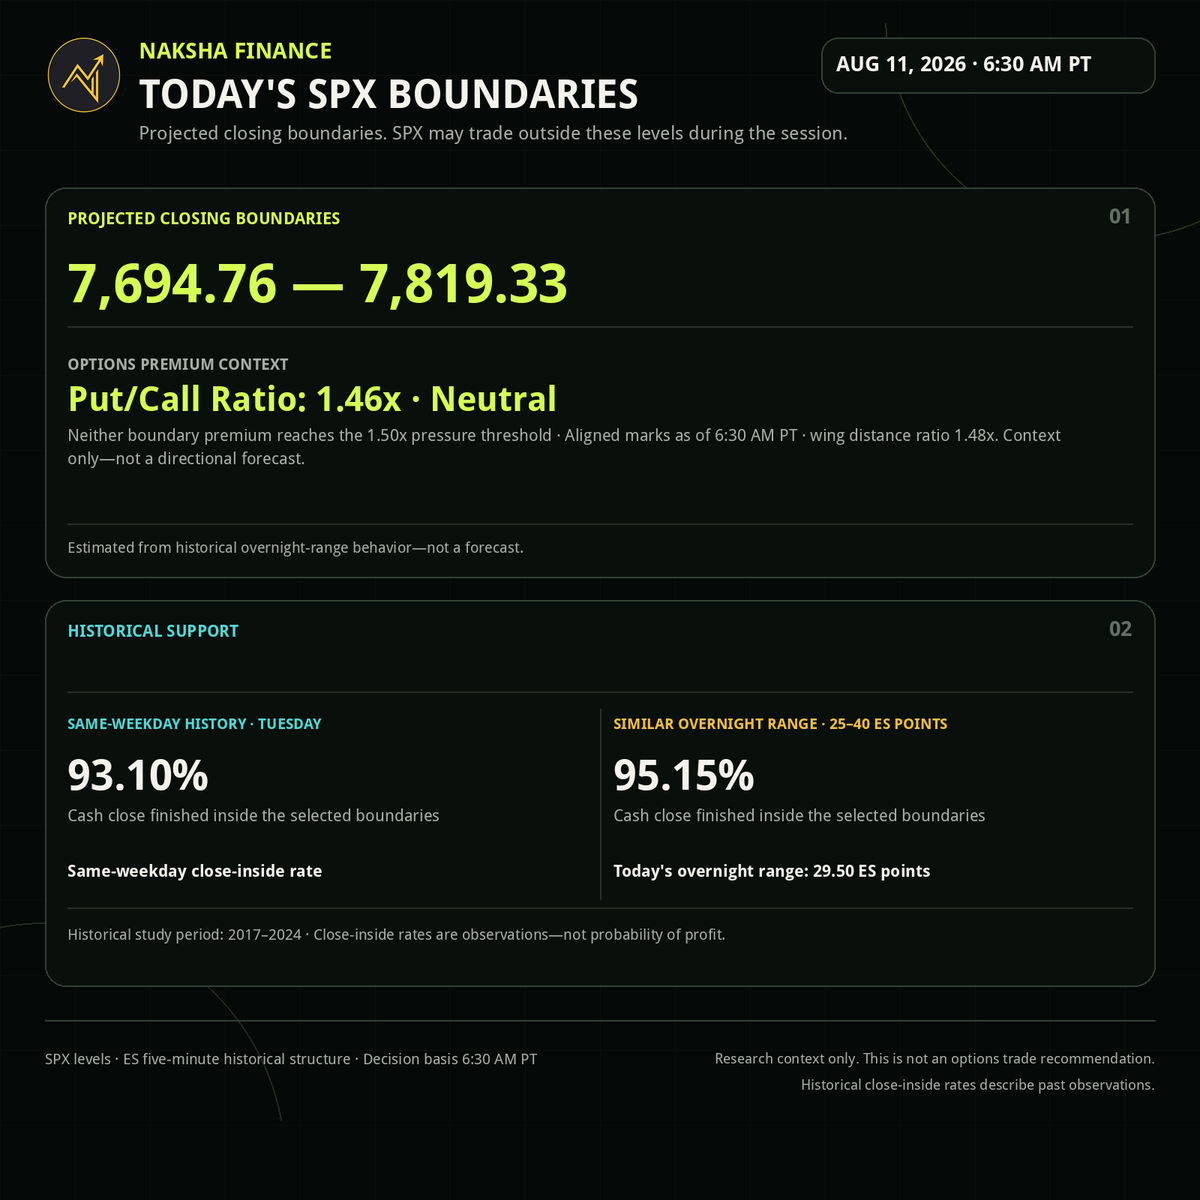
Morning GEX maps · Aug 12, 2026
$SPY · #QQQ · #ES_F · #SPX · #GEX
Closest GEX test: upside on SPY, QQQ & ES; centered on SPX.
Positioning: all 4 are net positive (more pinning/damping potential).
Not a directional forecast.
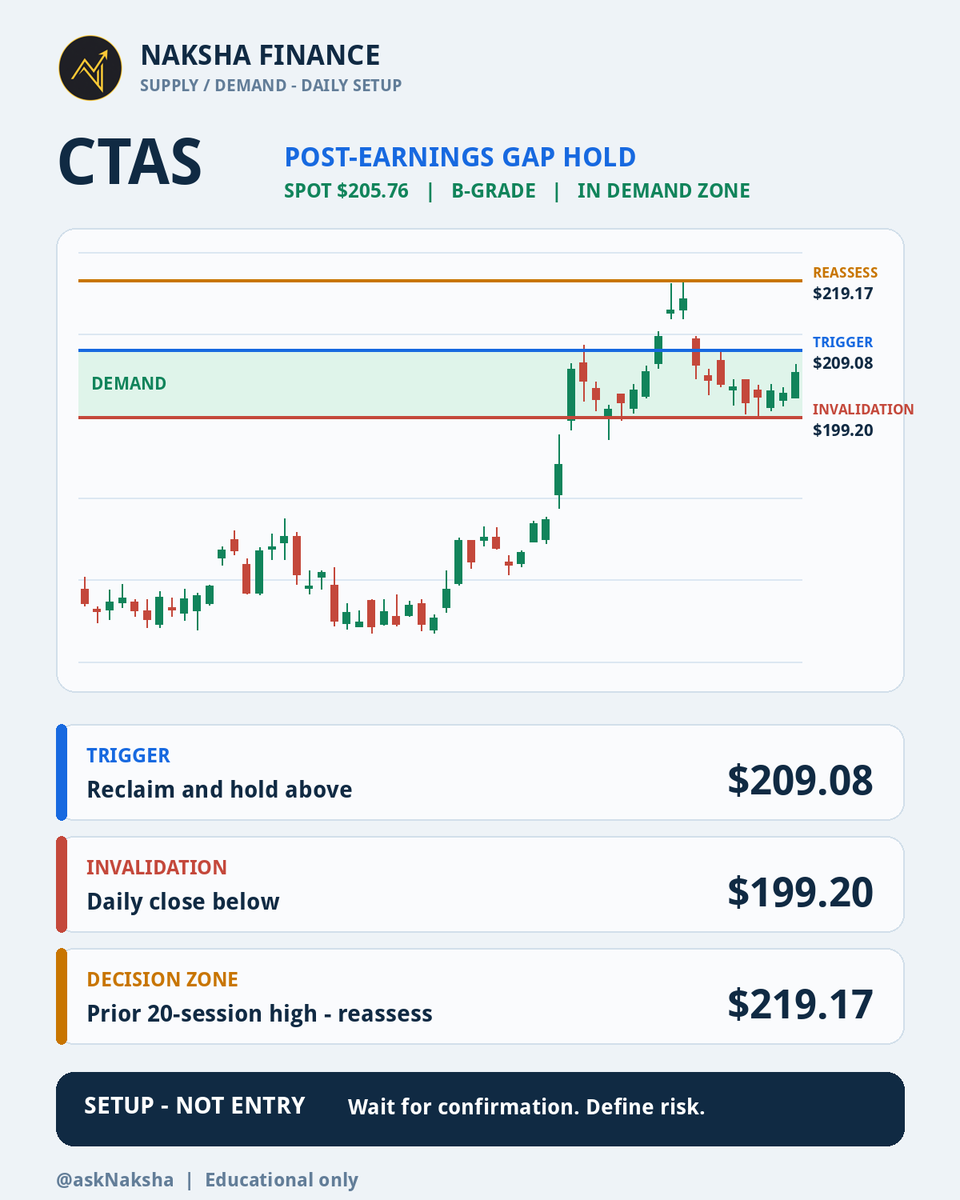
SETUP: $CTAS - Post-earnings gap hold
B-grade demand setup. Spot $201.95 inside $196.28-$203.43.
Trigger: reclaim and hold $203.43.
Invalidation: daily close below $196.28.
Decision zone: $219.17.
Educational only. Check back to see how the setup performs.
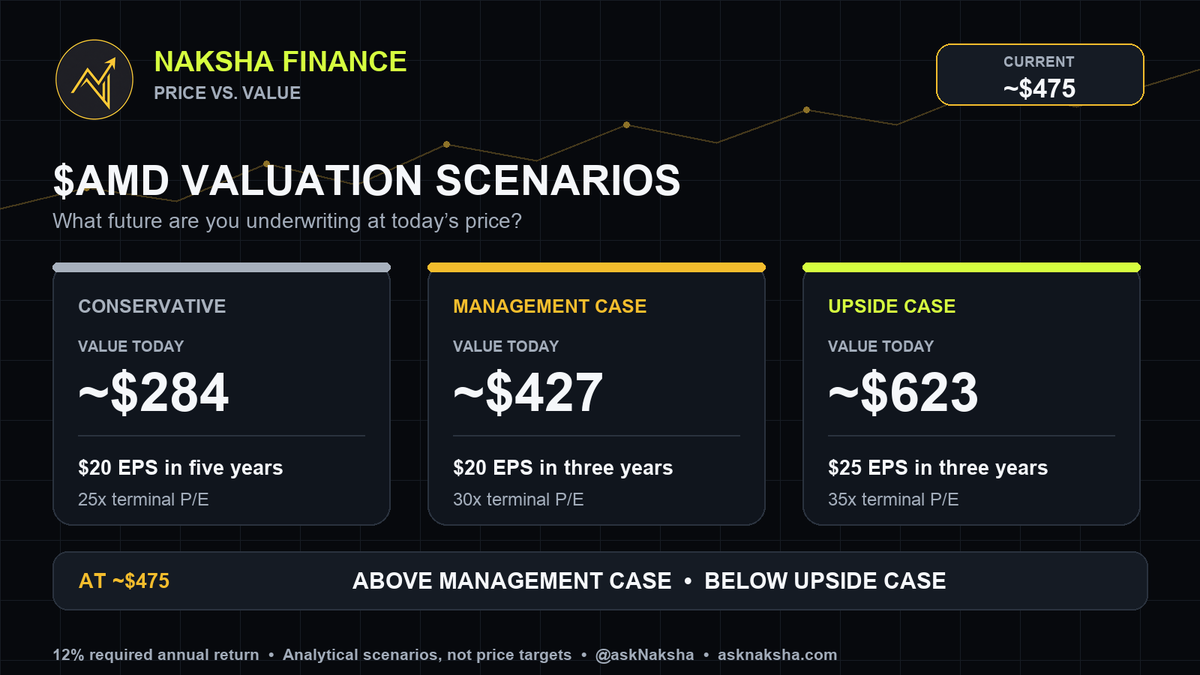
PRICE VS. VALUE: $AMD
AMD’s business is not rolling over; the stock’s expectations are.
At roughly $475 today, AMD looks expensive on present earnings and cash flow. It becomes reasonably valued only if you assume AMD delivers most of its ambitious AI growth plan.
WHY THE CHART LOOKS WEAK
Using the completed August 7 daily close:
• Close: $483.36, down 16.8% from the June 30 closing peak of $580.91
• Price is below the 20-day average near $503 and the 50-day average near $514
• The post-earnings decline came on unusually heavy volume
• AMD remains well above its rising 100-day and 200-day averages
That makes this an intermediate correction or topping process, not yet a confirmed long-term bear trend.
Reclaiming roughly $503–$514 and then $530 would improve the chart. Losing $469–$455, followed by $429, would strengthen the rollover thesis.
IS AMD OVERPRICED?
It depends on which future you underwrite.
At approximately $475 and 1.659 billion diluted shares:
• Equity value is about $789 billion
• Cash and investments are approximately $13.1 billion versus $3.2 billion of debt
• Enterprise value is about $779 billion
• First-half free cash flow was approximately $4.1 billion
Simply annualizing that first-half cash flow produces an enterprise-value/free-cash-flow multiple near 95x -clearly expensive, although second-half cash flow should be stronger.
AMD’s own three-to-five-year targets are greater than 35% company revenue CAGR, greater than 35% non-GAAP operating margin, and more than $20 of non-GAAP EPS.
At today’s price, the stock is already trading at almost 24x that future $20 of EPS, not current earnings.
VALUATION SCENARIOS
Using a 12% required annual return:
CONSERVATIVE - VALUE TODAY: ~$284
$20 EPS in five years
25x terminal P/E
MANAGEMENT CASE - VALUE TODAY: ~$427
$20 EPS in three years
30x terminal P/E
UPSIDE CASE - VALUE TODAY: ~$623
$25 EPS in three years
35x terminal P/E
MY INTERPRETATION
• $340–$430: defensible fair-value range if AMD reaches approximately $20 EPS within three to five years
• Below roughly $350: begins to provide a meaningful margin of safety under those assumptions
• Around $475: requires earlier achievement, more than $20 EPS, or AMD retaining a very high terminal multiple
• $600+: requires something closer to the upside scenario
AMD is therefore not necessarily irrationally overpriced, but it is not value-priced. The current price already discounts substantial success.
That is the distinction I care about: an excellent company can continue executing while its stock corrects toward a less demanding set of expectations.
Sources:
Q2 2026 results: https://t.co/JzvSM4is1R
Long-term targets: https://t.co/RmoEdubLzY
Market data as of August 10, 2026; indicators use completed daily data through August 7. Scenario values are analytical estimates, not price targets. Educational only—not financial advice.
@alphacharts365 It's seems to be moving into an intermediate correction/topping process - not yet a confirmed long-term bear trend. Reclaiming roughly $503–$514 and then $530 would improve the chart. Losing $469-$455, followed by $429, would strengthen the rollover thesis.
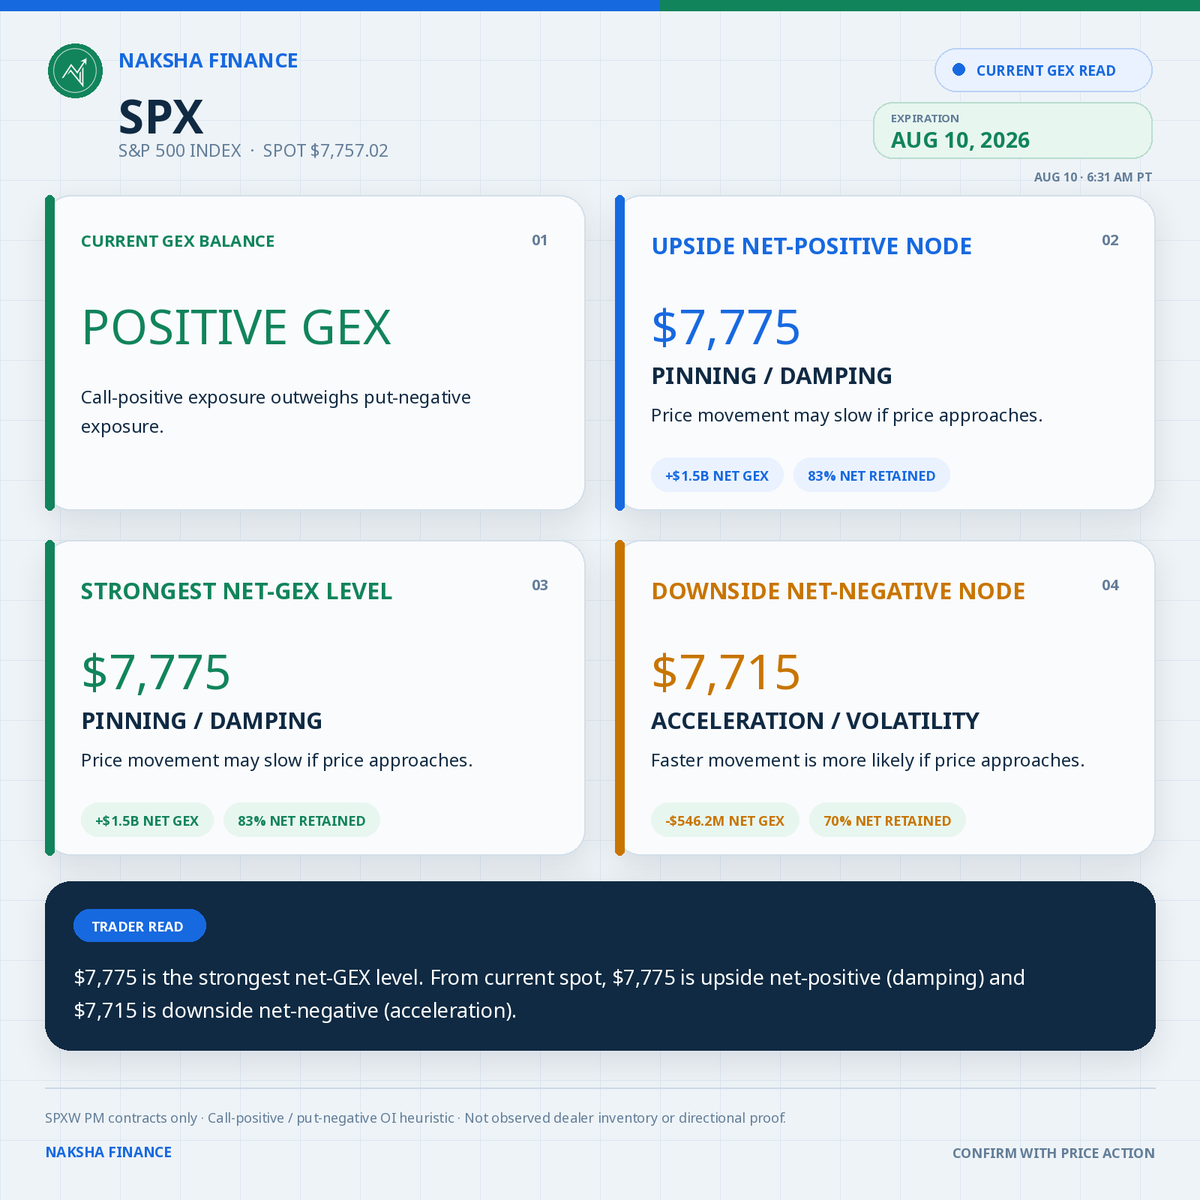
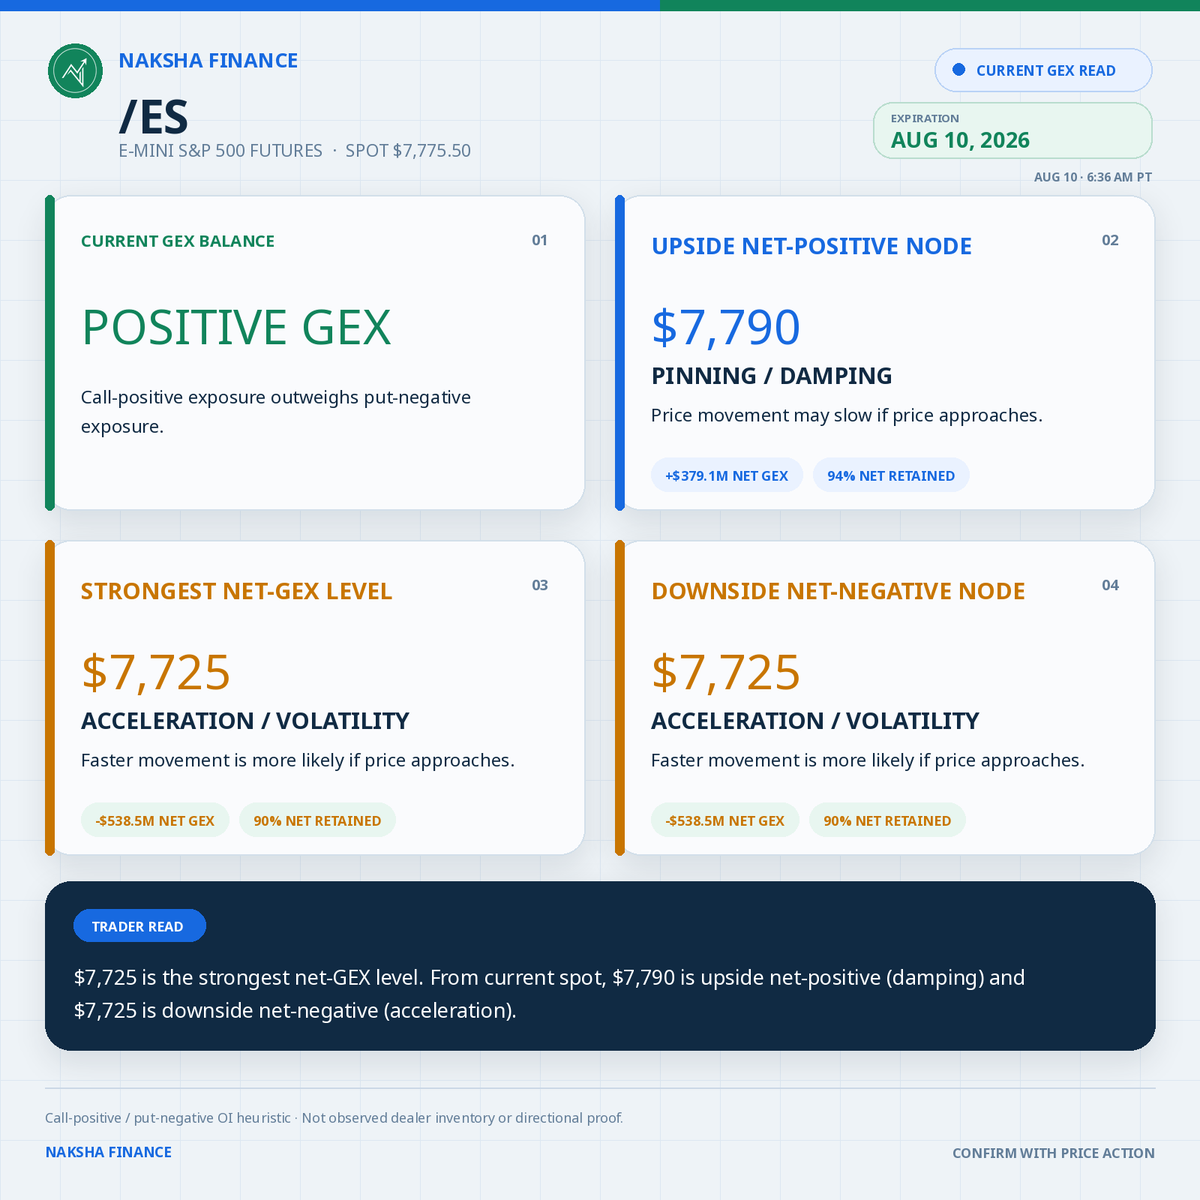
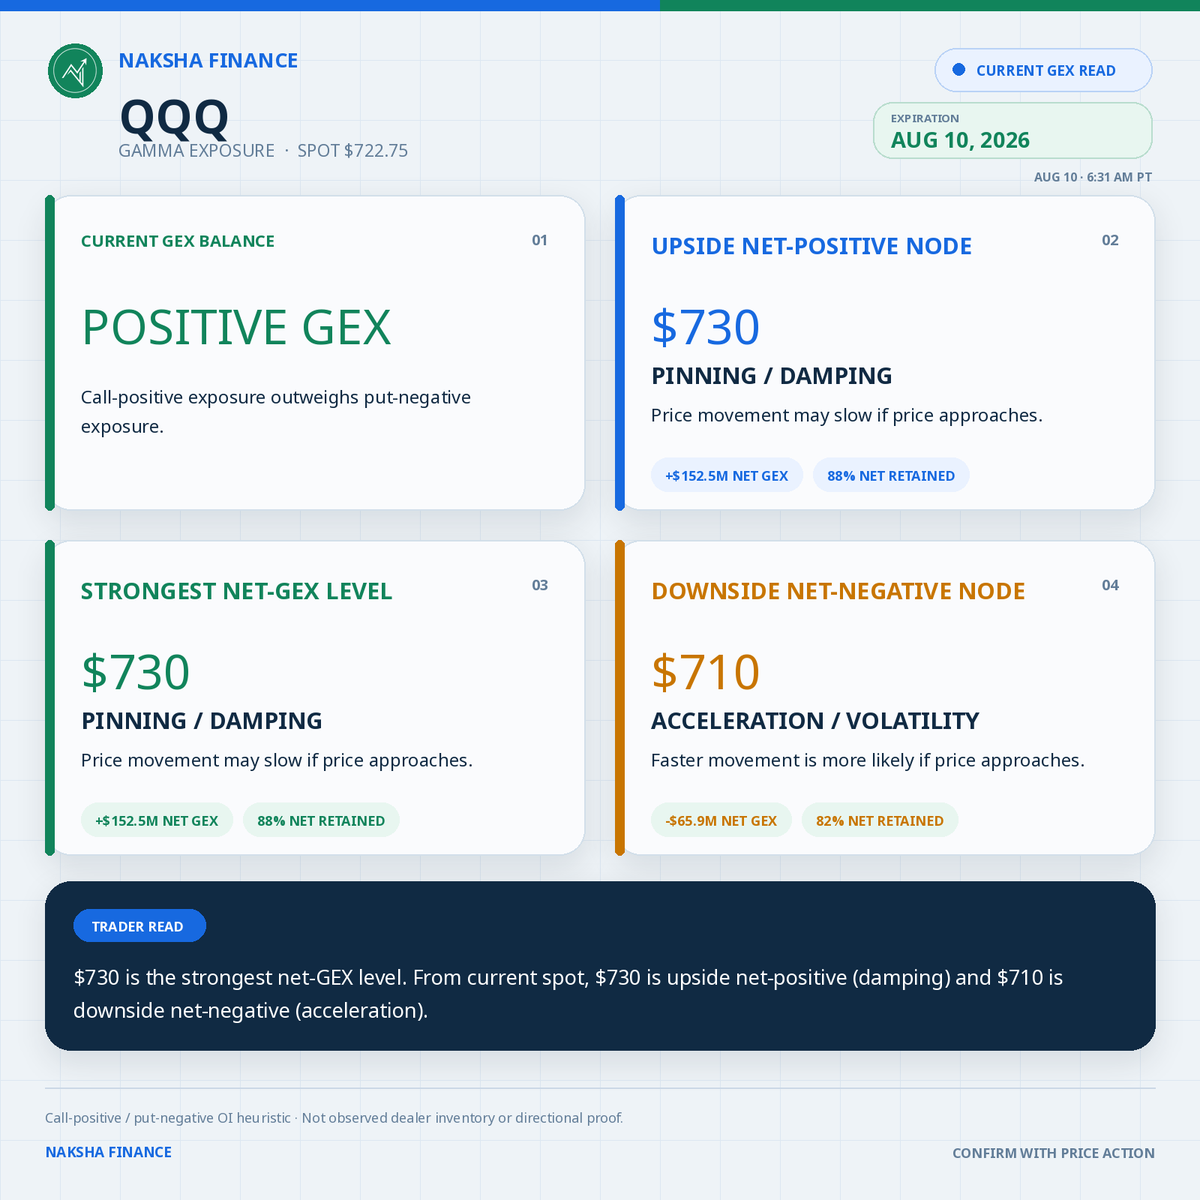
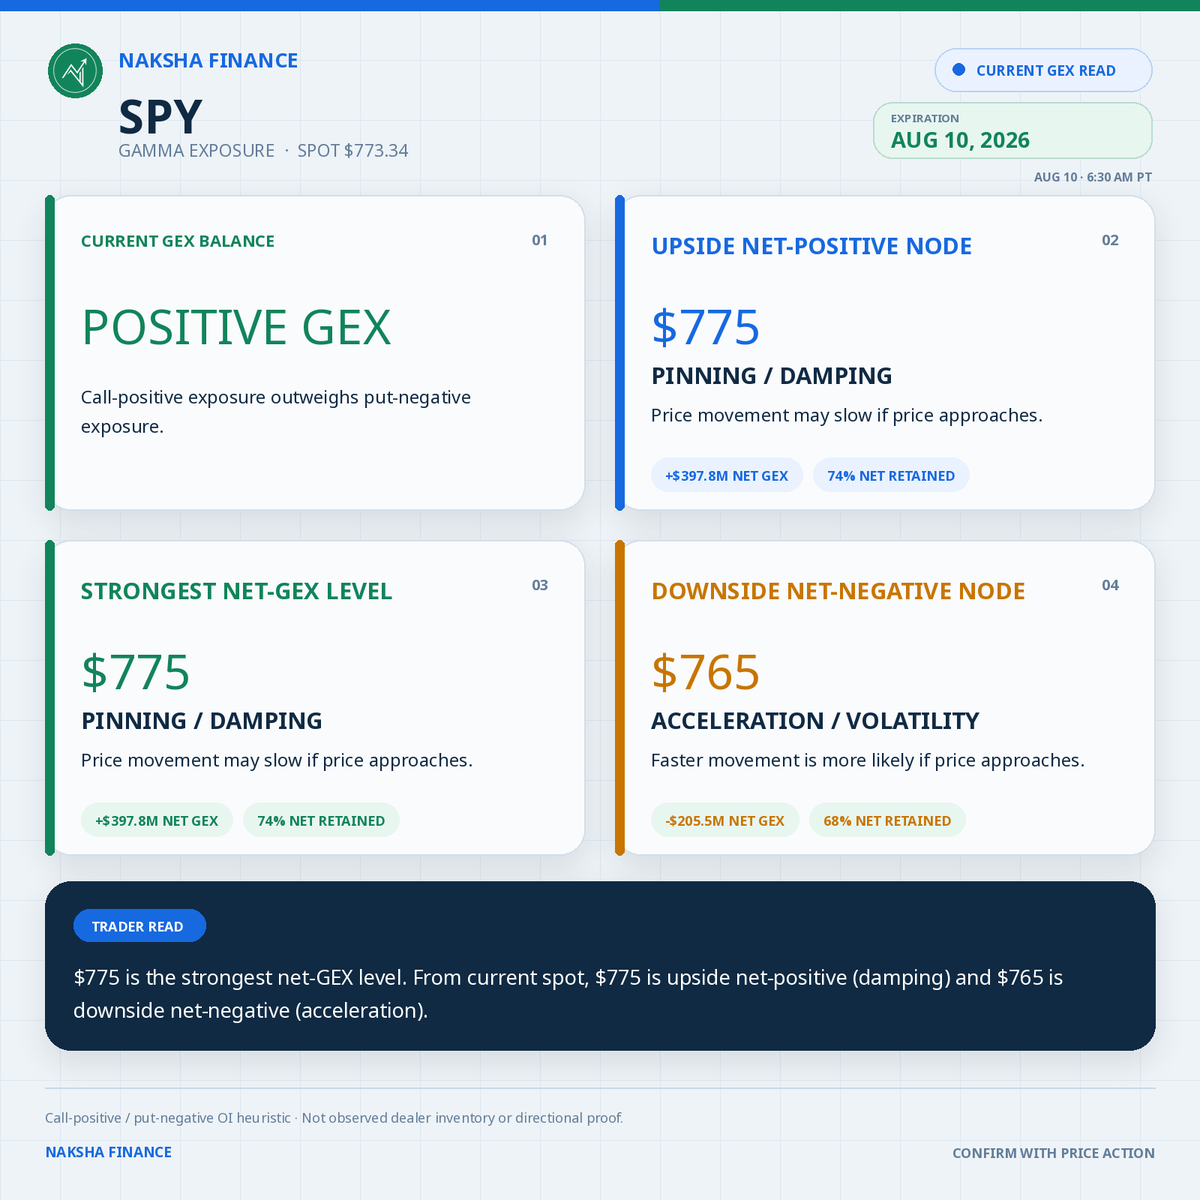
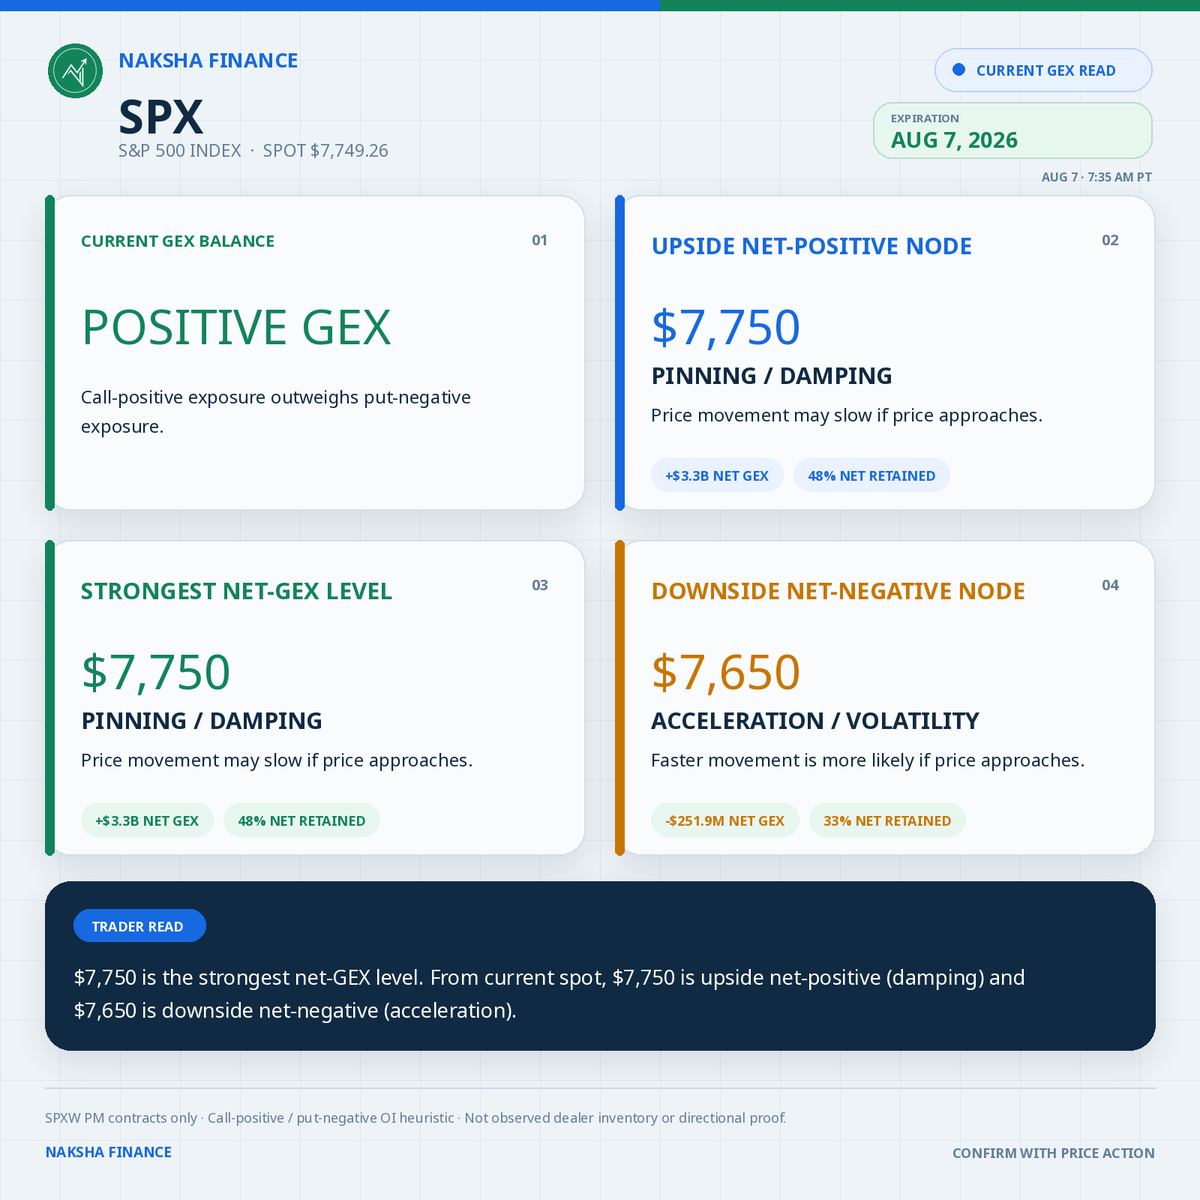
Morning GEX maps · Aug 10, 2026
#SPY · #QQQ · #ES_F · $SPX · #GEX
Trader read: From current spot, net-positive upside may damp and net-negative downside may accelerate; strongest net-GEX is the primary reaction level.
@TSDR_Trading looks good. Trying to hold the 407-365 zone. Next week's strongest GEX node 465. Large intraday options positioning at 437/450/440 calls. Additionally, increased activity at the 340P strike.
SOLD $APP Sep 11 $285P for $4.50 ($450/contract).
Post-earnings damage looks unresolved, with price below key daily averages.
Watching the $275–325 demand zone, then quarterly/monthly support near $260.
High-risk trade - not financial advice.
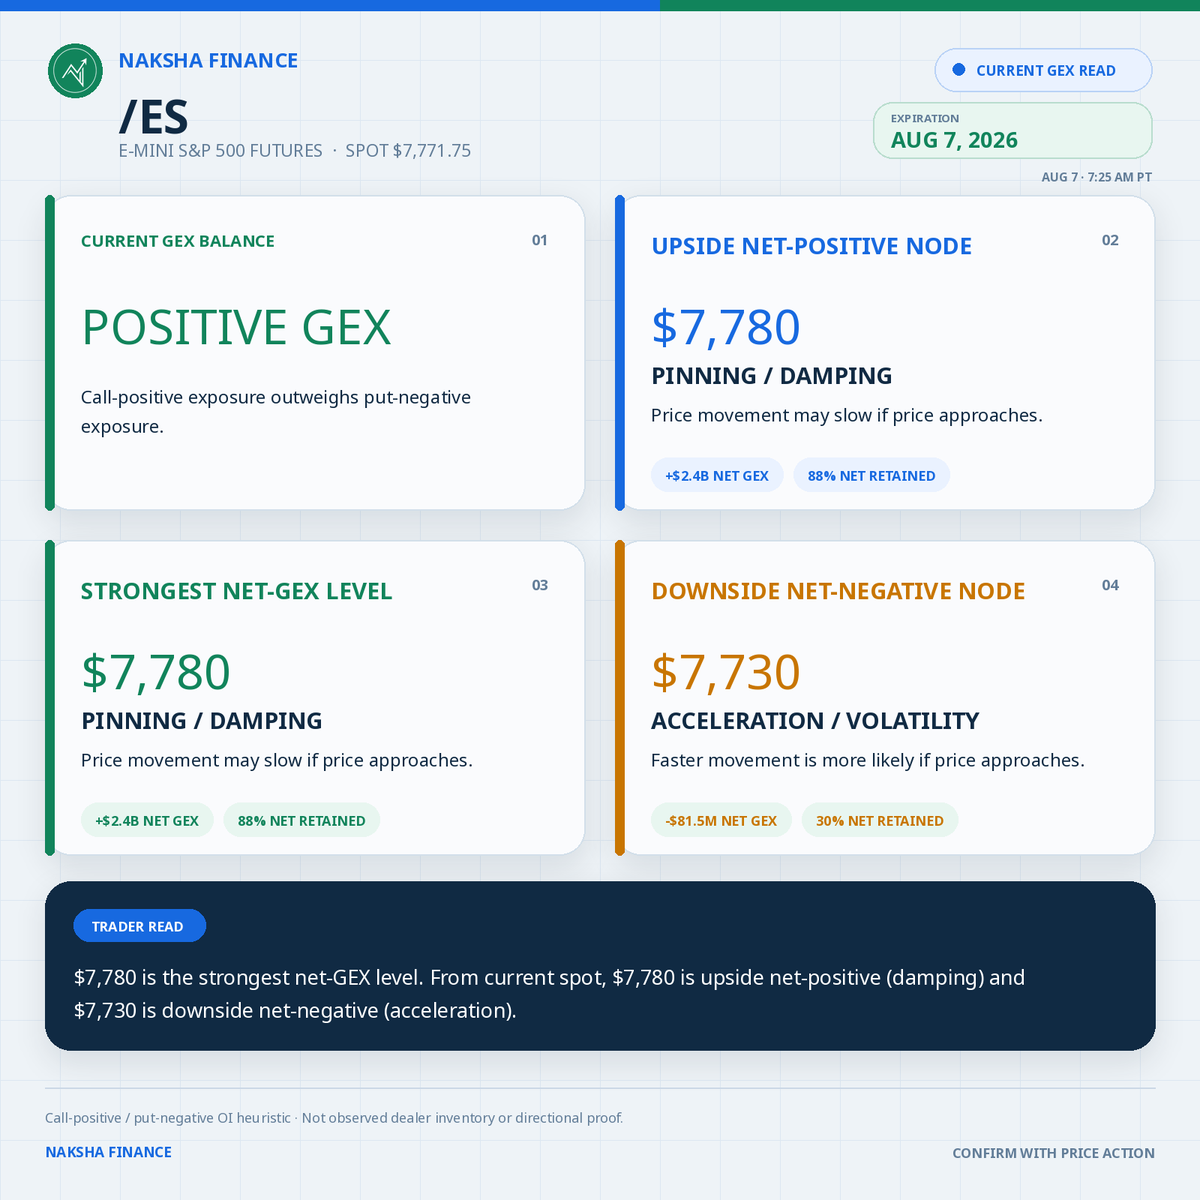
Morning GEX maps · Aug 7, 2026
#SPY · #QQQ · #ES_F · #SPX · #GEX
Trader read: From current spot, net-positive upside may damp and net-negative downside may accelerate; strongest net-GEX is the primary reaction level.