$btc
What after 66k? That's right, after closing a lot of long exposure, I am slowly adding some countertrend short exposure again here.
For the record, can we get three wins in a row again?
Now before you read the title and immediately copy my move, know that there is time for this coming short to play out. So I suggest to read the post to set expectations first. No confidence, no trade, very important.
Context
Context first, for the ones who are new, but also the ones who have been around, context matters a lot.
The best practice before setting expectations to the future, is to refer to recent past first on all timeframes. Context matters. Especially when a major target such as 66k hits. How it hits, changes the meaning of it hitting.
Recently, we ranged for a very long time sub 60k, and had a slow move up close to 66k, not hitting it, followed by a final quick burst from sub 63k (62.5k) to finally going north of 66k.
To get there was a process, lots of traps formed, even all the way up to the final move on July 15th which fell just shy of 66k. We shorted it back to the NYO pico low, our infamous cat and mouse game of recent past.
We trapped the mouse and brought home 66k. It secured us two wins in a row again, with this trade, we are aiming to get a third win in a row for obvious reasons (NFA).
Overall, what just happened, and the entire move to 60k, is classic major liquidity play, of setting traps until finally hitting a major liquidity level.
Major liquidity targets don't get hit, they are reached in the form of a trap first, before clearance so this indeed confirms that 66k+ was a major liquidity target.
And the final move to it, was a rather swift move. That is our context, and already gives clues to what next.
More context, is the fact that July has grabbed June's low, before reaching higher, it hasn't done it without grabbing June's low, which tells us the intent of July's end of month PA is different, it tells us a weaker end than if June's low wasn't taken, and it tells us June's midpoint (66k) is also of more importance than if June's low wasn't taken. That's added confluence to the expectations of July's end.
So overall, context gives us reasons to at the very least, not be overly bullish here north 66k+. Is it a short position? Not yet. Can't just trade on "vibes" and context alone. We're going deeper.
Biases
Next, are biases. Are they still the same? What are my directional expectations?
Weekly bias
My weekly bias remains: 60k region is the bottom, I have been and still think the bears are wrong, and this move to 66k+ only solidified the 60k region as a bottom, where the daily range extends and builds more liquidity. So I still think we don't see sub 50k, that remains.
It not changing, is only logical, a daily target hitting, doesn't mean a weekly bias changes, it means at most, a daily bias changes if all conditions of the target hitting fulfil.
Daily bias
And since it has, and since this was a major target, my daily bias indeed now has changed. It's no longer bullish, because indeed my daily target of 66k has been hit.
It's cautiously bearish now. I say cautiously, and that's a keyword, because we are in a weekly regime which imo bottoms us out. Which means that my bias isn't permanently bearish here on the daily timeframe nor is it bearish for a long time. It's cautiously or "countertrend" bearish. A weekly bottoming regime is not a time to attach a heavy bearish bias on the daily against the trend, and it explains why this isn't a heavy short either, it's a lighter one.
And that positioning here, goes in lockstep with the mindset "don't gamble away your profits straight away". We just scored major gains at 66k closing 3 longs at the same time (except runners), no need to gamble them away with large overly confident positions.
Hourly bias
Of less importance, but this bias can help local impatience. My bias locally, is still a range/slow pa here. Which supports why I think there is still time for this move to play out.
Magnets
Next, are magnets. They need to support our bias. Weekly magnets: none below. Last one was 60k, that's cleared, a long time ago already (since Feb).
Daily magnets are present: we have poor lows on the TPO charts, both locally and still lingering in the sub 63k region as well. Keeping in mind, poor lows on their own, not a guaranteed magnet, especially not in a weekly bottoming regime, but they ad to the overall confidence.
Finally, the weekly open untapped, you already know what that means.
Further confluences and timing
Furthermore, we are in the lower high region (LH region) of June 15th high, classic place to expect rotations to occur.
Added to that, we have mmd with $eth, I'm also going to leave no further comment to what that means, long term followers know, just ask them in the comments.
And finally, we have FOMC meeting to the 29th of July. Also no need to express what that means. Type in FOMC reversal in my post history search function, and you know.
Summary
In short, I went short here , no pun intended. We just hit our major 66k liquidity target, the target we have waited for, for a very long time.
The way we reached it, combined with the confluences, which are quite a few, are enough to expect some digestion of the move up that just happened.
We are trying to capture that. Not in an ultra bearish way, but in a cautious, against the trend way, with still enough potential to make good money type of way.
So keep in mind, the decision of this trade is on the edge. Not every predicted/expected move should be traded. Some aren't worth it since they have lower tail reward. There are no guarantees, and I sometimes get it wrong too. This is one of them. Although FOMC reversal can offer bigger moves, and $eth mmd can offer resistance longer than people are confident on.
So label this very much as a countertrend short attempt, one worth taking. And adjust your size to what your tolerance suggest is good for countertrend plays like this.
Enjoy, plan is given, outlines are clear, and over time, I will create more posts, reminders and also sentiment reads supporting this countertrend thesis.
But for now, I just want to pioneer this pullback idea, in case we get copied or ideas get pushed around, to have this as a reference to be "the first", etc etc.
Per rule of credit where due, but also because being prepared early is good. Being prepared early is important.
I observed every single $BTC bear cycle.
Key update:
Practically every single cycle, we complete a 5-wave correction. We also tend to form two significant bear market highs. The first comes immediately after the initial top on the first major retrace. This is the complacency high, the point where the majority believe the bull market is back.
It's exactly why I took shorts from 96K down to 70K this cycle. Once that complacency high is established, price usually pushes to fresh lows as the macro correction continues.
We saw this in 2014, 2022, and again in 2026. In 2018, price didn't make a new low after the complacency bounce, but the overall structure remained very similar with multiple retests.
Shortly afterwards, we typically get a dead cat bounce. Across the previous cycles, this dead cat bounce establishes the base low. By this stage, most market participants have already been wrecked after buying into complacency, sentiment is at its worst, and everyone begins aggressively piling into shorts.
Delta flips, shorts get squeezed, and price rallies. At the end of the day, it's simply market psychology. After the dead cat base low is formed, the final bottom is usually established following the second major retest.
We saw this in 2015, 2018, and 2022. Fast forward to today, BTC has swept the dead cat base low and completed the same 5-wave corrective structure we've seen throughout previous cycles.
The only thing that makes me hesitate is the timing. Every previous bear market has lasted roughly 365 days before putting in the final bottom. If the low is already in this cycle, it would have formed in around 260 days, roughly 100 days earlier than every previous cycle.
That's why I'm still 50/50. Structure suggests the bottom is in. Timing suggests it isn't. Eventually, cycle lengths will change. The mistake is assuming they never will. We need to be prepared for that possibility.
We'll likely have our answer over the next couple of months, but it's worth pointing out that, from a structural perspective, every corrective wave has now been completed and the lows appear to have been established.
There is a very good chance we get some chop from here, but in terms of the low being in, I think it's more likely we form higher lows than make significant new lows.
$btc - FOMC reversal
Why we countertrend shorted above 66k - confluence 1
Alright, as promised, after sharing the entry which is already 3 hours ago, I would share one by one why I am considering this countertrend short after hitting our major major target, 66k.
In the post itself, I have given all reasons, but I promised to lay them out with the respective charts, one by one.
Not something I can share in one post, since, as many of you know, my trades aren't just based on one chart or idea, they are a full construct and detailed plan of a lot of strong confluences to get to the full idea, the golden standard before even considering entering the market, especially on a countertrend trade.
Here is one of them, it's the FOMC reversal. As many of you may already know, and as I am also known for, for sharing this analysis in the past many times.
In fact, almost every time, days before FOMC comes around, I shared this analysis, with the announcement of "FOMC is happening IMO", or, on the rare occasion "we may see FOMC continuation this time, as shared in October/November 2024.
Why days before?
Because the market tends to reverse before the FOMC meeting, not during or after.
Like clockwork, where the masses anticipate a "large move" after the meeting, exit their trades (at the worst times), to "stay safe", the market has already reversed.
That's the FOMC reversal in a nutshell. It works with 90%+ accuracy, and with another meeting coming up on the 29th of July, we have another FOMC reversal idea coming up, of price reversing the uptrend back down.
For how much of a move and how long you ask? That's an analysis for another time, and just using this analysis for that, the targets, is not sufficient.
And that brings us back full circle, as to why I never base my trades off of just one analysis. FOMC reversal is a direction and a mild onset of an entry idea, not a target, not a full trade framework.
But it's strong confluence to a rather great swing of direction, one that almost always makes you money.
And as a full time trader, that's all that matters, in my world.
$BTC Wyckoff Accumulation Schematic #1 - where are we?
According to my Claude Code built analysis platform releasing to Subscribers soon, we are about to enter Phase D which will take $BTC to $85k at the Sign of Strength SOS.
The next high conviction entry is the LPS pullback. The platform will alert and analyze every test correlating to:
- Moving averages
- Liquidation Levels
- Option MaxPains
- Futures MaxPains
If the test passes this is my next major tranche and stop loss will be moved up to $68k. Stay tuned.
| EDUCATIONAL CONTENT #2 | Wyckoff Schematic |
In the previous post, we broke down Wyckoff Distribution Schematic Model 2.
The main idea was simple:
Retail calls it a breakout.
Market makers call it inventory distribution.
Now we move into Wyckoff Distribution Schematic Model 1.
Different model.
Same illusion.
Most traders still believe the market moves because of patterns, trendlines, indicators, or “bullish momentum”.
But price is not random.
Price is delivered to areas where liquidity exists.
And in this example, the entire range acts as a controlled environment to engineer belief, attract buyers, absorb demand, and prepare the markdown.
This is a Wyckoff Distribution Schematic Model 1 on German 40 through the lens of market engineering.
After the initial bullish movement, retail sees a range.
They assume the market is consolidating before another expansion higher.
But during distribution, the market needs one thing above everything else:
Buyers.
Large inventory cannot be distributed efficiently into weakness.
It needs demand.
It needs emotion.
It needs breakout traders.
It needs traders to believe higher prices are coming.
That is why the range is built.
It creates structure.
It creates reference points.
It creates liquidity.
And once enough liquidity is engineered, price can be delivered in the opposite direction.
-------------------------------
1st - BC – Buying Climax
-------------------------------
The structure starts with the Buying Climax.
Price pushes aggressively into the first major high.
To most traders, this looks like strength.
The move looks clean.
The candles look bullish.
The narrative becomes continuation.
But in distribution, strength is often the bait.
A Buying Climax is not just bullish momentum.
It is often the first area where aggressive buyers provide the liquidity needed for larger participants to start distributing inventory.
Retail sees strength.
Market makers see buyers to sell into.
That is the first difference.
-------------------------------------
2nd - AR + ST – Defining the Range
-------------------------------------
After the BC, price reacts sharply lower into the AR — Automatic Reaction.
This reaction is important.
Because if the market were truly strong, price should not reject with that level of aggression after making the high.
The AR reveals that supply is present.
Then comes the ST — Secondary Test.
Price attempts to retest the upper area, but the market is no longer expanding freely.
It starts rotating.
And that rotation defines the range.
Highs.
Lows.
Support.
Resistance.
Retail traders use these levels to make decisions.
Market makers use these levels because orders accumulate around them.
Stops above highs.
Stops below lows.
Breakout orders above resistance.
Dip buyers at support.
Shorts entering too early at resistance.
The range is not random.
It is the liquidity map.
-----------------------------------------------
3rd - SOW-B – Sign of Weakness in Phase B
-----------------------------------------------
Inside Phase B, price sweeps into the lower part of the structure and creates the SOW-B.
This is where the first real weakness appears.
Price trades below the range support area, takes sell-side liquidity, and then reclaims back into the range.
To retail, this can look bullish.
They think:
“Support was swept.”
“Price reclaimed.”
“Demand is stepping in.”
“This can still continue higher.”
But from a market-engineering perspective, the market is doing something deeper.
It is creating liquidity on both sides.
First, sell-side liquidity gets taken.
Then price returns back into the range.
Then traders start believing the downside move failed.
That belief is needed.
Because the next objective is not immediately lower.
The next objective is often the buy-side liquidity resting above the range.
---------------------
4th - UT – Upthrust
---------------------
After the SOW-B, price rotates higher and trades back into the upper resistance area.
Then comes the UT — Upthrust.
Price pushes above the previous resistance zone.
Retail sees strength.
Breakout traders start getting interested.
Early shorts get stopped out.
Momentum traders begin to chase.
This is where the illusion becomes stronger.
Because the market is not just moving higher randomly.
It is delivering price into liquidity.
The UT creates the first manipulation above the range.
But it is not the final event yet.
It is part of the process.
The market is teaching traders that breaking above resistance might lead to continuation.
That belief sets up the real trap.
-------------------------------------------
5th - UTAD – Upthrust After Distribution
-------------------------------------------
Now comes the key event of Distribution Model 1.
The UTAD.
Price pushes above the established resistance area again and trades into premium.
This is where the bullish narrative becomes obvious.
Breakout buyers enter.
Early shorts get stopped.
Momentum traders chase.
Retail sees confirmation.
The market looks ready to continue higher.
Exactly the liquidity needed.
But the UTAD is not just a higher high.
It is a liquidity event.
Price moves above the range to access buy-side liquidity resting above resistance.
The move above the high is not the real signal.
The reaction after the move is the signal.
If the breakout were real, price should accept above resistance.
But in this example, price fails to hold above the high.
That failure tells the real story.
The breakout was not respected.
It was used.
Used to trigger buyers.
Used to stop shorts.
Used to complete distribution.
Used to engineer the illusion of strength.
This is why most traders get trapped.
They buy the moment where distribution is already being completed.
-------------------------------
6th - TEST – Testing the Trap
-------------------------------
After the UTAD, price comes back below the resistance area and begins testing the structure from underneath.
This is where the chart becomes very important.
The market gives traders another reason to believe.
Another test.
Another reaction.
Another possible “buy the dip” opportunity.
But structurally, the auction has already shifted.
Price is no longer accepting above resistance.
The tests fail.
Resistance holds.
Demand weakens.
Every reaction becomes less convincing.
This is where former bullish structure starts turning into supply.
The resistance lines are no longer breakout levels.
They become areas where trapped demand gets absorbed again.
Retail still sees a possible recovery.
Market makers see failed acceptance.
And failed acceptance after a liquidity sweep is one of the clearest signs of distribution.
7th - Phase D → Phase E
Once the tests fail, the market begins transitioning from Phase D into Phase E.
This is where the markdown starts.
To retail, the selloff looks sudden.
But it was not sudden.
It was prepared through the entire range.
The BC attracted demand.
The AR revealed supply.
The ST defined the range.
The SOW-B showed weakness.
The UT manipulated above resistance.
The UTAD swept buy-side liquidity.
The tests confirmed failed acceptance.
Then price delivered lower.
The range had already served its purpose.
Liquidity was engineered.
Breakout buyers were trapped.
Early shorts were stopped.
Demand was absorbed.
Resistance held.
The market had no reason to stay elevated anymore.
Now price can move toward the technical target.
The markdown is not random.
It is the result of everything that was engineered inside the range.
The biggest lesson:
Same chart.
Completely different understanding.
Liquidity first.
Acceptance second.
Direction last.
Once you understand this, Wyckoff stops being just a schematic.
It becomes a language for understanding how the market engineers belief before delivering the real move.
A higher timeframe Bojan is one thing. An unfinished lower timeframe sitting inside the third candle is where probability starts to compound.
2W Bojan forming, unfinished weekly inside the third candle. That weekly is no longer just an unfinished candle. It becomes a high probability plus draw.
Major liquidity taken, opposing supply or demand mitigated.
From there, I look inside the level for the entry sequence: MTF Wyckoff, a fresh Bojan, or clean structure forming from the third candle low.
HTF sets the operation. The unfinished candle gives the draw. MTF/LTF gives the entry.
You are simply not fucking ready... $BTC
The Final Phase. Plan posted from Feb 10th. 2026.
95% of the market got completely rekt on the retrace from 83K down to 57K. Why? Because they couldn’t help themselves.
They chased the first euphoric leg up (in a macro downtrend) like a mindless herd animals.
Now, right back at the lows, they are shaken, confused, and frozen in place, sitting on their hands wondering what the fuck to do next.
The same reflexive psychology every cycle. Prior losses create paralysis, anchoring participants to downside scenarios.
Peak uncertainty creates peak opportunity.
ANTHROPIC ENGINEER: MOST PEOPLE ARE STILL PROMPTING ONE STEP AT A TIME.
An Anthropic engineer says the gap is not the model. "Fable 5 is already smarter than we know how to use. The bottleneck was never the AI. It's you."
20 minutes, no extra spend, showing how to build something that improves itself instead of needing you to prompt every single step forever.
Watch it, then save the guide below.
$BTC – What's Next?
The Big Sunday Report: All We Need to Know
🚩 TA / LCA / Psychological Breakdown:
Everyone and I mean literally everyone I personally know has told me over the last three or four weeks, and especially over the last two weeks, that they want to buy in September or October. That alone is already very dangerous. When you ask them why, they all give the same answer: “Because of the four-year cycle.” And I honestly ask myself how long some of these people have even been in the market. The four-year cycle also worked almost perfectly at the top, but nobody talked about it then. That is the difference. At $120,000, nobody wanted to talk about the four-year cycle. In fact, people hated it. They said, “It does not exist. It does not exist,” because they were greedy and wanted prices to keep going higher.
Now the same people are greedy again, just in the opposite direction. They believe the market is going to serve them the exact bottom on a silver platter. ���Here is the bottom. It will come around September or October. The exact price will be this or that.” That is genuinely what people believe. The problem is not the four-year cycle itself. The problem is the number of people who believe in the exact same outcome. The more people believe it, the less realistic it becomes. I honestly believe we will not see this traditional four-year-cycle bottom
The next question is: what do we actually see instead?
At the moment, I do not even see Bitcoin going below $50,000. There is an extreme amount of liquidity around $54,000, and that cannot be ignored. You have to keep that level in mind. From the current price down to $54,000 is around 15%. From a risk-reward perspective, even if we assume the worst-case scenario is a move into the $54,000 region, buying now and facing 15% downside is not much. It is nothing compared with the people who always and stupidly bought at $70,000, $80,000 or $90,000, and those who never understood the right moment to enter the market, and anyway, those people will always buy, and we cant count them among those who bought the bottom.
That is why it makes sense to begin accumulating now, step by step. Not all in. That is very important. I do not suddenly FOMO in and deploy everything. No. This will still take some time. I also believe the real move higher is not starting immediately. But there is one more thing people should not forget. They say the four-year cycle should end around October. Fine. Then let me ask you a counterquestion:
BlackRock, the New York Stock Exchange, the S&P, Nasdaq and the other major institutions are all involved in the DTCC, the new financial market infrastructure, and they want to move forward with the tokenization of stocks. BlackRock wants to launch the new platform in October. What does that mean?
It means investors WILL trade stocks 24 hours a day. That is enormous, and the market still has not fully understood it. Tokenization has mostly been treated like a beta phase until now. Platforms such as Hyperliquid and similar markets were effectively test environments. They wanted to see how much demand there was, how users would react and whether the infrastructure worked. The users had to be tested. The technology had to be tested. The market had to be tested. And it worked extremely well. Now it has been announced that this is expected to move forward in October. At the same time, there are rumors that the Clarity Act could pass in August. That would be enormous news.
If it passes, there is regulatory clarity. Institutions can enter the crypto market much more easily. I do not necessarily believe they will suddenly start buying the entire crypto market at scale, but I do believe they will move aggressively into tokenization, which could follow one or two months later. So lets return to my question:
Who benefits from tokenization?
First of all, the entire crypto market benefits. Even if institutions do not directly buy every cryptocurrency in large size, the narrative becomes bullish for crypto and Blockchain. The market starts to see blockchain as legitimate, institutional and part of the future financial system.
Then you will see prices move strongly in my opinion. I expect we will see BlackRock announcing partnerships, BlackRock doing something with Bitcoin, Trump making new statements, and suddenly the entire narrative becomes extremely bullish because everything fits together. Do you really believe BlackRock will aggressively push tokenization forward in October while, at the exact same time, the crypto market crashes, fear dominates and nobody wants anything to do with crypto? Do you think that ? I do not.
I believe we will see FOMO in October. I believe we will see large candles and strong momentum in the market. It may not necessarily be the same type of retail FOMO we have seen before, but there will be growing confidence and acceptance, while major bullish news enters the market at the same time. And this will be the time where the retails are sitting and doing what ? Exactly, these people will wait for their four years cycle! Let them wait for their cycle, because the market will front run that! In my opinion, that will create an extremely powerful bullish narrative.
That is why the fact that everyone now believes in the four-year-cycle bottom is a warning sign to me. It tells me the crowd may once again be completely wrong. I especially believe that many people sitting with buy orders below $50,000 will never get filled. That is why I am starting to accumulate now. I hope we still take the liquidity around $54,000, because that would give an even better entry. I have my orders ready, and I will continue buying gradually every day.
The Exact Strategy: How I Am Buying, How Much I Am Deploying, and the BTC–ETH Ratio
Watching this chart closely. In my opinion, once Bitcoin reclaims and flips the green line on the weekly timeframe, the end of the bear market will be confirmed. This would not be a standalone signal. It would align with several other indicators I am monitoring, some of which I have already disclosed inside Premium, together with multiple technical, psychological and fundamental factors I am currently considering. Bitcoin has already reclaimed the weekly MA200. The next major step is to reclaim this green line and hold above it on the weekly close. Once that happens, my next major target becomes $80,000. For now, however, Bitcoin has faced a rejection at this level, while a large amount of liquidity remains around $54,000. That is why my strategy is structured around two completely separate buckets of capital. It is important to understand that I am not mixing these funds.
The first bucket consists entirely of realized profits from the Bitcoin short opened around $120,000 and the more than 100 altcoin shorts I held for approximately nine months. I deployed that entire bucket yesterday and bought Bitcoin at around $64,000. In other words, I converted the profits made during the bear market directly into a long-term Bitcoin position fully.
The second bucket is completely separate. This is capital that was never used in the short positions and remained on the sidelines. I am now deploying this cash gradually. My plan is to invest this second bucket on every day Bitcoin trades between $54,000 and $64,000. Five percent multiplied by 20 purchases equals 100%, meaning the entire amount would be deployed if Bitcoin remains inside this accumulation zone for approximately 20 buying days.
If Bitcoin trades at $64,000, I buy. If it trades at $60,000, I buy. If it falls to $58,000, I buy. If it reaches $54,000, I continue buying at a better price. However, if Bitcoin moves above $64,000, I stop adding the daily 5%. I will not chase the market outside the accumulation zone. After approximately one month, the objective is to hold one large Bitcoin position purchased at around $64,000 using the realized short profits, together with a second position accumulated gradually through disciplined daily purchases. Depending on how deeply Bitcoin trades inside the range, I expect my combined average entry to settle somewhere around the $60,000 region.
From a risk-to-reward perspective, I personally consider my average Bitcoin entry around $60,000 to be phenomenal for the long term. That level is below the previous 2021 all-time-high region, and thats an exceptional position. At the same time, I am following a fixed BTC-to-ETH allocation. For every four dollars I invest in Bitcoin, I invest one dollar in Ethereum. That means for every $100,000 deployed into BTC, I allocate $25,000 to ETH.
Bitcoin remains the dominant position, while Ethereum receives an allocation equal to 25% of every Bitcoin purchase. Ethereum is a separate topic that deserves its own full report, because I am extremely bullish on ETH for the next major market expansion. So the strategy is clear: one bucket of realized short profits has already been fully deployed into Bitcoin at approximately $64,000. The second bucket is being deployed gradually through daily 5% purchases whenever Bitcoin trades between $54,000 and $64,000. For every four dollars invested in BTC, one dollar is invested in ETH.
That is the strategy, my accumulation just started
Join Premium and you will not miss out on what exactly I am buying, what I plan to build, where I place potential long orders and other of my trading targets: https://t.co/oP8wCPuO9J
THIS IS NO FINANCIAL ADVICE BUT EDUCATIONAL CONTENT ONLY
The sky is not the limit.
The limit is the standard you keep accepting.
In life, trading and relationships, most people do not fail because they lack potential. They fail because they keep tolerating weak habits, poor decisions and environments that no longer match where they want to go.
Every new level requires a different version of you.
Different discipline.
Different decisions.
Different circle.
You do not rise to what you want.
You rise to what you are willing to become.
$btc
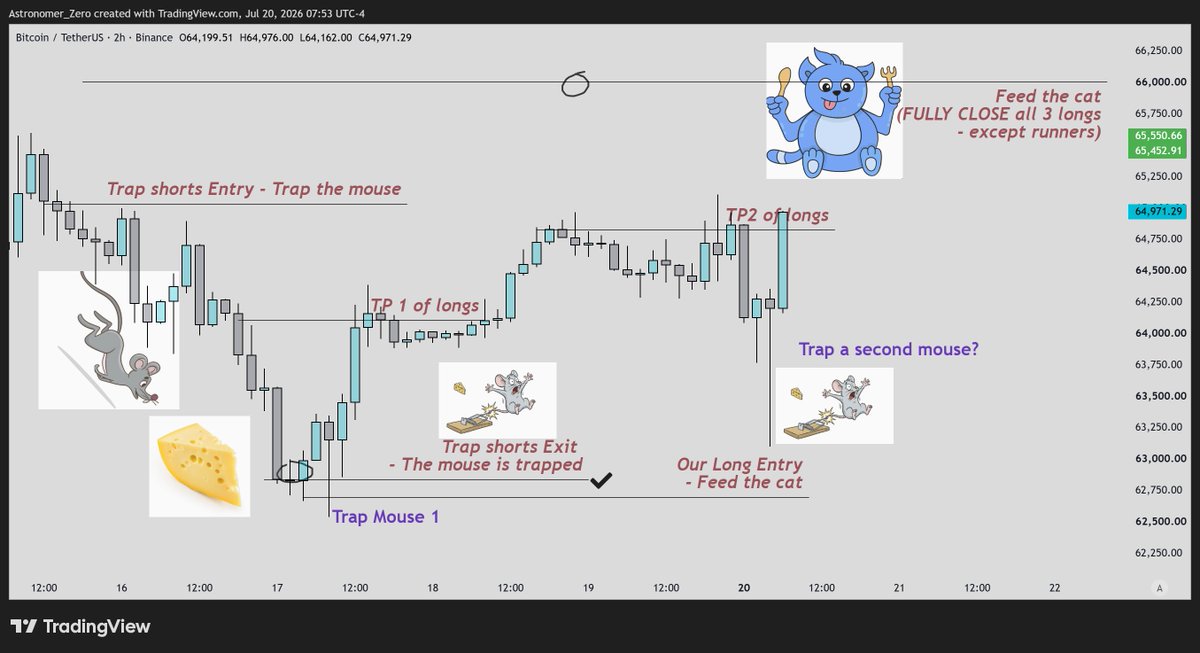
The second mouse is trapped ✅ (on the spot pair).
We're still at 64.8k/65k resistance now.
But technically, the market has reached my second trap targets and should be ready for higher.
Since wick only happened on the spot pair, the rule is that the pair of the delivery of the wick needs to deliver the push.
So we need to see aggression on spot (we need spot premium increase, funding rate decreasing through inventory transfer from longs to spot, and buying imbalances).
If successful, we finally, finally (finally) get paid on our 3 longs at 66k.
$SOL
They refuse to accept that their favorite altcoin will never hit ATHs again.
This was the perfect exit pump FTX needed to offload.
Do the homework on token inflation. Imagine buying an asset when the Solana Foundation can print new tokens out of thin air.
It’s a classic VC driven coin with massive supply concentration in the hands of a few insiders and funds. You think SOL organically went from $7 to $300 cause of "demand" 🤣
How do you realistically attract large buyers when the second you purchase, you instantly become exit liquidity for those same concentrated holders?
Don't hate the player, hate the game. It is what it is. Plenty of major projects died in the 2017–2018 cycle, and we’ll see the same thing happen again and again.
$BTC
It is the 14th tomorrow.
I'm looking for a setup like this. We usually start to see bearish reactions after the 14th, but the RR for taking shorts isn't attractive enough for me to blindly enter without a cleaner sweep.
If we get a setup like this, I'll look for scalp shorts. If not, we could still see the usual bearish reaction after the 14th, but I'll likely sit it out because the RR doesn't justify taking the trade.
$btc
Hourly range retested, and daily range target now entered ✅ TP's taken in last post (slight local sentiment shifts).
The Monday move led us to retest the hourly range high, bouncing us higher into my daily first main target area.
Also seeing some slight "ha, told you the rally in July is coming" type of engagement-oriented posts, backed by some "science" (just one or two data points from prior cycles, pure bias fitting, because again if it didn't happen, it would not have been talked about).
In my opinion a little bit too much of that too early now. So just to remind you that this is contribution to some slightly local bullish sentiment we are seeing now and these posts made before into the lows (as hedges) would never have been talked about if we just went lower from 58k lows, but they are created to keep engagement to their accounts "just in case" we rally.
Indeed nothing but local bullish sentiment contribution. Nothing major and not as big as the bearish sentiment near the 58k lows, but it's an observation, and it validates why I TP'd my second long from higher into my daily first main target area at 64.3k, so that the win is locked in and we can wait patiently for next target which could take some time.
Do not worry though, time is good, time resolves sentiment and your patience is a weapon. But it explains why I believe TP'ing and locking in the W of the second trade is the optimal move of execution today. The trade is up 2.5RR, and no trade up 2.5RR should ever not become a win.