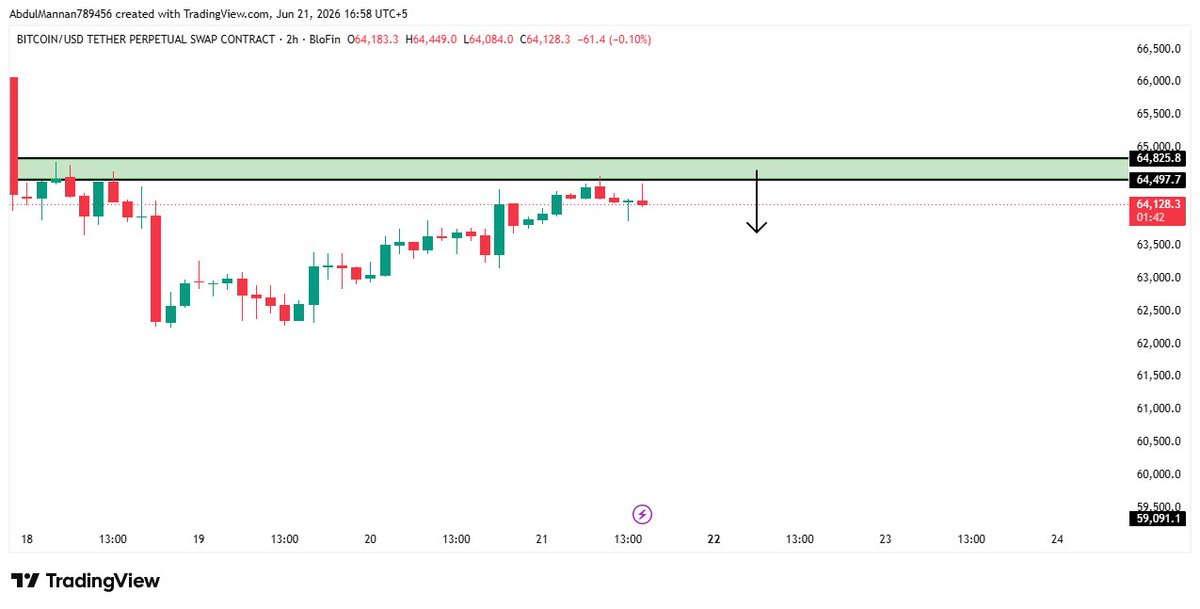
$HYPE up 3.25% and pressing directly into resistance.
Holding a clean bullish structure on the daily above the ema20. but the local uptrend is walking straight into a fresh 1h bearish ob at $71.93-$72.74. same level as the local highs.
Wait for a clean 1h close above $72.75. that confirms the ob is cleared and opens the path toward the next major liquidity pocket above. No close, No trade.
Rejection inside $72.00-$72.74 sends price back toward the $70.50-$70.90 zone. That's the 15m bullish ob and 1h ema20 converging at the same level. much better r/r entry than chasing the breakout here.
$XAUT UPDATE:
Our plan on $XAUT worked out. price dropped right to the immediate local support around $4,125 and gave that clean 1% scalp bounce. after the relief faded, sellers pushed it lower, hitting the macro line in the sand exactly at the $4,077 - $4,090 zone (reaching a local low of $4,084.7) where it is currently trying to form a base.
For now. XAUT is trading at $4,090.7, resting on our macro line in the sand. momentum is heavily bearish on the lower timeframes with the 15m RSI reaching oversold territory (29.0), while we consolidate here.
On the upside:
Any relief rally faces immediate overhead resistance at $4,125 - $4,135. this zone is reinforced by the 1h bearish order block and the 1h ema200 ($4,121) and ema100 ($4,135). we need a clean reclaim here to shift the bias back to the bulls.
On the downside:
the $4,077 - $4,090 zone is the absolute boundary. right below it, we have strong 4h bullish order block support sitting at $4,020 - $4,035.
The game plan:
Bullish validation: if buyers hold the line here and push a clean 4h close back above $4,135, we confirm the structural bottom and target $4,189 and $4,223.
Bearish breakdown: losing $4,077 on a closing basis invalidates the immediate bullish structure, opening the path for a deeper sweep back to the macro $3,957 - $4,014 lows
Save this chart.
Divergences at this timeframe don't trigger overnight. They build. And by the time most people notice them the move is already halfway done.
The last time $btc printed this exact weekly rsi divergence structure it rallied 92.44% 🔥 in the following weeks.
july 2022. $btc was consolidating between $18k and $20k following the collapse of celsius and three arrows capital.
Sentiment was at cycle lows. the weekly price action printed two equal lows while the weekly rsi simultaneously made higher lows — an identical divergence structure to what is forming now.
$BTC is quietly flashing the same weekly signal that preceded a 92% move. Nobody is talking about it.
Weekly chart is printing one of the most reliable bullish signals in technical analysis. Aweekly rsi divergence.
Price is making equal lows around $60k-$59k on the weekly. Two touches. same level. but the weekly rsi is making higher lows while price stays flat.
$hype looking heavy at $66.46.
We've officially lost the 1h ema200 ($66.71) on rising sell volume, and the 4h macd is printing a nasty bearish cross. momentum is fully shifting to the bears after a clean double top structure triggered, failing to clear the local high and rolling over from $72.78.
Expecting further bleed. my golden long-term load zones are:
- $49.75 - $47.90 (around the daily ema100 macro support)
- $38.50 - $41.00 (heavy daily bullish order block confluence)
- $24.73 - $25.82 (daily bullish breaker block)
$ETH ANALYSIS
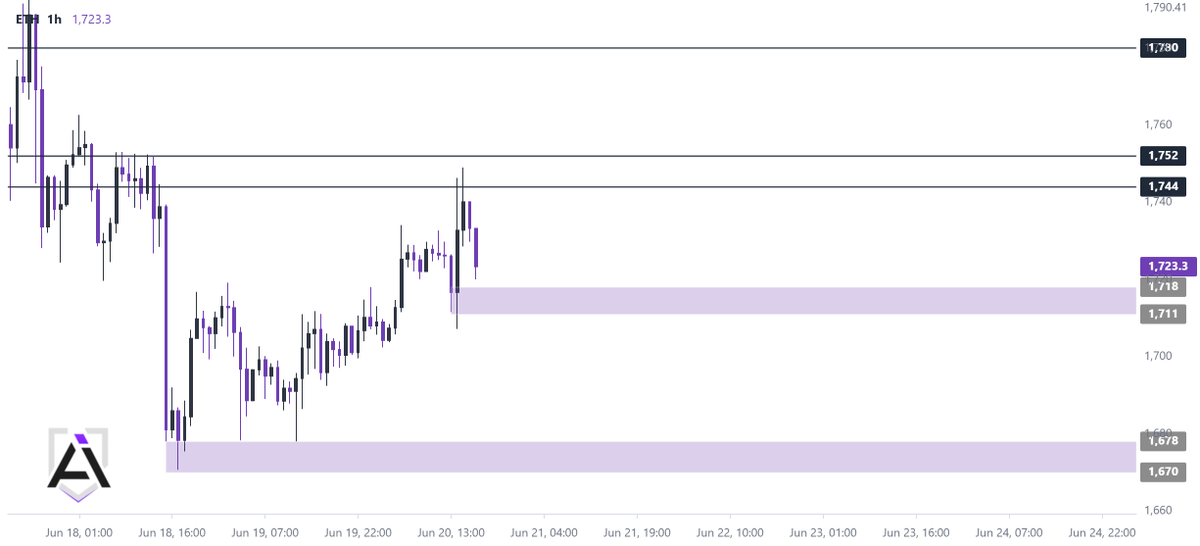
$ETH is holding a short-term bounce structure around $1,728.
On the 15M/1H, price is trading inside the 1H bullish block at $1,711–$1,726, with immediate EMA support clustered around $1,718–$1,724. As long as ETH holds this zone, short-term momentum still favors buyers.
The issue is HTF resistance.
ETH is still capped by the 4H EMA100 at $1,752 and the daily EMA20 at $1,776. Until those levels are reclaimed, this is still a tactical long setup, not a confirmed macro reversal.
Momentum is improving: 1H RSI is at 59, 1H/4H MACD are printing bullish crosses, and funding is neutral at -0.0005% with OI flat at 698K. No overheated leverage yet.
Key support below sits at $1,711, then $1,670–$1,678.
Simple view: hold $1,711–$1,718 and ETH can push higher. Lose $1,698 and the 1H bullish structure is invalidated.