$Q Open Interest Is Exploding 🚀
So guys, both charts are showing a major shift in $Q market activity. Open interest on Binance has surged sharply toward $50M while the price has climbed near $0.12. At the same time, trading volume shows several major spikes across Asian, European and US sessions.
This suggests that market participation and speculation are rising fast. If buyers maintain control, $Q could continue pushing higher. But with leverage building up, a sharp reversal could trigger massive liquidations in either direction.
Watch whether open interest stays elevated and volume supports the move. High activity creates opportunity, but volatility is increasing too.
NFA. DYOR
👀 $Q Liquidity Is Building at Key Levels
Guys, $Q saw a sharp pump toward $0.20 before pulling back hard. The liquidation heatmap shows major liquidity zones around $0.14–$0.16, while $0.10 also looks like an important area to watch.
Price could move toward these liquidity zones, but volatility remains high. Let’s see which level gets tested next.
NFA. DYOR
$Q Sellers Are Still In Control 📉 kindly take your necessary step cordially 🙏
$Q is showing bearish pressure, with the price struggling to recover. The order book indicates resistance overhead, while the broader trend remains weak.
If buyers defend the $0.0575–$0.0582 support zone, a bounce toward $0.0600–$0.0630 could happen. But losing support may open the door to further downside.
Watch for a clear breakout before entering. NFA. DYOR
I Just scrolled down and noticed some people who have a massive fan they discussed about $STRK that it's ready for buy again. Should we buy again really? 🫣
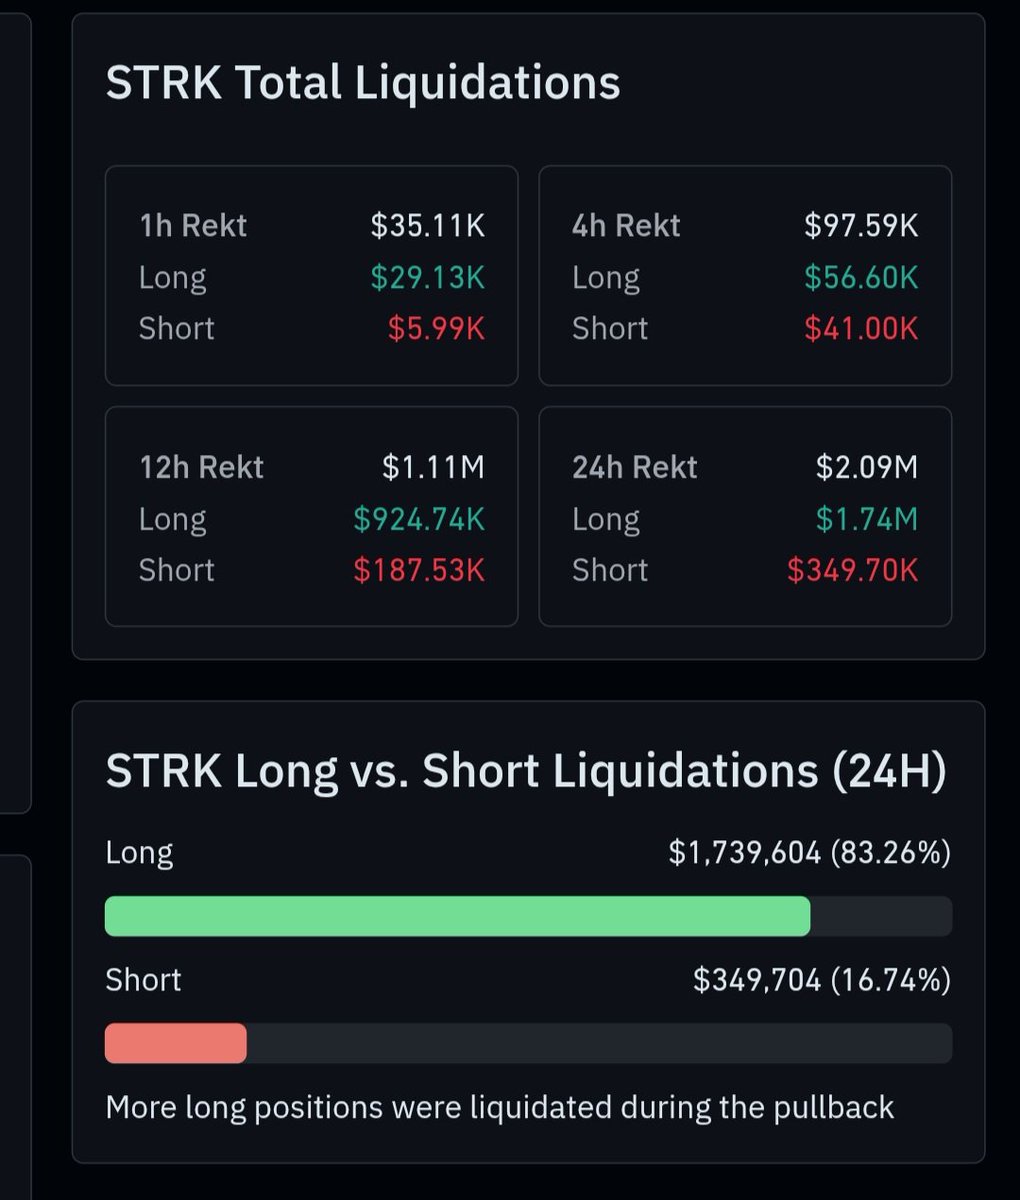
Around $1.74M in long positions were liquidated in the past 24 hours, compared with $349.7K in shorts. That means over 83% of liquidations came from long traders.
This signals strong selling pressure during the pullback. If weakness continues, $STRK could face further downside, while a recovery depends on buyers stepping back in.
Watch the next price reaction closely.
NFA. DYOR
Whale Money Is Flowing Into $Q 👀
$Q is showing a massive spike in futures net inflows, reaching around $60M+ in the latest move, while price surged toward $0.12.
This suggests strong capital activity and rising market interest. If inflows continue, bullish momentum could extend. But a sharp spike can also attract profit-taking and increase volatility.
Watch whether $Q can hold its gains or if the inflow pressure starts fading.
NFA. DYOR
That's the update ome that i got right now👏💯
$Q Whale Activity Is Heating Up
So guys, $Q surged from around $0.10 to nearly $0.20 before facing a sharp rejection. Price is now near $0.163, showing strong volatility and possible profit-taking.
Whale orders are concentrated around $0.18–$0.20, creating a key resistance zone. If buyers reclaim $0.18, another upward move could follow. But losing $0.15 may open the door to a deeper pullback.
Watch how price reacts around these levels before taking a position.
NFA. DYOR
$Q Short Squeeze Is Getting Serious 🚀. It's ruined many people’s entire savings within a day😓
So guys, $Q has recorded $8.99M in liquidations over 24 hours, with short positions accounting for $6.64M (73.83%).
The largest single liquidation reached $352,563, while the peak liquidation hour was 14:00–15:00 on October 19.
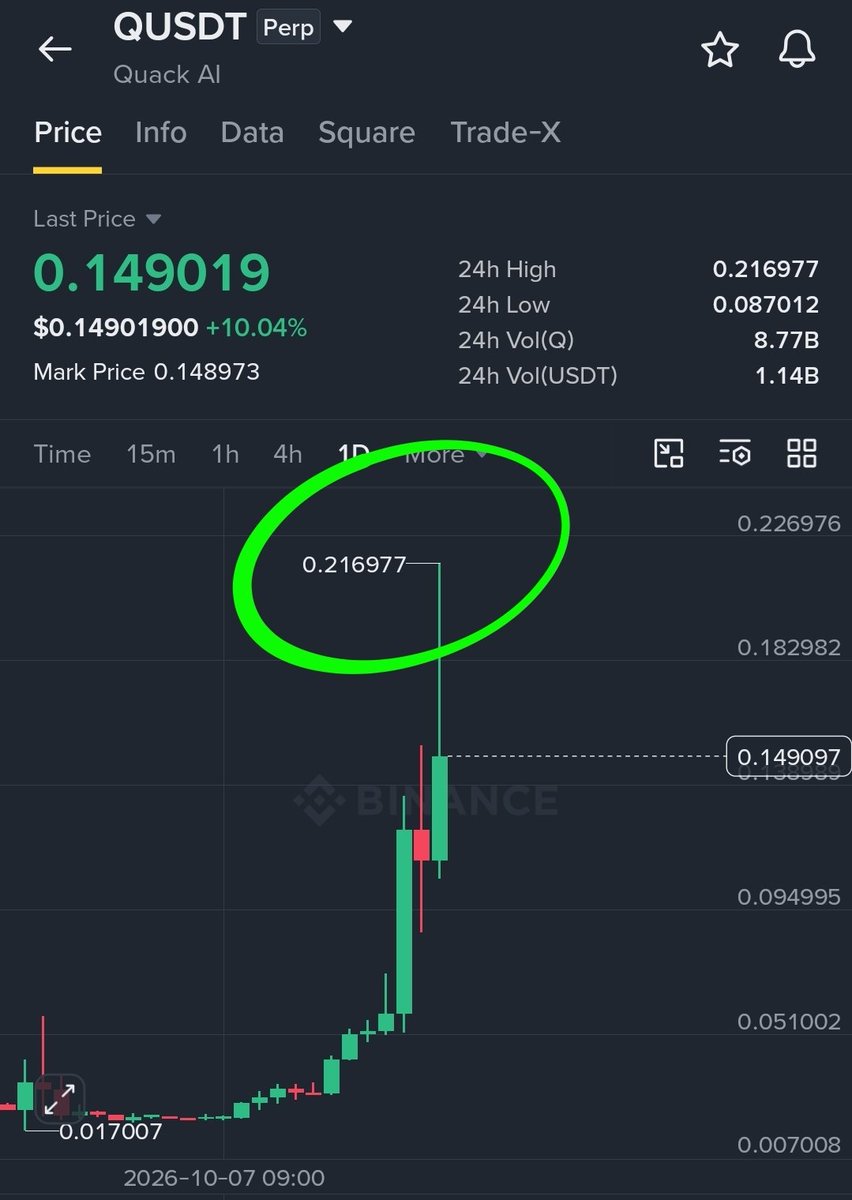
Price surged to $0.216977 before pulling back to around $0.149, showing strong volatility. If buying pressure continues, another squeeze could happen, but profit-taking may trigger a sharp correction.
Watch whether $Q holds its momentum before chasing the pump. NFA. DYOR
$STRK Sellers Still Have Control 📉 So in order to pull it up plenty of buying pressure needed. So be careful 🚨
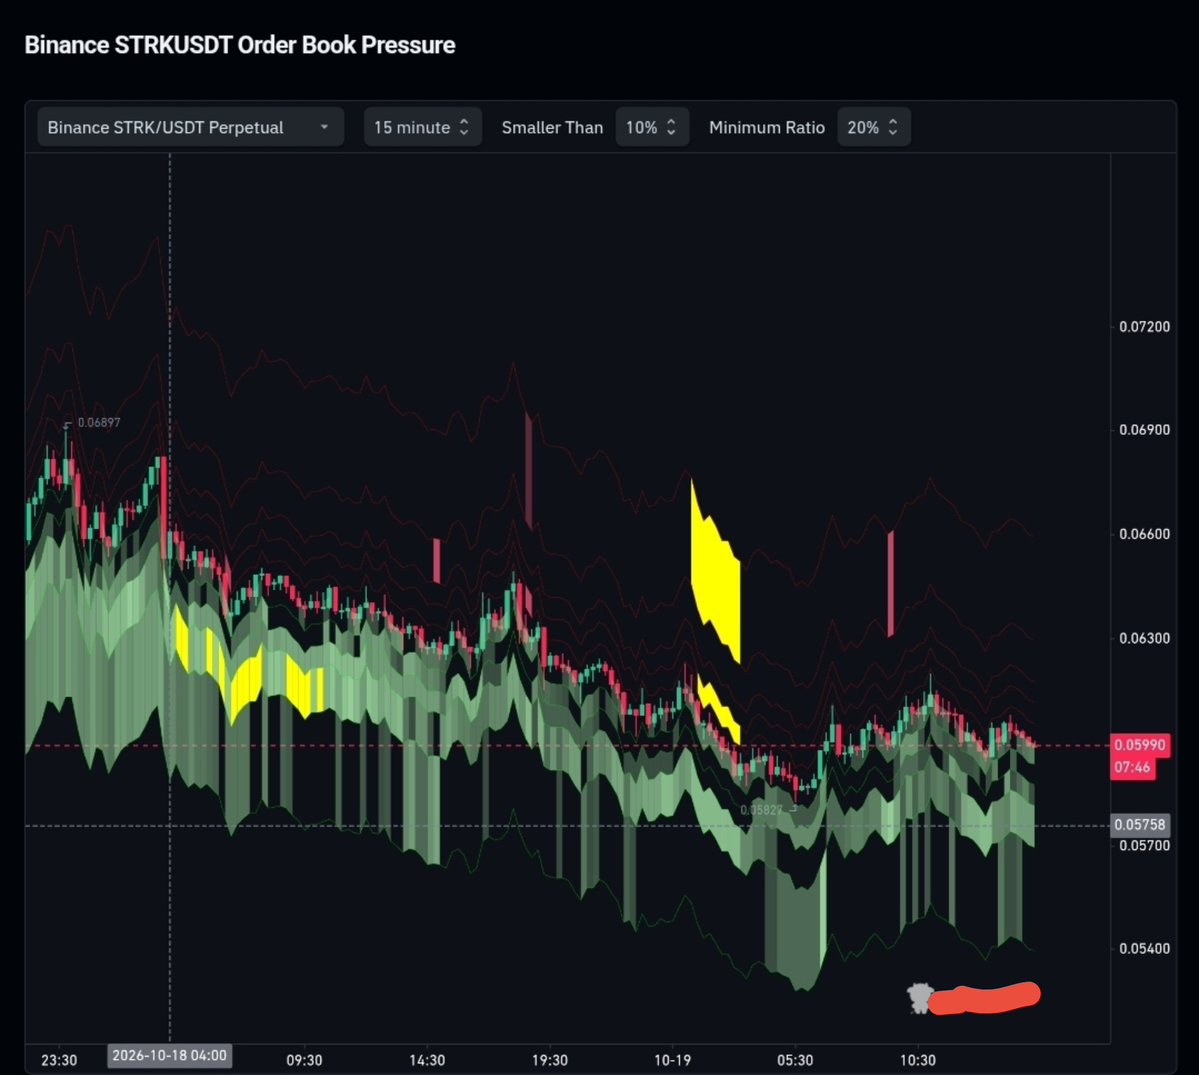
$STRK is trading around $0.05990, with the order book pressure chart showing a broader downtrend. Selling pressure remains dominant, while the $0.05758–$0.05827 zone is an important support area.
If support breaks, further downside is possible. A recovery above $0.063 could signal improving bullish momentum.
Watch how price reacts around support before making a move. NFA. DYOR
$STRK Whales Are Accumulating While Price Struggles.
The chart shows a major divergence in $STRK. Whale vs retail delta has remained mostly positive, while the token price has fallen sharply from above $2 to near its lows.
This could suggest stronger buying activity from large players despite weak price action, but it doesn't confirm accumulation on its own.
If buying pressure continues, a recovery may follow. Otherwise, $STRK could remain under pressure.
Watch whether whale activity stays positive and price starts responding. NFA. DYOR
$STRK is showing a sharp spike in open interest, suggesting fresh speculative activity is entering the market. 📊
However, the price remains far below its $3.66 ATH, and the recent 31.05% single-day drop highlights the risk of volatility. If buyers regain control, a recovery could follow, but a breakdown may trigger further downside.
Watch whether rising open interest is supported by sustained buying pressure or leads to another liquidation move.
NFA. DYOR
$Q Liquidity Zones to Watch ⚡
The liquidation map shows major liquidity clusters around $0.10–$0.106 and $0.143–$0.15. A move into either zone could trigger volatility and liquidations.
A breakout above $0.143 may attract further upside, while rejection could lead to a pullback. Watch price action closely.
NFA. DYOR
$Q Liquidity Is Building Above Price 🚀
So guys, $Q has made a sharp move from around $0.11 toward $0.16, potentially triggering short liquidations along the way.
The liquidation heatmap shows major liquidity zones around $0.14–$0.145 and higher near $0.16–$0.18. These areas could attract price if bullish momentum continues.
On the downside, $0.10–$0.105 remains an important support zone. If buying pressure weakens, a pullback toward this area is possible.
Watch whether $Q can hold its breakout or faces rejection near the next liquidity zones. Liquidity levels are potential targets, not guaranteed price movements.
NFA. DYOR
That's an OI chart of $ARIA. The overall things i must say $ARIA strongly need buying volume. Otherwise it's on uder risk by the way.
Though OI is increasing but still price remain same. So wait for the next move that i want to say🙏
$ARIA Bulls Are Fighting Back, But Sellers Still Have the Edge ⚖️
$ARIA has shown a sharp price rebound, while the 4H futures data tells a mixed story. Short volume stands at 51.15% ($25.65M), slightly above long volume at 48.85% ($24.50M).
This suggests selling pressure is still present, but the gap is small. If buyers maintain momentum, $ARIA could continue recovering. However, renewed selling could push the price lower again.
Watch whether buying volume increases and the long/short balance shifts in favor of bulls.
NFA. DYOR
Another token i found it's interesting 💪👏.
I said interesting but don't open a long position in here. Let me research of several parts then I'll let you know🙏
$ARIA Lost Nearly All Its Momentum 📉
$ARIA once reached an all-time high of $1.145, but the chart shows a massive collapse. Its largest single-day loss was 84.03%, and the price is now around $0.051.
This reflects extreme volatility and heavy selling pressure. A recovery is possible, but $ARIA needs strong buying volume and sustained price strength to show a meaningful reversal.
Watch for stabilization before assuming the bottom is in.
NFA. DYOR
$Q Buyers Are Taking Control 🚀
$Q is up 18.46% on the 1H chart, with a strong green candle pushing price toward $0.149. The liquidation chart also shows a major spike in green liquidations, suggesting short sellers may be getting squeezed.
If buying pressure continues, $0.15–$0.16 could be the next resistance zone. However, after such a sharp move, a pullback toward $0.13–$0.14 is also possible.
Watch whether $Q can hold its breakout before chasing the pump.
NFA. DYOR
$Q Whales Are Driving a Powerful Breakout
$Q has surged from around $0.11 to $0.145, breaking above several resistance levels. Large sell orders are visible near $0.15–$0.20, which could create selling pressure.
📈 Holding above $0.14 may support further upside toward $0.15.
A rejection near resistance could trigger profit-taking. Watch whether buyers can sustain this momentum.
NFA. DYOR
📈 **$Q Bulls Are Gaining Control**
The $Q long/short ratio has turned more bullish as price climbs sharply toward $0.13. Buyers appear to be gaining momentum, but the sudden rally also increases the risk of profit-taking.
🚀 If buying pressure continues, $Q could push toward new highs.
If long positions become overcrowded, a sharp pullback could follow. Watch whether buyers can sustain this momentum.
NFA. DYOR