Smiling Friends, what does it mean? Smiling Friends, you were my everything! World’s fucked up, man. Smiling Friends, am I losing my GODDAMN mind? If it’s gone, where will I find… it? 🫳🎤
Ya no descargues vídeos de YouTube con aplicaciones que pueden contener virus. Hazlo usando Python con los módulos pytube y moviepy. Con este script puedes descargar el vídeo en formato MP4 y luego separarlo en MP3 de manera más rápida y segura, sin riesgo de virus.
🎯 ¡Buscar TRABAJO en el SECTOR FINANCIERO es a veces una verdadera ODISEA!
📋 Páginas de RECRUITING en las que RELLENAR los mismos DATOS cada vez y que son DESESPERANTES...
🤯 No obstante, te traigo el TRUCO DEFINITIVO para AHORRARTE HORAS en FORMULARIOS (vas a filpar...)
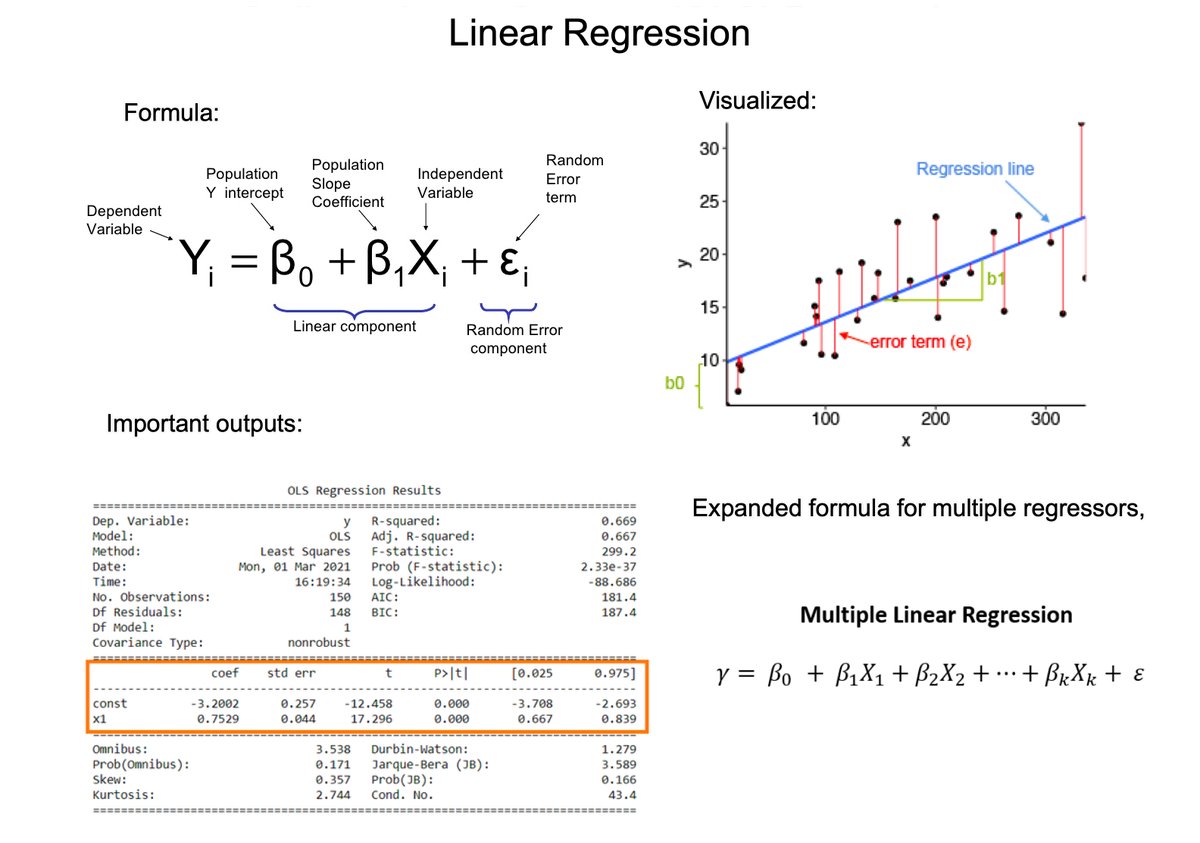
Linear Regression is one of the most important tools in a Data Scientist's toolbox. Here's everything you need to know in 3 minutes.
1. OLS regression aims to find the best-fitting linear equation that describes the relationship between the dependent variable (often denoted as Y) and independent variables (denoted as X1, X2, ..., Xn).
2. OLS does this by minimizing the sum of the squares of the differences between the observed dependent variable values and those predicted by the linear model. These differences are called "residuals."
3. "Best fit" in the context of OLS means that the sum of the squares of the residuals is as small as possible. Mathematically, it's about finding the values of β0, β1, ..., βn that minimize this sum.
4. Slopes (β1, β2, ..., βn): These coefficients represent the change in the dependent variable for a one-unit change in the corresponding independent variable, holding other variables constant.
5. R-squared (R²): This statistic measures the proportion of variance in the dependent variable that is predictable from the independent variables. It ranges from 0 to 1, with higher values indicating a better fit of the model to the data.
6. t-Statistics and p-Values: For each coefficient, the t-statistic and its associated p-value test the null hypothesis that the coefficient is equal to zero (no effect). A small p-value (< 0.05) suggests that you can reject the null hypothesis.
7. Confidence Intervals: These intervals provide a range of plausible values for each coefficient (usually at the 95% confidence level).
Understanding and interpreting these outputs is crucial for assessing the quality of the model, understanding the relationships between variables, and making predictions or conclusions based on the model.
====
Need help applying data science to business?
I'd like to help. Here's how:
👉 My Free 5-Day Course (How to Solve Business Problems with Data Science): https://t.co/YXG4pL97ZN
👉 Learn ChatGPT for Data Science (Live Workshop): https://t.co/EaMpKrJiqX
If you like this post, please reshare ♻️ it so others can get value (follow me, 🔥 Matt Dancho 🔥 for more data science concepts).