⚠️ VOLUME ⚠️
The higher the volume(24H), the better the probability of you succeeding with your chosen setup. Trading bots run the markets, and ~80% of all trading volume is generated by bots that institutions own. It's our job to understand how they are programmed to ride the wave alongside them.
If you use MEXC, you can use this link to find the top trading volume coins 👉 https://t.co/5pb3ZFGx7U
Or, if you want to find a specific coin and you don't use MEXC, go on CoinMarketCap> Search up your coin > click on perpetual (in between spot and futures). This will then tell you the current volume of your chosen coin for each centralised exchange.
CMC 👉 https://t.co/iuWsss6mzE
I tend to trade coins >30M volume, but if you find a clean setup that hits your requirements or is (semi)optimal and has very low volume (1M - 10M), then don't be afraid to take the trade.
That is the same fear that will ruin you in the long run.
If the volume is low, then you can decide whether you want to risk less. Volume constantly changes and tends to increase as it approaches HTF key levels.
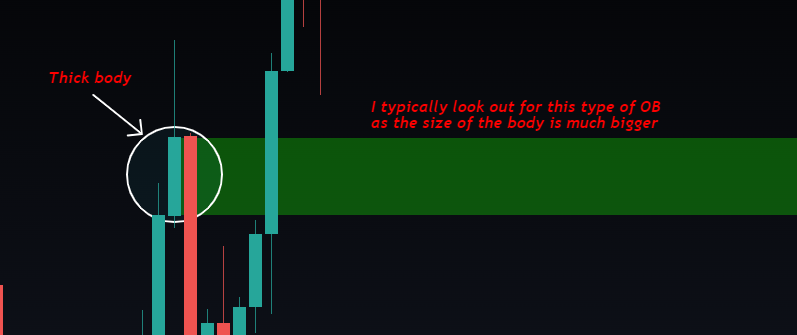
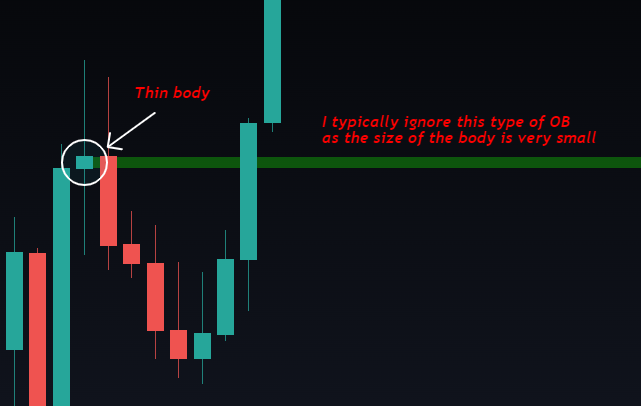
The size of the candle body is very important too, as it will tell you if the setup has significant volume. You want to look out for the candles that show a bigger candle body with small wicks. However, wicks can be printed in a very short amount of time, hence why it can be seen as manipulation, so concentrate on the candle bodies.
I know some people still trade tiny candle bodies, so you can decide whether you like trading them or not.
The thicker the body, the more volume it holds.
The higher the TF, the more likely PA will reverse at that level, as there is higher trading volume. A 1W candle represents more volume than a 1D candle and a 1D candle represents more volume than a 4H candle, leading to fewer false signals.
A LTF candle body does not hold the same volume as a HTF candle body.
Institutional trading volume will be shown on the HTF candle bodies. That is where MMs focus, as the liquidity remains in those bodies. The same liquidity that will convert their assets into cash. You need to play alongside the 🐳's if you want to be profitable.
Also, watch the top 100 coins with high trading volume (typically dino coins). If most of them haven't hit their HTF key optimal levels, then the bottom for alts probably isn't in yet. When most have taken their HTF liquidity, the accumulation/distribution phase is probably nearly done. Don't get stuck on the alts with lower trading volume, as those alts will not be the reason for a HTF reversal.
MoneyTaur - "The reversal is likely to happen when at least 75% of the highest trading volume coins reach their HTF 🔑 levels"
Also, if many high trading volume altcoins are breaking out at the same time, it may not be a good idea to short or long levels, as you will be fighting against a strong trend.
Don't be afraid to trade on the weekends. Yes, there is lower volume, but this allows the moves to happen much faster. If you know where to enter and to place your SL, with your targets already set, then there is nothing to worry about and you'll be profitable. There is also a higher probability of scam wicks causing many to be stopped or liquidated, but with a proper strategy, you should be able to avoid those situations.
Volume Spread Analysis (VSA)
VSA is when you study PA with its corresponding volume, as volume helps to validate PA or to identify divergences by using the spread of a candle body and the size of the volume. For example, big movements require high volume and small movements require low volume. On your chosen TF, check the average volume size for a widespread or narrow spread candlestick in historic PA and compare with the candlesticks that you see today.
Traders can track down the smart money movements by using VSA. Price can be manipulated, but volume can't.
When there are big movements with low volume and small movements with high volume, this shows us a divergence and we should pay attention to what is going on in the current market. This tends to happen at reversals.
Big institutions will cover up such divergences by releasing bearish news in big downtrends and bullish news in big uptrends.
It takes effort for the market to rise and to fall and the volume should represent a high/average volume bar to validate such movements.
When using VSA, identify where you are in the trend. Are you in the middle of a trend where you can experience minor pullbacks in the longer-term trend? Or has the market been trending for some time and you're at a possible turning point, which can lead to a major reversal?
Spread is the difference between the opening and closing of the price (candle body). Candles can have a narrow spread (small candle body) or a wide spread (large candle body).
Volume is the frequency of transactions of the price change during a specified period (selected TF). Bearish volume will be marked in red, showing bearish activity and bullish volume will be marked in green, showing bullish activity and the volume action can be low or high.
This gives four possible scenarios:
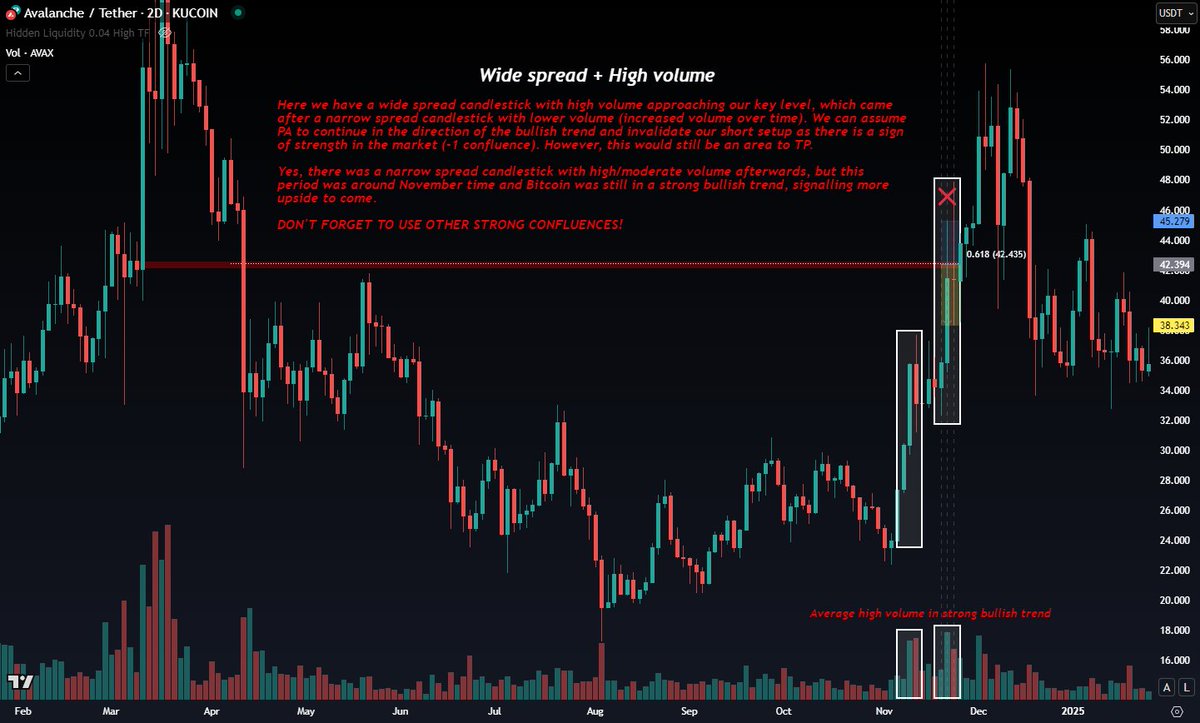
▫️ Wide Spread + High Volume
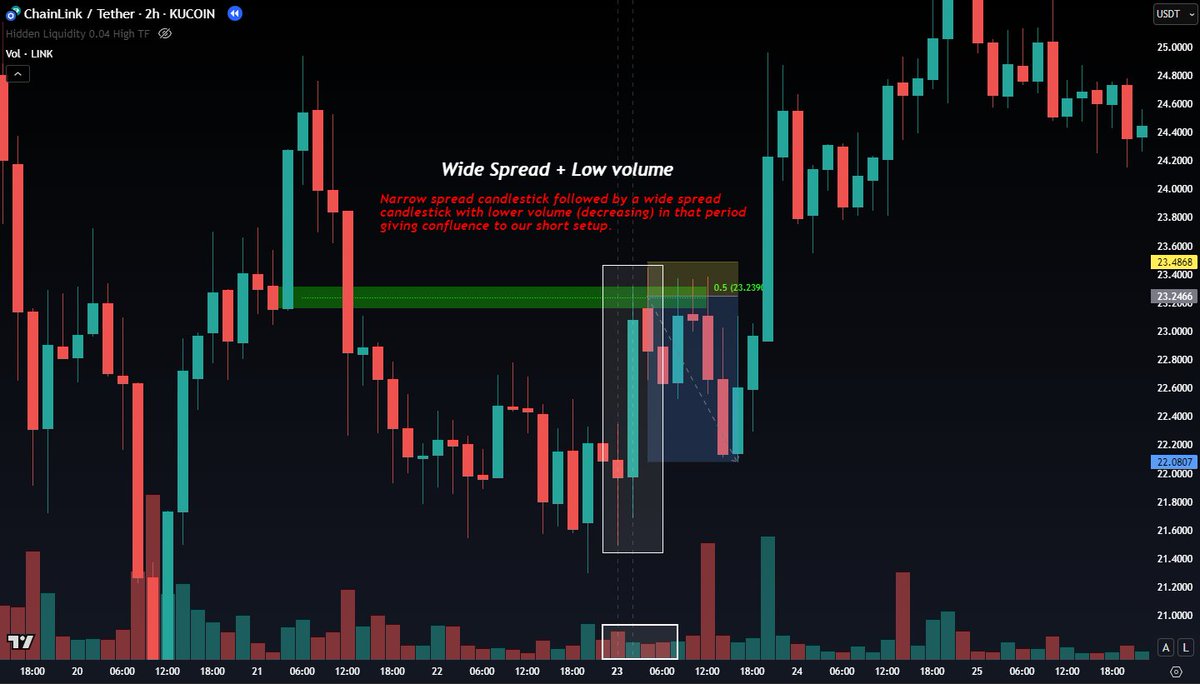
▫️ Wide Spread + Low Volume (divergence)
▫️ Narrow Spread + Low Volume
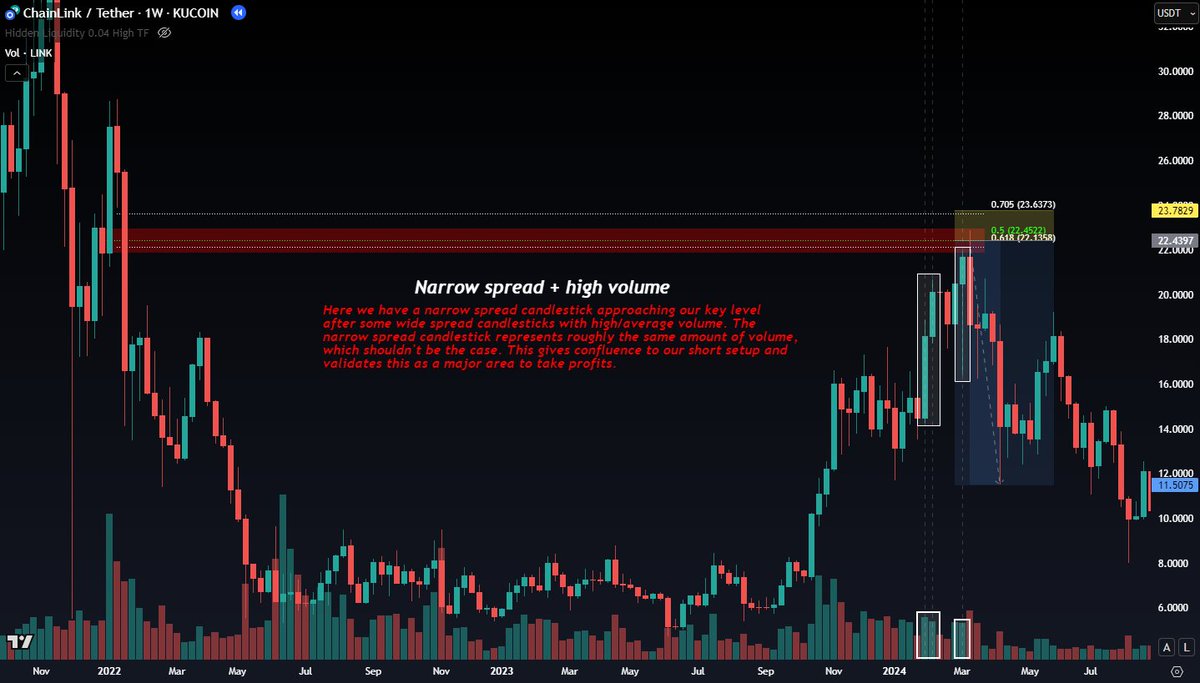
▫️ Narrow Spread + High Volume (divergence)
These scenarios can help us interpret whether to approve or disapprove a setup. However, it should never be used alone and you should always seek to combine such tactics with other strong confluences.
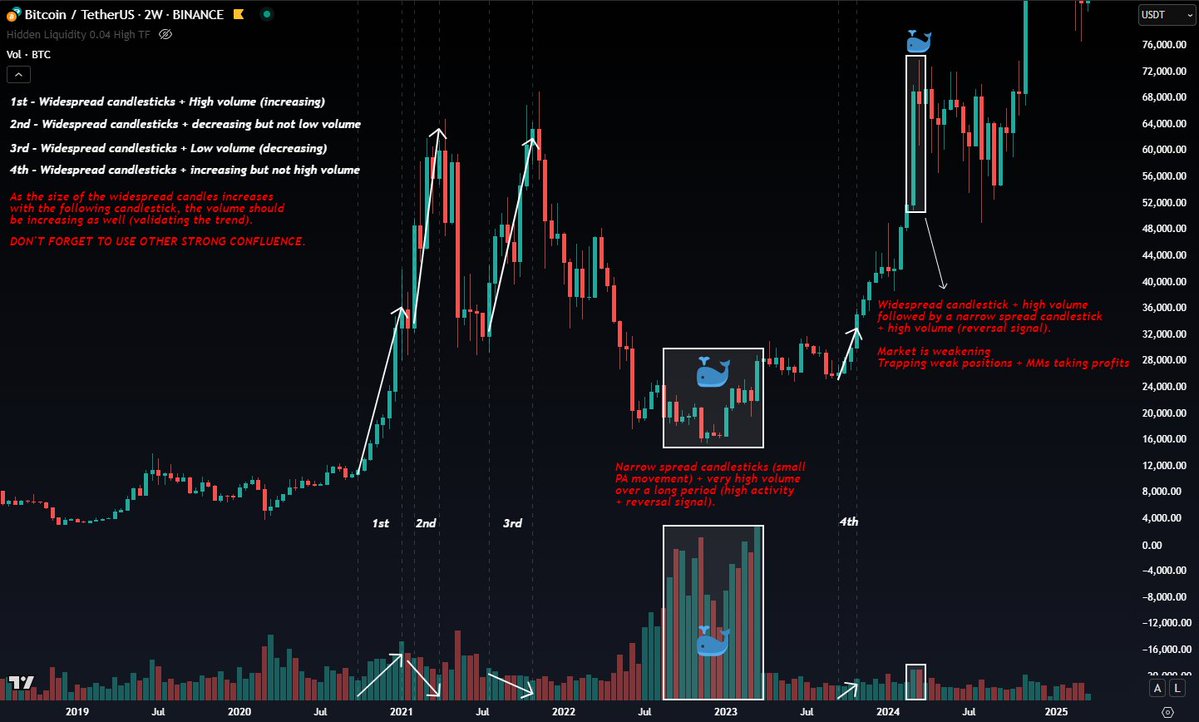
If we have widespread candlesticks and high volume (increasing volume), then we can assume a continuation in the direction of the current trend.
If we have widespread candlesticks and low volume (decreasing volume), then we can assume a reversal is due, going against the direction of the current trend.
If we have a narrow spread candlestick and low volume, this is expected as there aren't big price movements (the market is ranging), then we can assume PA will continue or reverse. With other confluences (key level, fibs and MS), you can better judge whether the price will reverse or continue higher.
If we have a narrow spread candlestick and high volume (increased volume), then we can assume a reversal is due, going against the direction of the current trend. This signal tells us that the market is weakening and this signal tends to develop at the top of a bullish trend or the bottom of a bearish trend (More demand than supply or vice versa).
High volume is only expected in widespread candles, so when it happens in a narrow spread candle, we can assume something is going on in the market (high activity 🐳). One side of the market is aggressively attacking the other (attackers are successfully absorbing).
At supply and demand on the HTF, you will most likely see widespread candlesticks with high volume shortly after the reversal, as we will start to see continuation of bearish/bullish candlesticks going in the same direction.
Short-term trade setup (uptrend scenario)📈
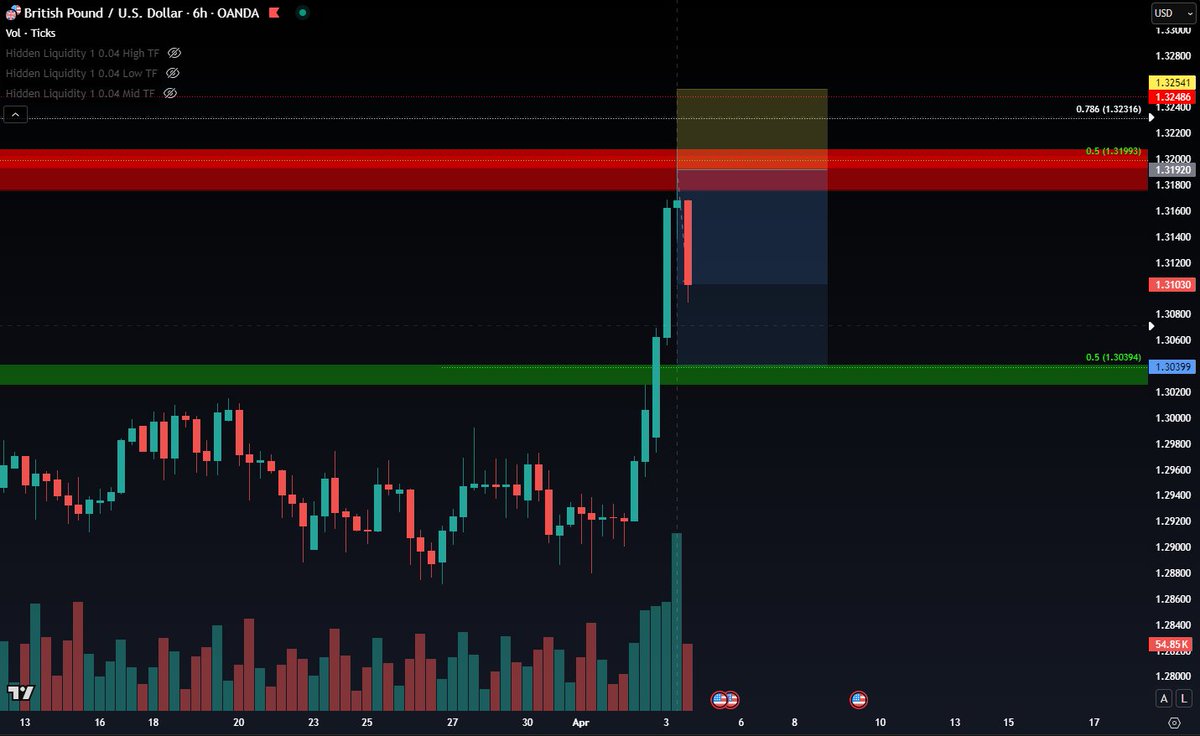
If we are approaching a key level for a short/sell and we have widespread candlesticks going towards the key level with increasing (high) volume, that would be a -1 confluence to invalidate your short setup, but still take profits. Sign of strength.
If we are approaching a key level for a short/sell and we have widespread candlesticks going towards the key level with decreasing (low) volume, that would be a +1 confluence to validate your short setup and take profits (reversal). Sign of weakness.
If we are approaching a key level for a short/sell and we have narrow spread candlesticks going towards the key level with decreasing (low) volume, that wouldn't be a +1 or -1 confluence as the PA could continue or reverse. Use other strong confluences (Key levels, MS, Fibs) to judge whether the price will continue or reverse. If you have strong confluence, then it could be enough to reverse the PA.
If we are approaching a key level for a short/sell and we have a narrow spread candlestick going towards the key level with increasing (high) volume, that would be a +1 confluence to validate your short setup and take profits heavily (major reversal incoming).
Examples are down below in the comment section 👇
(Nothing changes for the idea of a buy/long setup)
In a downtrend, a narrow spread candle with high volume is a major buy signal.
In an uptrend, a narrow spread candle with high volume is a major sell signal.
I try to make these topics as friendly as possible and it does take some time out of my day, so if you want me to provide more educational posts, please like and repost so they can reach more people 🙏
If you have any questions, put them in the comments below 👇
Hidden Order Blocks getting frontran.
"I do think I have found something interesting regarding the frontrun of the level." ~ May 23rd
I've seen Hidden Order Blocks (HOBs) getting frontrun a lot lately. Two good examples were the $FART and $SHIB trades I shared. Those were very clean, high probability trade ideas which would have led to a combined 25RR.
I was annoyed that I missed these trades, but a couple of questions came to mind.
Why were these levels frontran? What did I miss? What can I do about it? Am I just unlucky?
I started digging into what happened in price action and looked back at trades where I got frontrun. What I've found was actually quite simple.
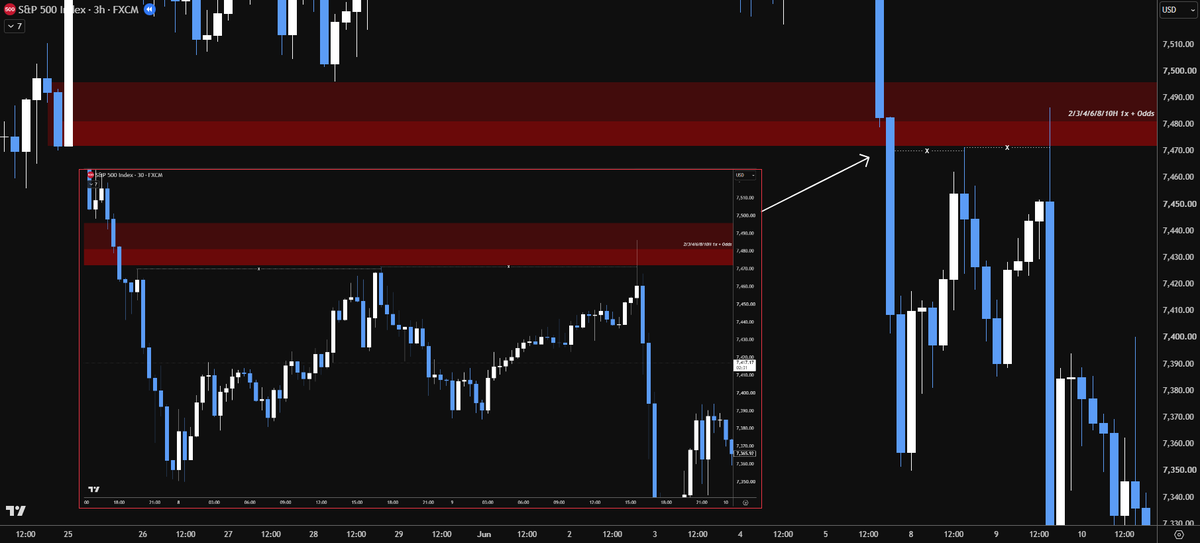
I've found that the levels get frontrun by liquidity grabs. These liquidity points are created closely after the HOB has been created. When price then approaches the HOB, it might just take the liquidity point and leave your HOB untouched.
I'll show two examples to give you a better understanding of what I'm seeing.
First example $IMX:
There was an HTF level I was watching for a short, but price never reached the level. Looking back at it, you can see in the zoomed-in part that there was an MTF swing created after the HOBs. When price approached the HOBs, it only took the liquidity point (with a 3 drives pattern), and rotated back down towards the range low without ever touched the HOBs.
Second example $SPY:
This example shows a bit of a different story. In this case the HOBs got frontrun again. Price took the liquidity point after the HOB creation and gave a decent reaction to the downside. Price, however, came back for the HOB and moved down with a more significant reaction.
So yes, a HOB might get frontran by a liquidity point, but that doesn't mean it won't touch the HOB. For me, this just means that I will lower my limit order towards the liquidity point that is created after the HOB creation (or market order when the liquidity point has been grabbed). This will result in a slightly lower RR, but in my opinion that's better than getting frontran on high probability trades.
I'd recommend checking out the $FART and $SHIB frontruns yourself. The levels are shared below, up to you to find the liquidity points.
$SHIB:
Check the quoted post.
$FART: https://t.co/xlivNZRSa0
⚠️ Decoding Moneytaur ⚠️
The BCHUSDT chart was chosen.
🔸The setup idea was to trade a breakout into the Monthly Partial Breakerblock at 520.
🔸As a primary continuation level, one can use the MTF (11H + 2H + ...) order blocks. However, to increase the RR, rather than targeting the MTF OB itself, one can target potential price wicks into the LTF OB below, within the MTF wick.
🔸Going into the lower timeframe, the first LTF order block is a 15 minute order block.
🔸To refine it even further, one can go into the timeframes between 2 and 7 minutes to find order blocks hidden between two FVGs. This refined level also aligns perfectly with the previous S/R level and is nearby the EQ of the 15-minute order block.
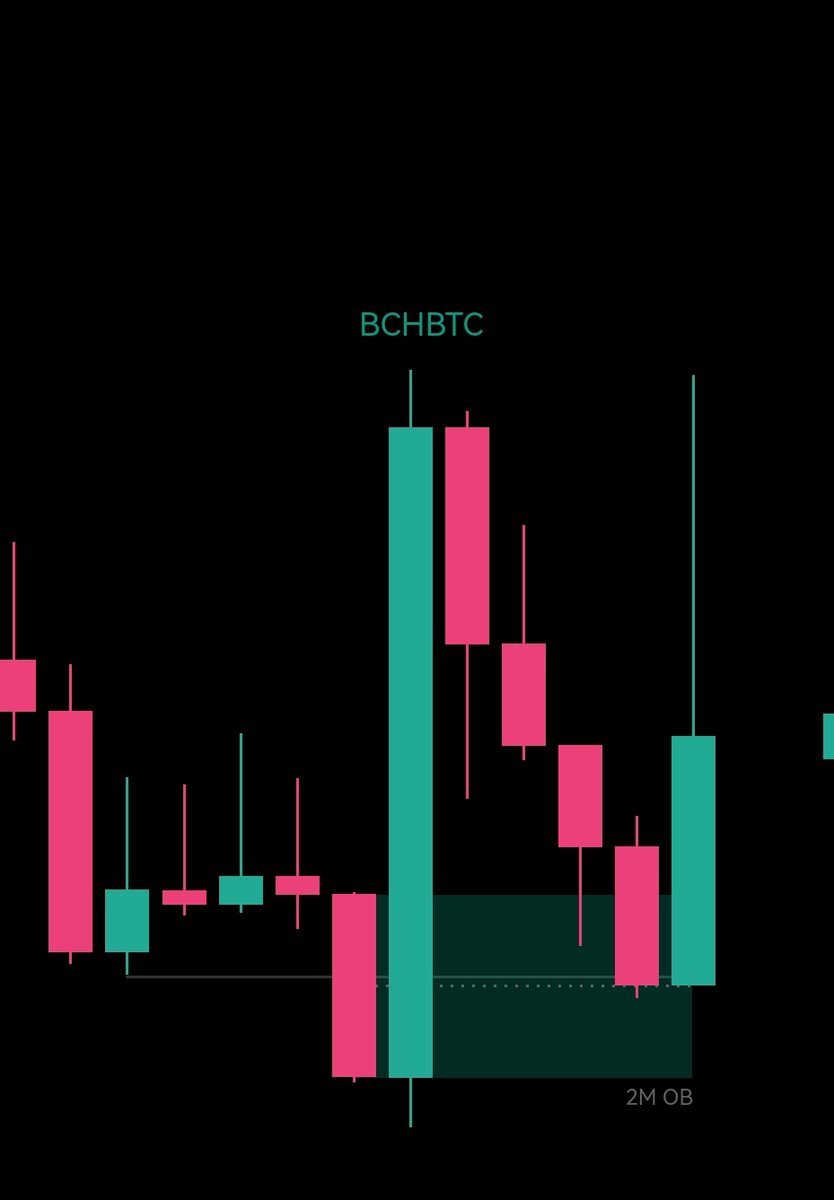
🔸Now, some might ask why MT would long a level in premium. When looking at confluence charts, such as the BCHBTC chart, one can see that price was within a 2M order block during this breakout. He probably used this as additional confluence for the breakout.
If you enjoyed this Post:
1. Like and RT
2. Follow me @OverlordEins for more
If you have any questions put them in the comments below👇
Entry Zone Rule
Today I want to talk about a topic that keeps coming up because many people still don’t seem to understand my posts. So here is another explanation of how my entry system works.
Whenever I have a fresh supply or demand zone, I always scale into the full position. This means that the deeper price fills the zone, the more margin I allocate to the trade.
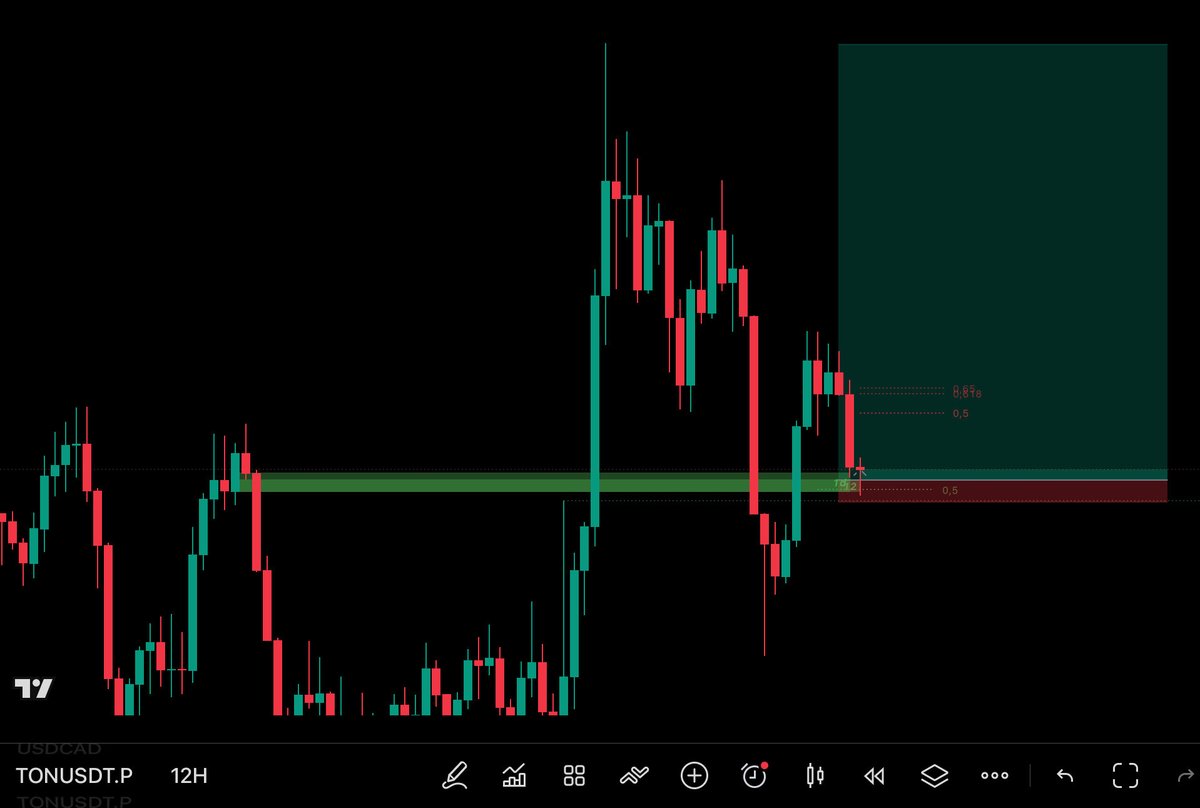
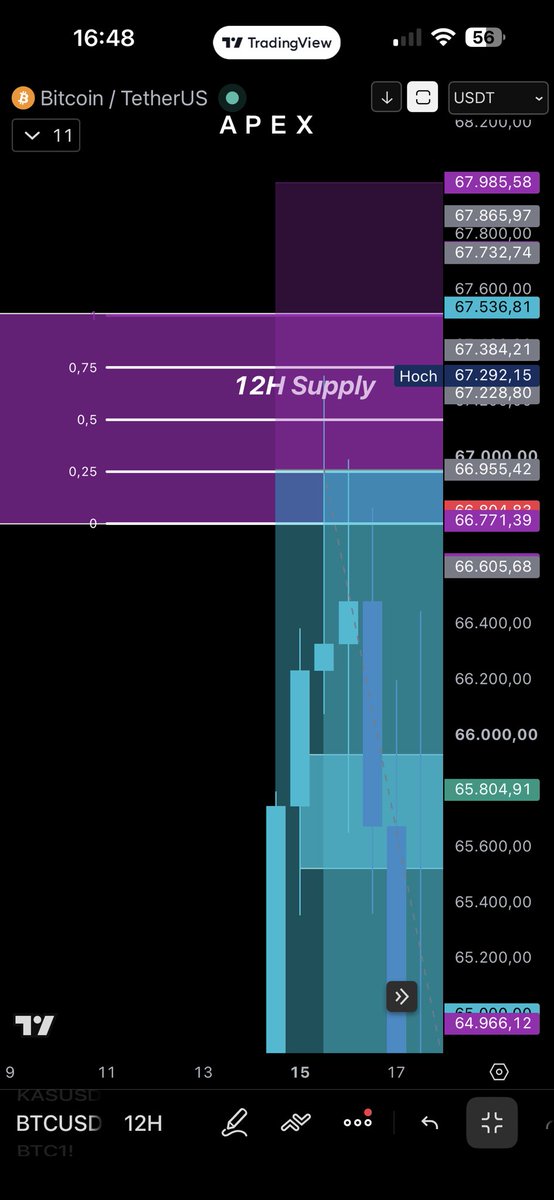
In most cases, I use a Fibonacci tool, but I repurpose it with the 0.25, 0.50, 0.75, and 1.00 levels simply to measure the percentage of the zone. At every 25% interval of the zone, another entry order is added.
Depending on the size of the zone, I may also adjust the amount of margin allocated to the trade. If the zone is very small, there are cases where I do not scale in at all because it makes little difference. In those situations, I allocate the full margin immediately on the first touch of the zone.
To summarize:
The first touch of the zone is the initial margin entry
Every additional 25% fill of the zone triggers another entry
Very small zones may receive the full position immediately instead of scaling in
$BTC Full TP on the short -
Had a good opportunity to seek longs @ the 62k sweep before continuations lower. But as I said, lose 63.6k and the rally = cooked.
Before/after chart + live entry given in the Telegram, FREE analysis given on twitter that top ticked the move & execution on chart. No flip flopping or multiple chart ideas with endless "I was right" scenarios. I gave you all everything you needed, no extras. You're welcome once again.
⚠️ SUPPLY & DEMAND ZONES⚠️
Supply and Demand trading focuses on identifying areas in the market where institutional players have previously bought or sold large positions. The strategy involves entering trades when the price revisits these zones, aiming to align with the institution's movements rather than retail traders, who often take losing positions. Spot the areas where the price has moved sharply upward or downward and mark these regions as supply or demand zones using a tool like rectangles.
A demand zone is a general area where the price has previously reversed upwards, presenting buy/long opportunities. As there is a lot of liquidity in this zone, the price can be reversed multiple times.
A demand zone is where the🐳's deem the asset cheap (discount). A place where they want to buy at a valuable price. They will often purchase and accumulate the assets at these demand zones, so we see multiple strong reactions back up to the upside.
1. Whales deciding to open new long positions
2. Whales deciding to close their short positions
This double action creates upward momentum from the demand zones which explains why we get explosive movements when this zone is reached. Follow these movements to ride the momentum to buy at the lows at the right time and achieve big gains by selling into supply zones.
A supply zone is a general area where the price has previously reversed downwards, presenting sell/short opportunities. As there is a lot of liquidity in this zone, the price can be reversed multiple times.
A supply zone is where the 🐳's deem the asset as expensive (premium). A place where they want to sell at a valuable price. They will often offload and distribute their assets at these supply zones, so we see multiple strong reactions back down to the downside.
1. Whales deciding to open new short positions
2. Whales deciding to close their long positions
This double action creates downward momentum from the supply zones which explains why we get explosive movements when this zone is reached. Follow these movements to ride the momentum to sell at the highs at the right time and by taking profit ready to buy into demand zones.
Discount and premium 👉 https://t.co/oLzM0aoqJS
Supply and demand is the market psychology and driving market force behind what creates support and resistance levels. Identifying such levels where institutions are buying and selling you can capitalise on these significant reversals before they happen.
News events, economic announcements and market trends tend to occur in these zones, engaging traders in buying and selling, adding fluctuations in the supply and demand equation.
Bad news tends to flourish in demand zones.
Good news tends to flourish in supply zones.
Significant shifts in supply and demand are driven by the actions of large institutions and major traders. Only large institutions with great buying and selling power can influence price movements in the markets, not retail players. They have the power, money and leverage to manipulate the market to achieve their goals.
Supply and demand levels are easily observed as PA normally sharply rises, declines or consolidates at these zones. A price increase indicates that demand exceeds supply. A price decrease indicates that supply exceeds demand. A consolidation pattern occurs when supply and demand are roughly equal.
The key is to identify where the sharp price movements happen as this indicates where institutions are either buying or selling. These movements occasionally originate from a supply or demand zone and reveal the presence of an imbalance in the market.
Accumulation & Distribution
Accumulation
When the price is at a key demand zone, MMs will accumulate their positions as they can't buy everything at once and it takes time to buy their full position. If they enter too much at once then the market will likely take off to the upside resulting in less profits for MMs as they now have a smaller position than intended. Therefore, they'll gradually load up and spread out their buy orders creating a sideways price movement (consolidation).
Distribution
When the price is at a key supply zone, MMs will distribute their positions as they can't sell everything at once as it takes time to sell such a big position. If they sell too much at once then the market will likely take off to the downside resulting in less profits for MMs as they'll be selling below their desired premium price. Therefore, they'll gradually sell and spread out their sell orders creating a sideways price movement (consolidation).
Large institutions are unable to complete their full position in a single go hence why they break it down into smaller sizes and execute each trade individually at similar prices over time to avoid generating significant price movements that will negatively impact their entry price which creates those demand and supply zones. This is why we see multiple touches at heavy liquidity areas before the true reversal.
If there isn't sufficient liquidity at the time to complete their position whales will let the price move away and then come back into their desired zone to complete their position. No need for other indicators to identify such areas as it is clear as day to see when you know how to read PA. The SUPER example below is good for you to understand this process.
Follow the smart money to achieve:
1. True market direction: The correct direction the market is going next (up or down).
2. Directional momentum: Invest/trade with moving momentum. Entering without directional momentum will often lead to losses, breaking even or making very little from the position (Retail players play this role as they are unaware of such concepts).
Here's a key takeaway from @Moneytaur_ 👉 https://t.co/Y2adqHzC2Z
If PA goes above and beyond supply zones into price discovery then rely on negative Fibonacci levels and trail your position under HTF/MTF key levels.
Negative Fibonacci levels 👉 https://t.co/C9mwD3QlF4
$BTC Example:
Demand: Here we have clear demand zone areas where MMs have a key interest in buying/longing. I do not doubt that these zones will act as a key reversal point in the future.
Supply: Here we have clear supply zone areas where MMs have previously taken profits or closed their long positions.
Look for the HTF OBs that are followed by engulfing candlesticks with sharp movements (Bullish OB followed by bearish engulfing candlesticks and vice-versa). These HTF OBs often act as supply and demand zones where PA may return to in the future.
The HTF OBs will represent higher volume meaning there is a higher chance of price reacting and reversing off these zones (a true reversal). You should set ⏰'s at such levels and execute. Also, HTF OBs can be hit multiple times before a true reversal as they contain lots of liquidity but with each hit the level becomes weaker meaning PA will break through eventually and continue in the same direction.
When supply zones are broken through it can turn into a key demand zone where MMs deem the price as a discount (Resistance turning into support).
When demand zones are broken through it can turn into a key supply zone where MMs deem the price as a premium (Support turning into resistance).
The key is to combine market structure with demand and supply zones as it will give you stronger confirmation of what the market is about to do next.
Look at my market structure education post to gain a deeper understanding of MSS 👉 https://t.co/X7T8tC5jLG
$SOL Example:
Here we have monthly OBs and a SH that are acting as our supply zones (Resistance levels).
At our 1st supply zone, there was heavy profit taking but the price eventually broke through and turned into a key demand zone where MMs placed multiple buy orders at around $120 - $110 showing us the flipping (Resistance turning into support).
This is when we should follow smart money and do the same thing. As we can see there was consolidation at these prices before the bullish continuation.
I've put some extra examples below in the comments to help you understand what you're looking for 👇
I try to make these topics as friendly as possible and it does take some time out of my day so if you want me to provide more educational posts, please like and repost so they can reach more people 🙏
If you have any questions, put them in the comments below 👇
Future run on #Bitcoin will either finish with 1 top, making a triple Top on it's HTF chart, or if blasting past it into near $100,000* it should then print a double or triple top on the charts, rather than 1 single top as whales won't be able to unload all their positions at once. They need buyers so the 🌊 of induced FOMO when the day comes will be quite telling.
*In my opinion the future high before another 🩸 death-spiral for BTC will be just < $100,000 ($91,000)
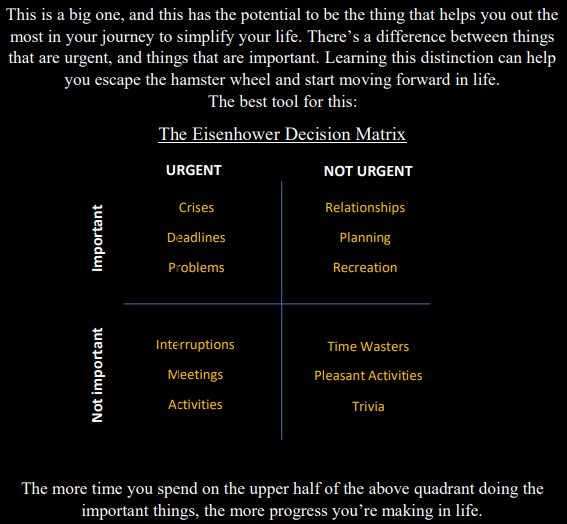
If you want to mimic the successful, here's one of the things they do. Organize your time and cut useless distractions that will keep you from achieving your true potential.
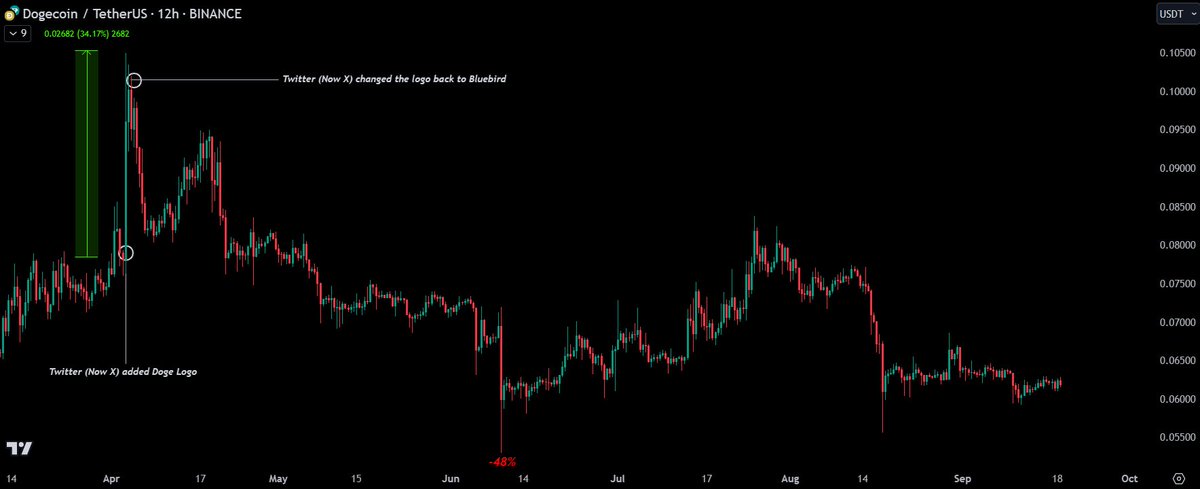
No one had/has the cojones to comment on the Pump & Dump on $DOGE when this platform added it as their logo for ~12H, from HTF 🗝 liquidity level on the chart, and replaced the logo after a +34% pump, just to see it melting all the way back down in hours.
No one will remember this right? It's all about believing in fairytales around here. Meanwhile, whales extract $ from this game from time to time and carry on scaling their businesses with it, paid by: Retail investors.
It's like a loan from retail investors to whales, without an actual agreement, but with an "agreement"
In short: They promise you that if you keep your money in a "magic box" it'll grow many times over. So you wait, trusting the process. At least 100X, but you need to keep your money inside that box, or you don't get the chance to multiply it, so you keep it there. Then, from time to time, whales get their hands on the "box" when it is full, and take a good chunk of what you've put inside, and then tell you to put more, because it's just a "pullback" on the valuation of your investment that will still multiply and make you very rich, so you put more, and then they gaslight you and take more from the box, and again, and again...
During this period on the chart below, 2 whales among the top 5 holders reduced their holdings by ~1.4B $DOGE ($121M)
Whale "DDuX" (the 5th holder) reduced 1.1B $DOGE($95.2M): https://t.co/Pzr9rFOiZ1
Whale "D8ZE" (the 3rd holder) reduced 300M $DOGE($28.6M): https://t.co/Avyw0W9YL5
Retail being scammed left & right and still cheering for more. Masterpiece.
Magnitude and Velocity of swings are quite telling for the "fuel" X coin still holds. Learn to read these and you can identify where the top/bottoms might be IF able to pair this understanding with liquidity + algorithms moves.