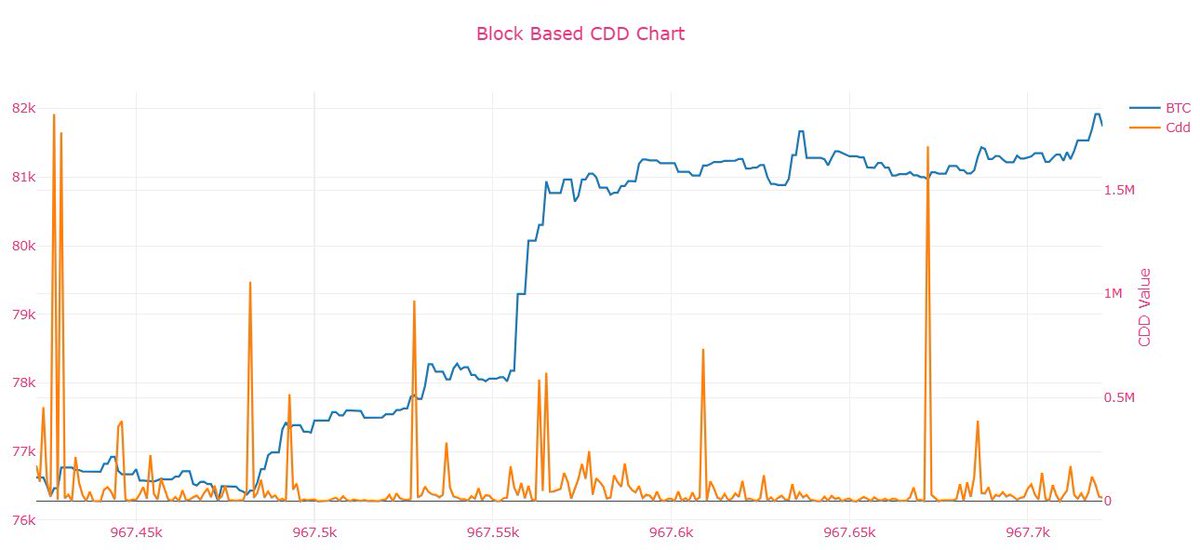
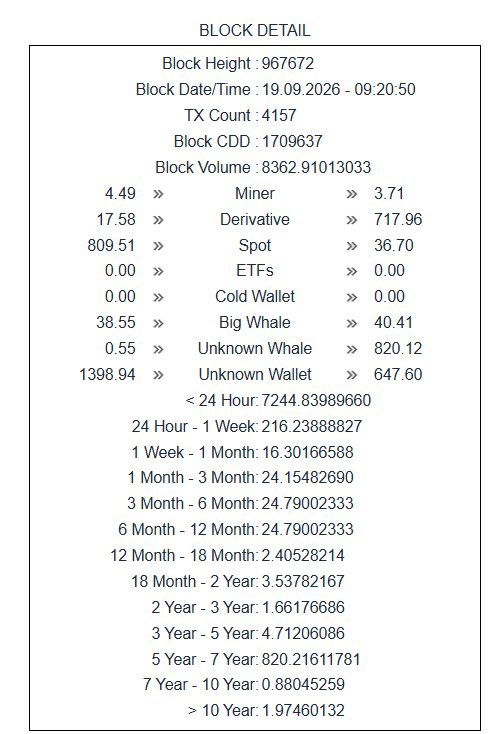
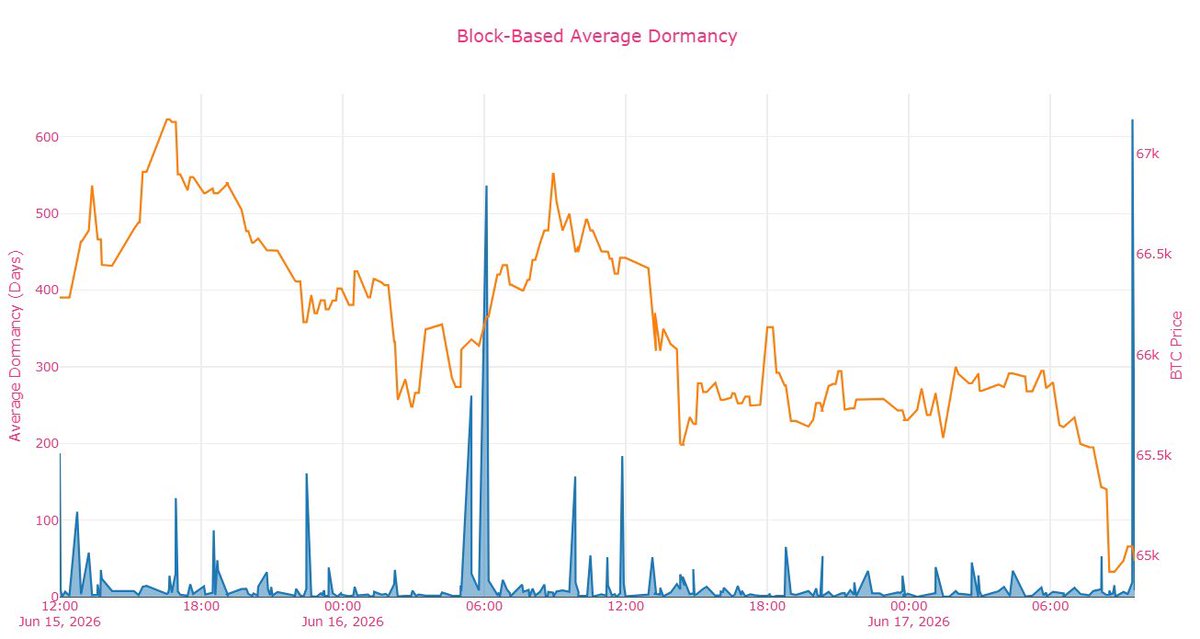
A notable CDD spike was recorded at block 967672.
The block reveals a significant flow of ~700 BTC out of derivatives and into spot — alongside elevated dormant coin activity.
A shift in positioning worth tracking closely
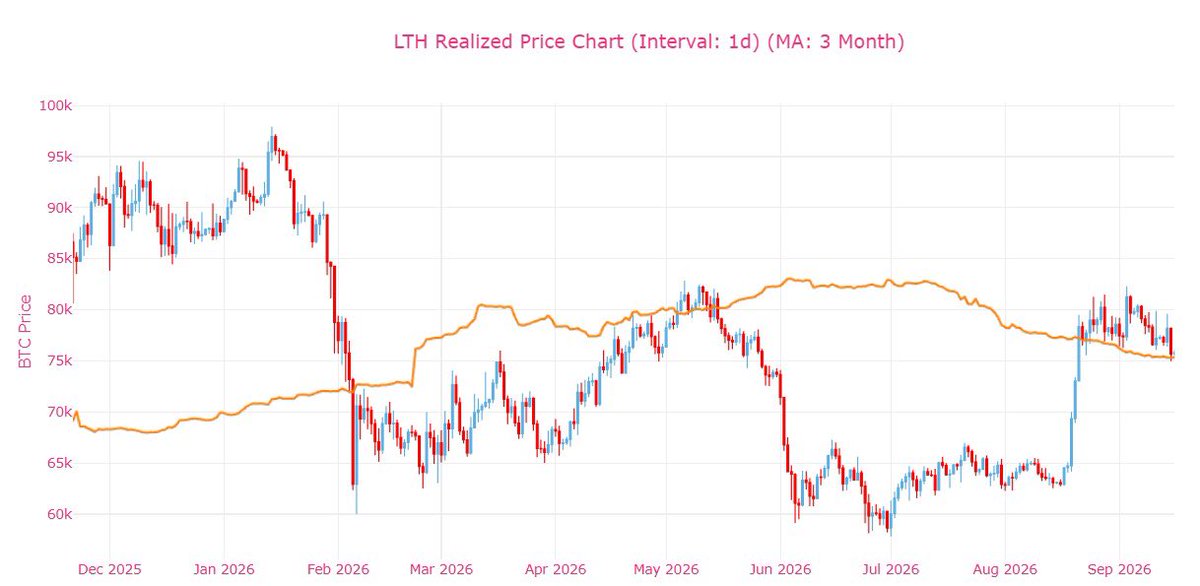
Long-term holder cost basis is back in play.
Bitcoin is testing the LTH Realized Price after an extended period below it. Historically, sustained moves above this level have coincided with stronger market structure.
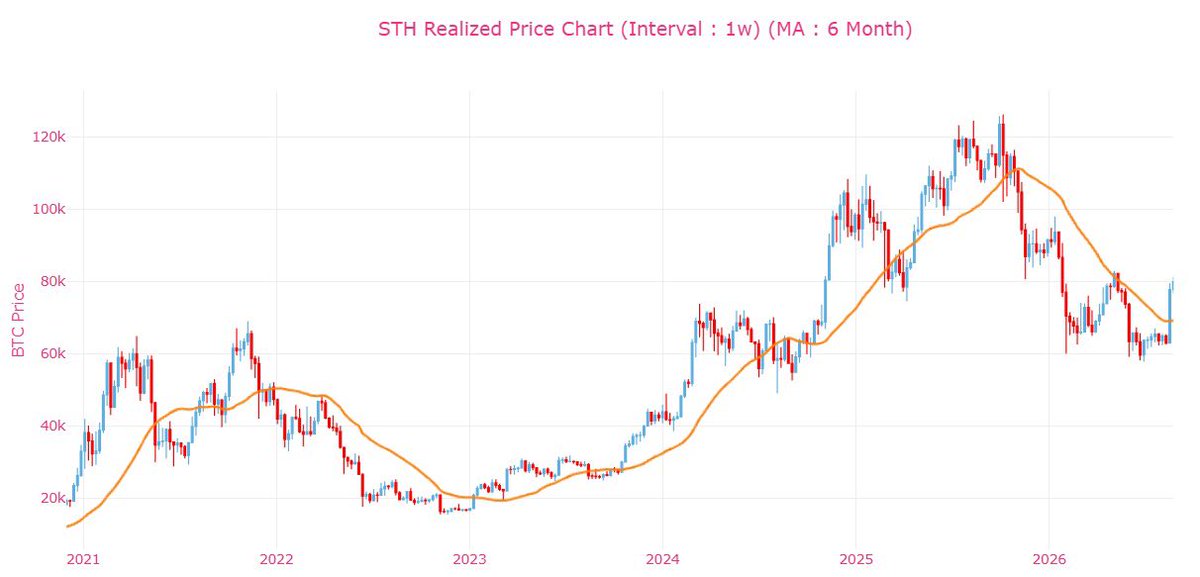
Bitcoin has closed the week above the STH Realized Price, ending a 9-month stretch below this key level.
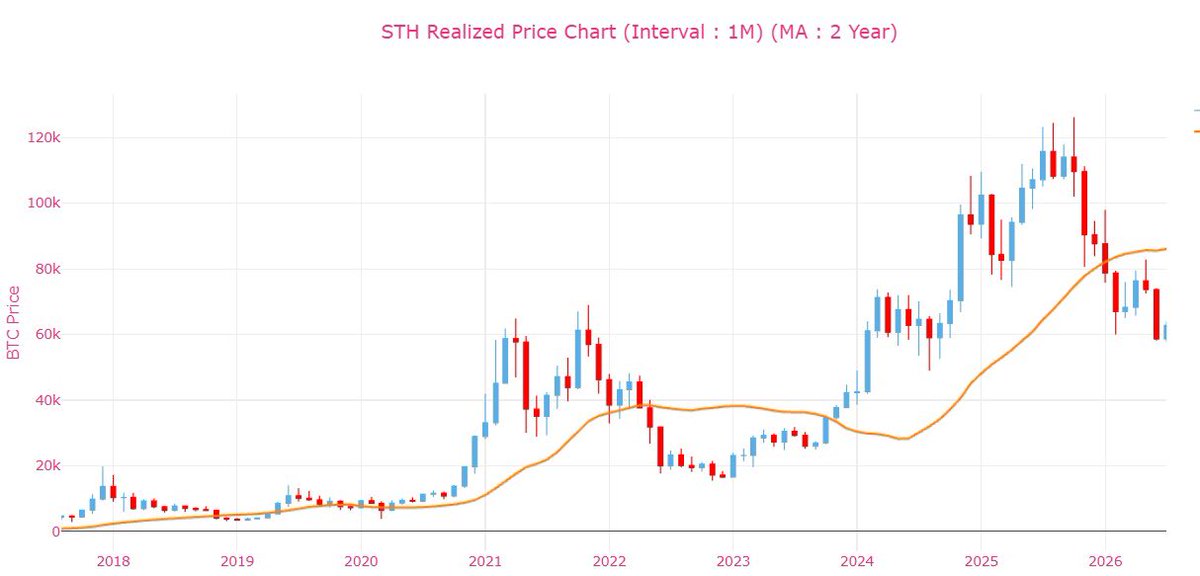
The weekly structure is showing improvement, while the monthly STH Realized Price near $86K remains the next major dynamic resistance.
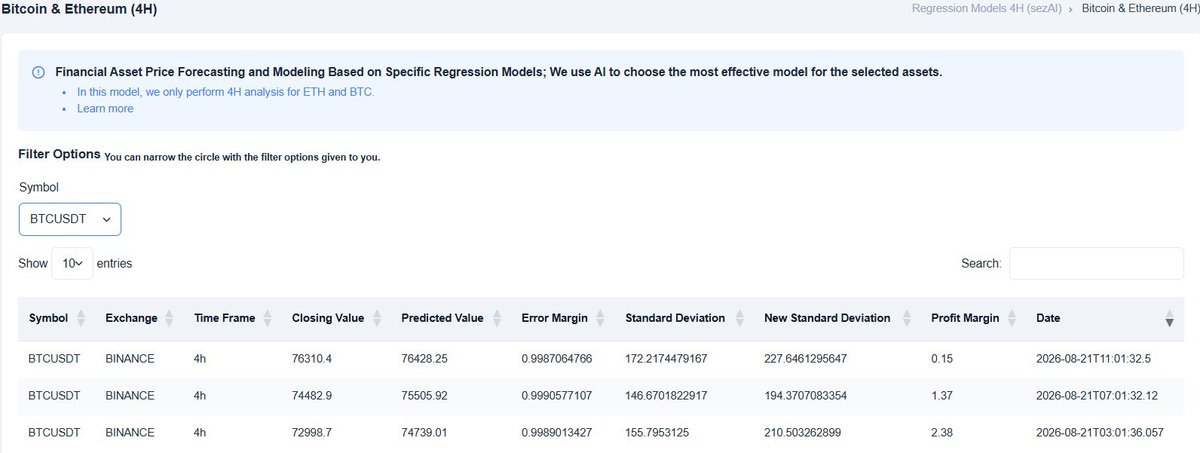
sezAI remained consistent while Bitcoin moved higher.
Across consecutive 4H forecasts, the model continued to project higher price levels — with each target subsequently reached.
Consistency matters more than a single prediction.
Bitcoin has reached the Short-Term Holder Realized Price from below.
A sustained move above this level would signal a meaningful shift in short-term holder positioning.
A notable CDD event was detected in Block #958844.
The activity was primarily driven by coins that had remained dormant for 2–3 years, highlighting a meaningful reactivation of older supply.
Average Dormancy continues to trend higher.
Recent on-chain activity indicates that older coins are becoming increasingly active.
Monitoring for follow-through.
Estimated Leverage Ratio moved sharply higher before the latest downside move.
Elevated leverage continues to increase the market’s sensitivity to volatility.
The current market reflects a clear divergence between holder cohorts.
Bitcoin remains well below the Short-Term Holder Realized Price, while trading considerably closer to the Long-Term Holder Realized Price.
This divergence continues to define the current market structure!
Bitcoin has reverted back to its statistical mean after reaching the lower extreme of the Dynamic Range Indicator.
With price now testing the 20-Day Moving Average, attention shifts to the upper deviation bands between 66.1K and 68.5K.
Mean reversion remains the dominant theme.
Bitcoin has reverted back to its statistical mean after reaching the lower extreme of the Dynamic Range Indicator.
With price now testing the 20-Day Moving Average, attention shifts to the upper deviation bands between 66.1K and 68.5K.
Mean reversion remains the dominant theme.
The most valuable information in a blockchain is often hidden in the exceptions.
Today, Average Dormancy became one of them.
A significant deviation from recent activity patterns has just emerged.
The market is doing what the data suggested.
Our GTZ Strength Index generated a BTCUSDT LONG signal, and TP1 is now nearly reached.
By combining price action principles with machine-learning-enhanced filtering, CDDStamp continues to focus on quality over quantity.
Precision!
Markets generate billions of data points every day.
Very few become actionable insights.
Discover what the data is really saying!
https://t.co/cdCY0LWhlF
While Bitcoin remains below its STH Realized Price (4H, 2-Week MA), our sezAI Regression Model continues to project higher levels.
The interaction between these two signals may define the next major move.
Two significant spikes in Block-Based Average Dormancy were recorded yesterday.
Shortly after, BTC moved lower.
When older coins start moving, market structure can change faster than expected.
Exchange reserves continue to climb while BTC trades lower.
Coins are moving back to exchanges, but the market has yet to reveal whether this is preparation, distribution, or simply repositioning.
Flows first. Narratives later.