You know what I miss?
A strong President.
Not a incoherent walking Roomba that wouldn’t dare take 20 steps into North Korea like Donald Trump did.
We were respected by the world.
Biden’s America is a laughing stock.
#Bitcoin pump incoming ?
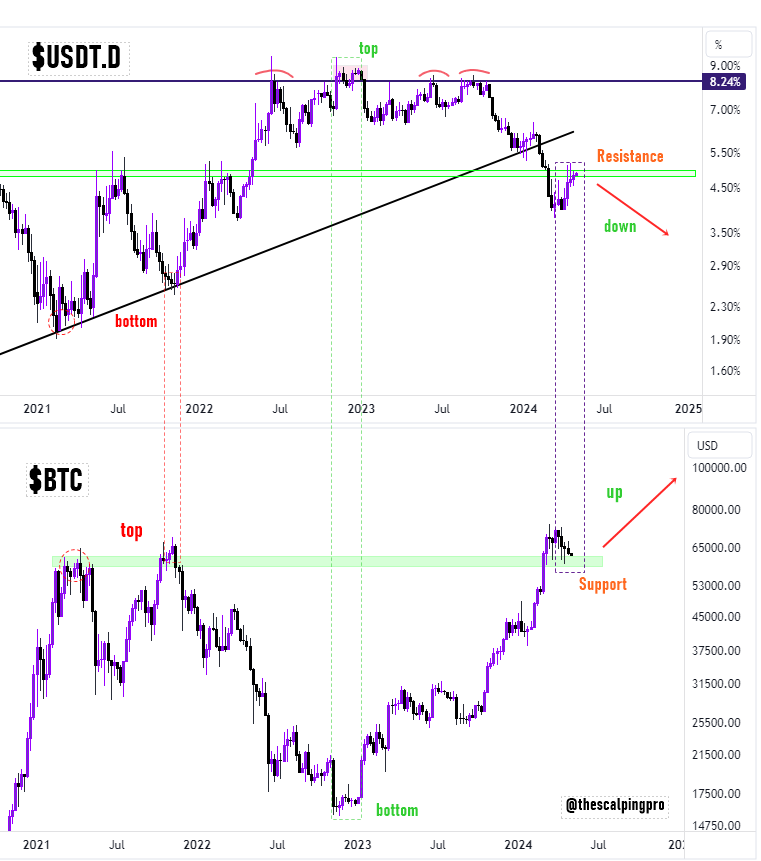
If you've been paying attention to USDT.D, you already know about the inverse correlation between USDT.D and BTC.
Looking at the chart, USDT.D broke down a strong trendline support and is currently testing resistance, while the pullback on BTC looks like a re-test of weekly support near the ATH.
If USDT.D gets rejected here, we can expect a massive leg up in BTC, sending it to $80,000 and even higher.
We should have died 3 times.. rugged, snipers, and last minute whale exit
$APU is alive because we just never stopped memeing and shitposting, and we never will. 158 million MC coming for 10B
You can’t stop this train you can only get on or get left @ApusCoin
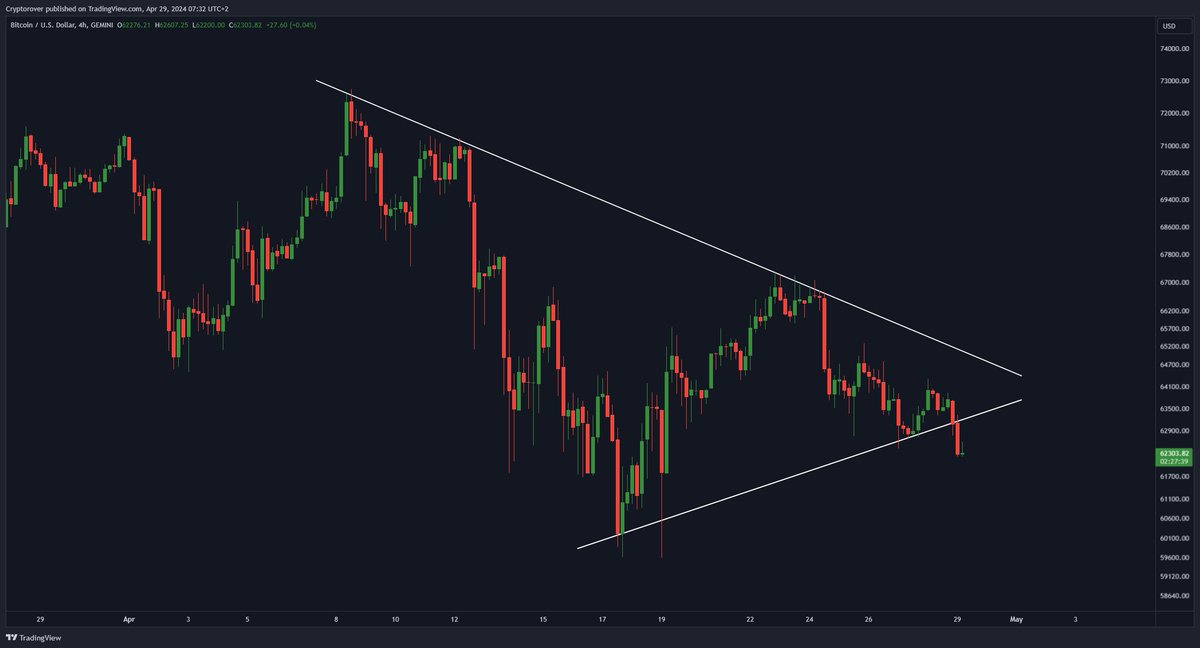
#Bitcoin - What's Next?
The big Sunday report, all you need to know:
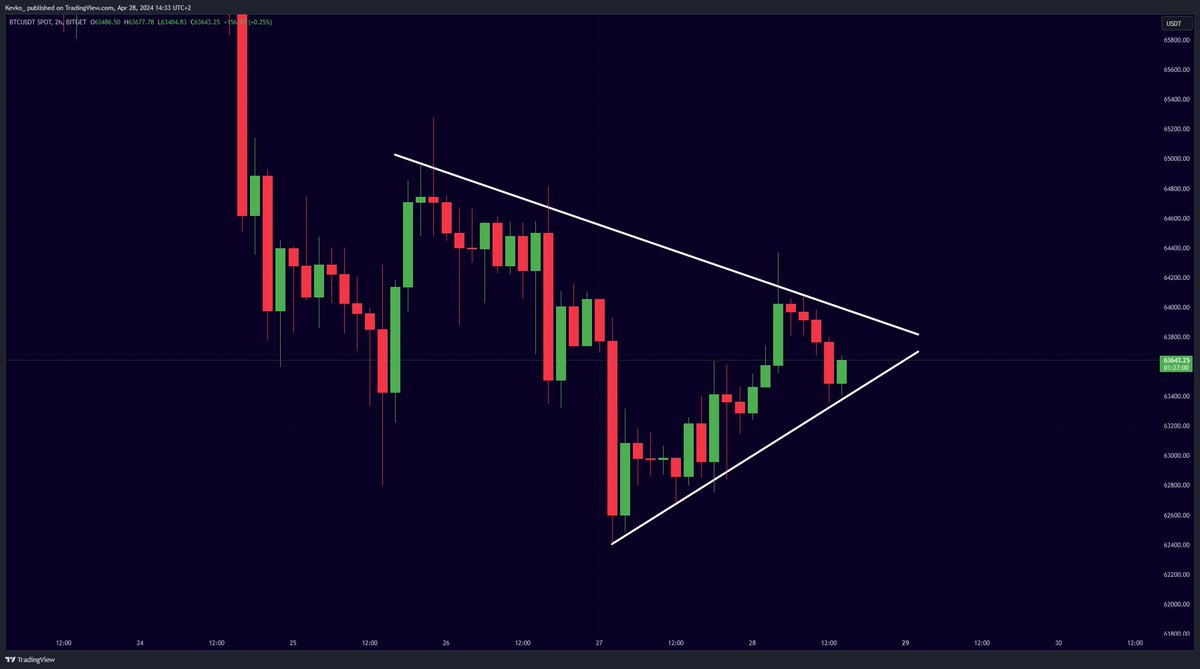
🚩 TA/LCA/Psychological Analysis: For more than 60 days now, I've been referring to this sideways movement between 72k and 60k. If you examine the facts in the chart and OnChain, you will only see bullish signs. On the daily chart, we can spot a massive bull flag. At the same time, BTC is respecting the box that was mentioned on March 13-14th. Between December 2023 and mid-February 2024, we moved 65 days in a sideways range of 38k - 46k, an exact range of 22%. The exact same pattern can be spotted right now. Bitcoin has been moving for 65 days between 60-72k, an exact range of 23%. Bitcoin is repeating what it has done before and is likely to follow the same pattern it exhibited from April 8th. It ran from the mid-45k region towards an all-time high of 68k, pumping 50% in less than three weeks. Can you connect the dots? Do you understand why I call this a bullish sideways movement?
While the market is boring and moving sideways, you can spot a massive bull flag forming on the daily chart. It's just a matter of time for the big pump. It's a good time to buy, but most people will buy once we break out from this bull flag. Few people accumulate right here, but big players including Tether are printing and preparing.
Tether USDT has printed more than 8% of its entire supply in the last 60 days. Stick to the facts. Bitcoin reached an ATH of 74k with a USDT market cap of $102bn. Now, the USDT market cap has reached $110.5bn in just 60 days, while Bitcoin is still sideways moving between my mentioned range of 60-72k. Indeed, the big players await and prepare for the super cycle. I've been saying for three months that the super cycle will start after 72k, now you can understand why Tether is printing and preparing. This range is for accumulation; what's following is a legendary pump that is loading.
Remember, we have FOMC on May 1st (Wednesday), where 97% of the market expects no changes on this day. Powell's speech will definitely bring a lot of volatility.
Join the largest paid crypto group that exists to learn, understand, and trade: https://t.co/Ytu9eL4Al7
#Bitcoin
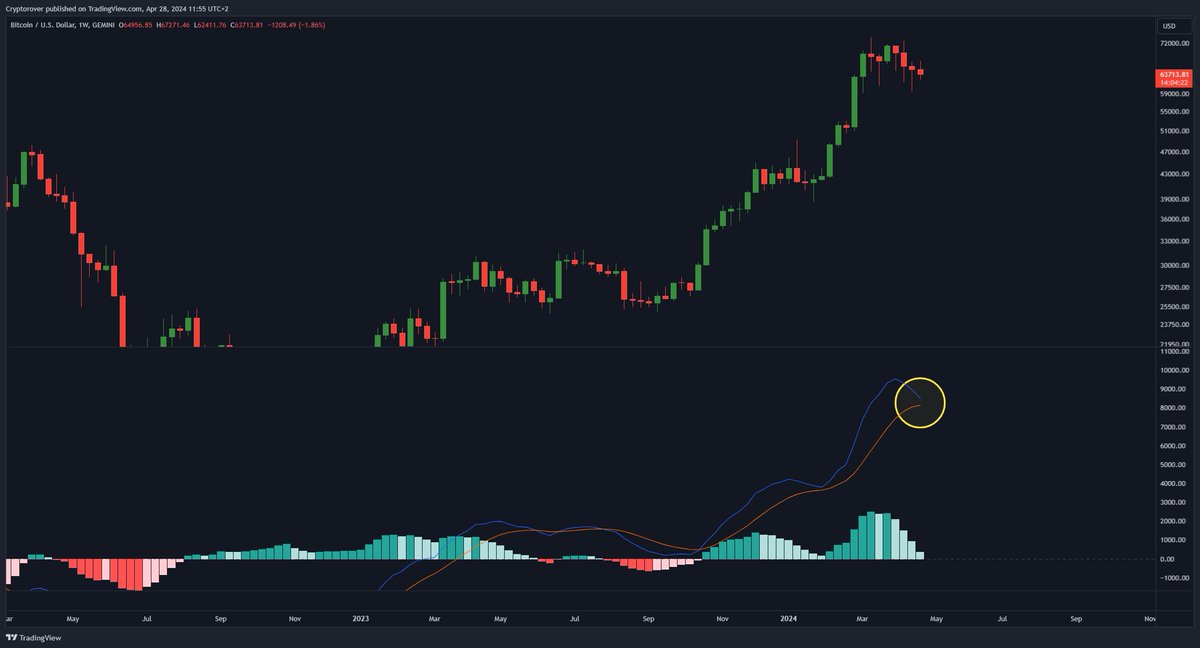
Halving is done and yet, Bitcoin continues printing red candles. Is this it for this cycle?
A lot of folks are insecure, especially in light of the geopolitical and macroeconomic situation
Let's take a look at some charts and indicators.
A 🧵
Bitcoin Dominance has fallen below the significant 55% level and is now breaking below the uptrend line. This break below the uptrend line suggests a positive trend for altcoins. If BTC remains steady within a particular range, we can expect to see an ongoing upward movement in altcoins.