Worth keeping an eye on the USDJPY correlation with $BTC right now. Historically, when USDJPY corrects sharply, BTC tends to follow with a correction of its own not long after.
The chart shows it clearly. Each time USDJPY dropped from those marked zones, BTC printed a meaningful decline shortly behind it. This ties back to the yen carry trade, when USDJPY unwinds, risk assets like BTC feel the deleveraging.
USDJPY is turning down again now. So the question is simple: does the pattern repeat, or does BTC break correlation this time? Given where we are in the cycle, this is not a signal I'd ignore. Watch how BTC reacts in the days following this USDJPY move.
#Bitcoin #Crypto #USDJPY
$BTC finally broke the ascending trendline support built since early July. That break confirms the pattern as a bear flag, exactly the scenario I flagged.
Price rejected cleanly at the red zone I mapped, then slammed down hard. That was short positioning being loaded while baiting late longs into the move first.
Here's the near term read. If BTC can reclaim above $62.7K, there's potential for a retest of that broken trendline, now flipped to resistance, while the oversold LTF oscillators reset. If it can't reclaim, the downside stays live.
My expectation leans toward a reclaim first, mostly because we're heading into the weekend where volume thins out. But the bigger picture: the odds of seeing $60K to $61K are high right now. Lose that region and the lower area won't hold either.
Invalidation is clean. If price climbs back into the trendline it just broke, the bearish setup is off. Watch that line.
We're about to enter a new month, and a more brutal one, right alongside the judgment window. Welcome, and good luck out there.
#Bitcoin #Crypto
Congrats to everyone who followed along. What I mapped on $ETH played out. The first yellow zone got hit exactly as planned.
Now we watch this test. If it fails to hold, the second yellow zone becomes the next target. And if that one breaks too, $1,500 to $1,600 becomes unavoidable.
The structure has been clear this whole time. Every level I marked is doing its job in sequence.
Good luck out there, everyone.
#Ethereum #Crypto
The map on $BTC played out again. Just like the scenario I laid out, BTC went for a retest of the resistance it had broken, after successfully holding the $62.7K area.
Now the daily sits at a crucial spot. Bulls need to hold and break through this strong resistance at $64K. If they fail, we head back down to retry $62K, and the area below.
Honestly, the CT reaction lately is a bit funny to me. When price was ranging at $62K, half of them wanted to wash their hands of their calls, acting like $50K was still around the corner. Now that $62K holds, suddenly they were right all along and price won't go lower. Tomorrow it flips again. And the day after, it flips again.
What do these people actually stand for? They play it safe to protect their reputation, when the truth is there's far more they don't understand than they'll admit. At the very least, stop misleading the people who read your posts.
Have a conviction. Show your invalidation. Own it when you're wrong. That's the whole job.
#Bitcoin #Crypto
Why hasn't $BTC moved to $60K yet? The answer is: not yet, not never. There's a difference.
Look at the liquidation heatmap. That thick band of liquidity sitting around $60K to $62K is, in pure business terms, extremely attractive. Price doesn't ignore pools like that, it gravitates toward them. The magnet is still there.
So think smarter. A part of CT isn't as honest as they present themselves. When they wave you into buying right before a liquidity zone like this, you're the one being set up as exit liquidity for their exchange partners. That's not a conspiracy, that's the incentive structure.
They're not blind to this data. They just serve you the version of it that fits their interest. Read the map yourself, and stop taking narratives at face value. #Bitcoin #Crypto
Looking at the Hyperliquid liquidation map on $BTC, even across an unfair range from $40K to $100K, the long leverage is clearly the more massive side.
Sit with that for a second. Even with a range this stretched and skewed against the point, longs still dominate the book. Now go pull it up with a fair, symmetric range around current price and see for yourself just how extreme the long versus short imbalance actually gets. It's worse than most people assume.
This is the weight sitting on BTC's back for the long term. All that stacked long leverage is fuel that hasn't been cleared. And until it gets swept, it keeps dragging on any real sustainable move higher. You don't build a clean bottom on a book this lopsided. It has to flush first.
#Bitcoin #Crypto
Aggregated orderbook liquidity on $BTC is leaning more negative right now. This is worth watching, especially because price is sitting right at the resistance I mapped.
Negative orderbook liquidity here suggests sell-side pressure is building into that resistance. Sellers are stacking above. Now, a fair caveat: this is orderbook data, and resting orders can be pulled at any moment. It's not a filled position, it's intent.
But intent at a key level still matters. When the book skews negative right as price tests a zone you already expected to reject, that's confirmation worth respecting, not ignoring. Watch whether this supply holds price down or gets absorbed.
#Bitcoin #Crypto
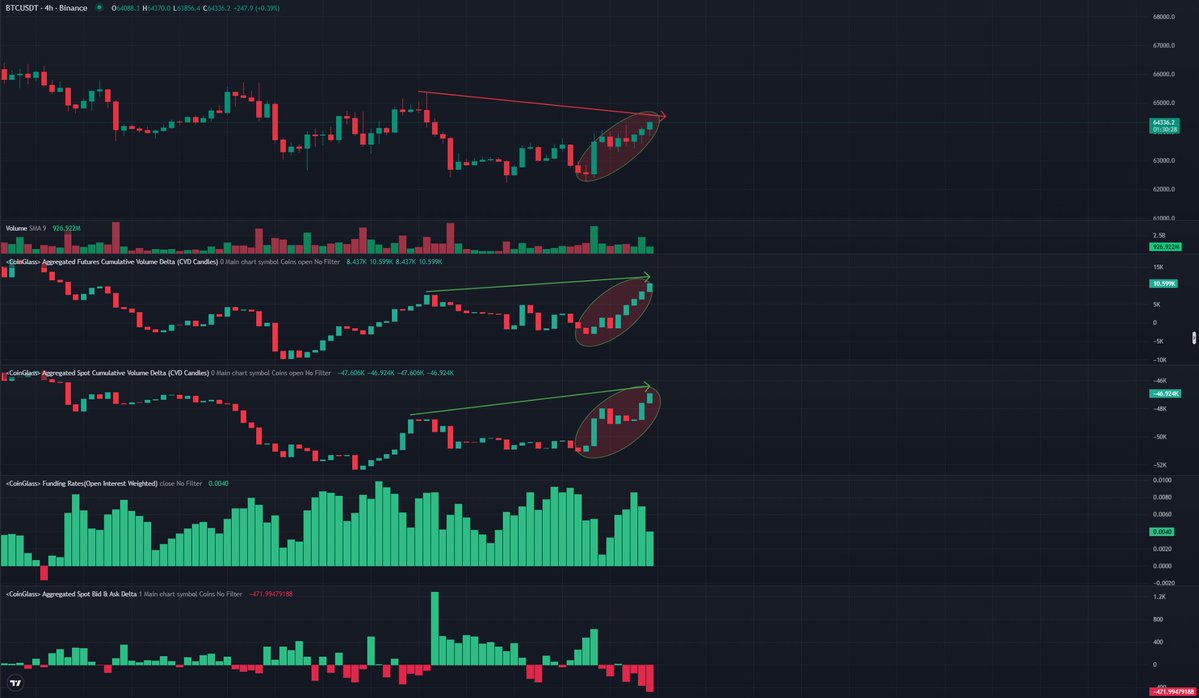
Once again, the start of the month is getting a strong push from aggregated spot CVD on $BTC. Both futures and spot CVD are turning up together this time, and that's the part that matters.
Holding $64K and breaking the resistance above is now the bulls' job. If they can defend it, this is a genuine positive for the near term, since the move actually has spot behind it, not just leverage.
Worth noting the macro tie-in too. $SPX ripping to fresh highs is one of the triggers feeding this BTC bid. Risk-on flows spill over. The question is whether this holds or turns out to be pure FOMO once the momentum fades. Watch if spot keeps confirming or quietly rolls back over.
#Bitcoin #Crypto
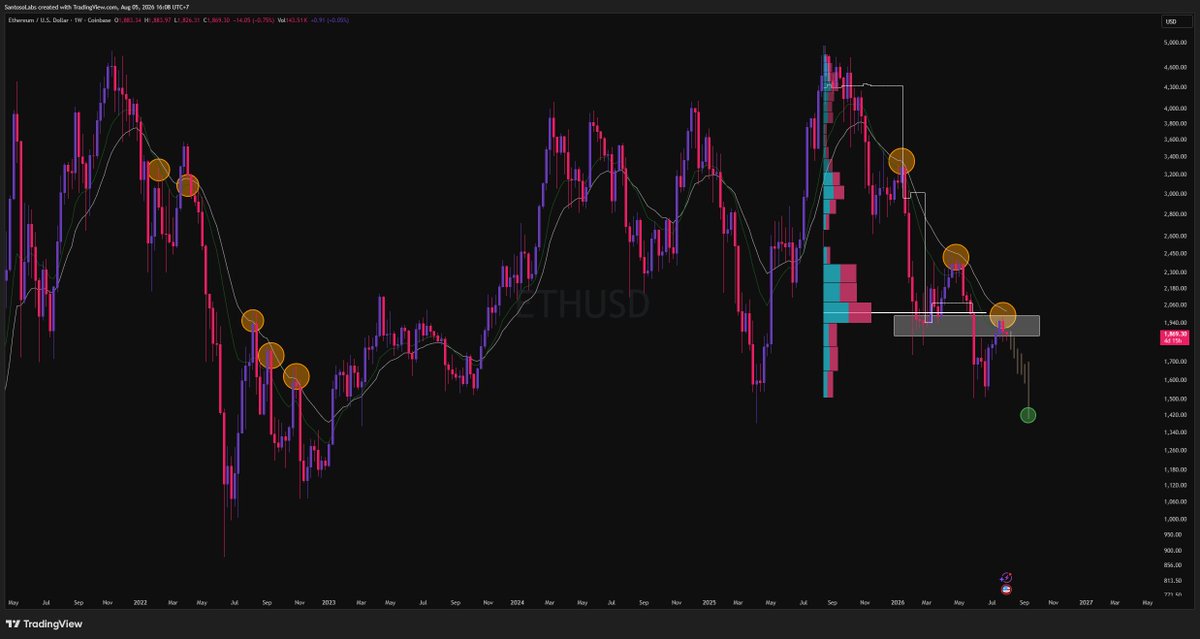
On the HTF, $ETH is still clearly inside a bearish zone. And the $1,900 to $2,000 area is where the real resistance sits.
This isn't one wall, it's a stack. The 13 and 21 EMAs, the POC, and the structural resistance all converge in that $1,900 to $2,000 band. When that many factors line up in one spot, reclaiming it isn't a small ask, it's the whole battle.
If ETH fails to take that zone back, the downtrend continues with a target of $1,400 to $1,500. Until price reclaims $2,000 and holds, the path of least resistance stays down. Watch that band closely, it decides the next leg.
#Ethereum #Crypto #ETH
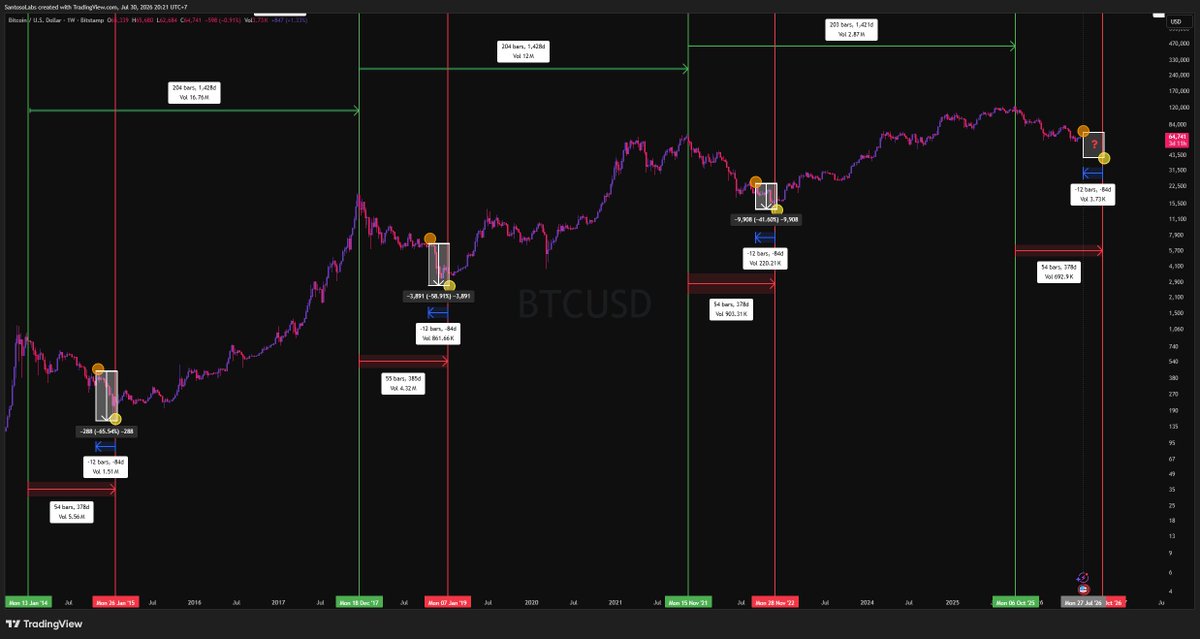
Following the $BTC cycle map I laid out before, this week we officially enter what I call the judgment window.
I don't use that name lightly. In all three prior cycles, this exact window is where the most brutal capitulation hit. Same rhythm, 12 weekly bars, 84 days before the cycle closes out. It's the final flush before the turn, and history shows it plays out the same way every time.
The measurements on the chart tell the story. 2014, 2018, 2022, each one delivered its deepest, ugliest drop inside this zone. Now we're standing at the same door.
If you make it out of this window untouched, you're one of the ones who got spared. And if you're waiting on the sidelines, understand this: you are not late by entering after the judgment window closes. You're early to the move that actually matters. Patience here isn't missing out, it's survival.
#Bitcoin #Crypto #BTC
One thing that concerns me right now is the aggregated orderbook liquidity on $BTC turning sharply negative.
This is the part worth paying attention to. Negative orderbook liquidity means sell-side pressure is stacking against the book faster than it's being absorbed. If the market can't soak up that supply, it becomes the trigger.
And here's why that's dangerous in this specific setup: overleveraged longs are still sitting high. A supply overhang like this, into a market packed with leverage, is exactly the recipe for a long squeeze. One flush and those positions cascade. Watch whether the book starts absorbing this or keeps bleeding negative. #Bitcoin #Crypto
After the Fed decision dropped, there's finally some spot support showing up on $BTC. Aggregated spot CVD has turned positive and is holding that way for now.
I'll be straight about the balance here though. Futures CVD and funding are still the more massive drivers of this move. Leverage is doing the heavy lifting, no question. But the difference this time is that spot isn't completely absent anymore, it's actually contributing.
That spot participation is what helps carry BTC in the near term. It doesn't make the move bulletproof, since the leverage side still dominates, but a leg with real spot behind even part of it holds up better than one built purely on borrowed size. Watch whether spot keeps confirming or fades back out.
#Bitcoin #Crypto
There's rarely an edge in taking a position while volatility is running hot. Short term capitulation is almost guaranteed in these conditions.
Let's talk $BTC after the Fed held rates with no change. That kind of event sweeps both sides. Shorts and longs both got run, and neither walked away clean. The only ones who profit here are the ones who sat back and watched.
Now the read. BTC has broken through the first liquidity area. If price follows the liquidity, a visit toward $65.7K opens up from here.
The question is whether this is just a capitulation move, or whether the push higher is there to sweep the short positions sitting above before the next move. Watch how price behaves as it approaches that liquidity, that reaction tells you which one it is.
#Bitcoin #Crypto
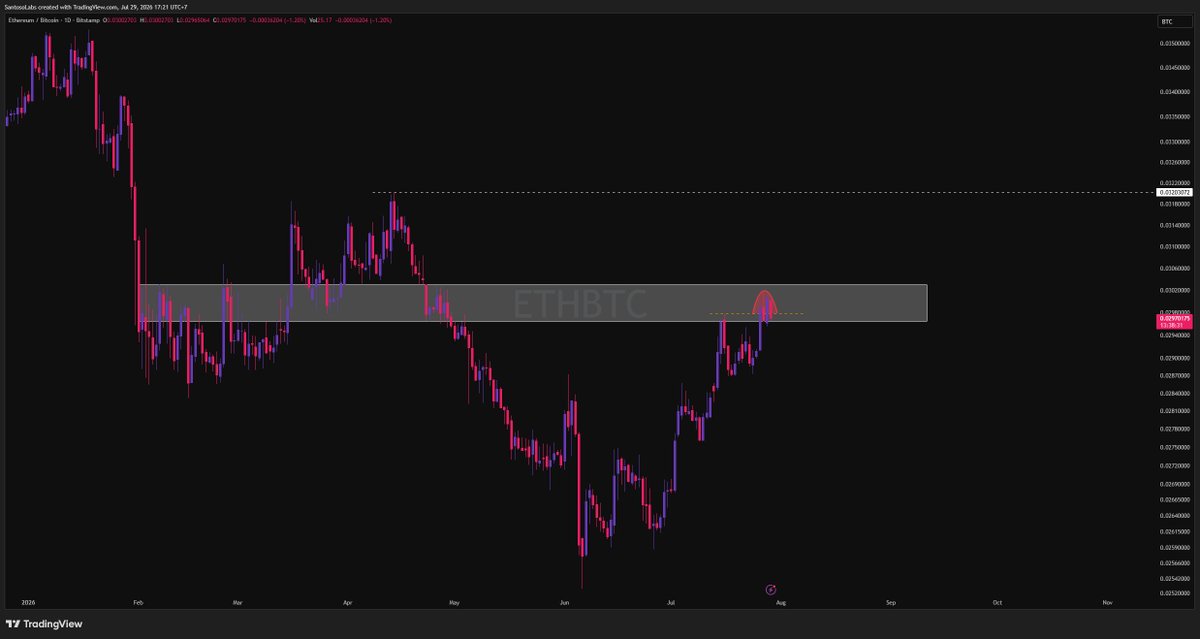
$ETHBTC is sitting at a crucial spot right now. This zone has acted as a trend pivot multiple times before, and how price interacts with it here will shape ETH's next move relative to Bitcoin.
Break it or reject from it, either way the reaction sets the tone. This is the level that decides which coin leads.
Context matters too. $ETH has outperformed $BTC since the start of July. That strength is real, but it comes with a catch: ETH's oscillators are running far more overbought than BTC's right now. The rally has stretched it thin.
So watch this pivot closely. A rejection here with ETH already overheated is exactly the setup where the outperformance can start unwinding.
#Ethereum #Crypto
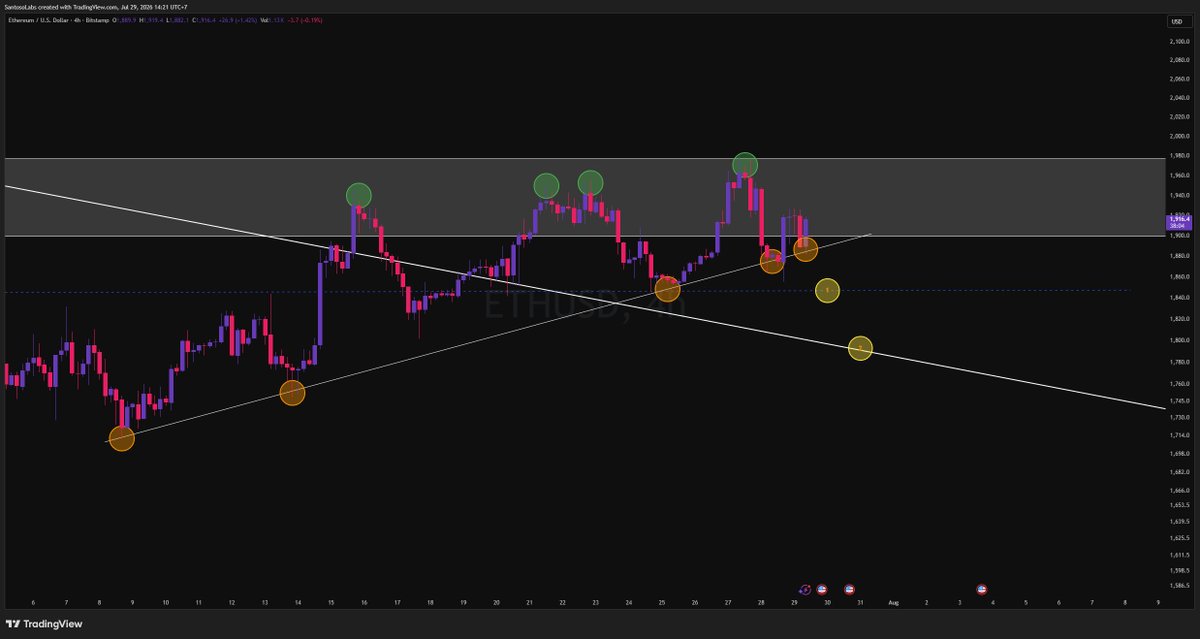
The ascending trendline on $ETH held again. Another bounce, another dot added to the support line.
But here's the part people misread as bullish: this isn't fully a good thing. A support that gets tested this often doesn't get stronger, it gets weaker. Every touch chips away at it. The more times price leans on the same line, the more likely it eventually gives.
My view hasn't changed. The yellow zones below become the target the moment this trendline finally breaks. Watch for that break, that's the signal that matters.
#Ethereum #Crypto
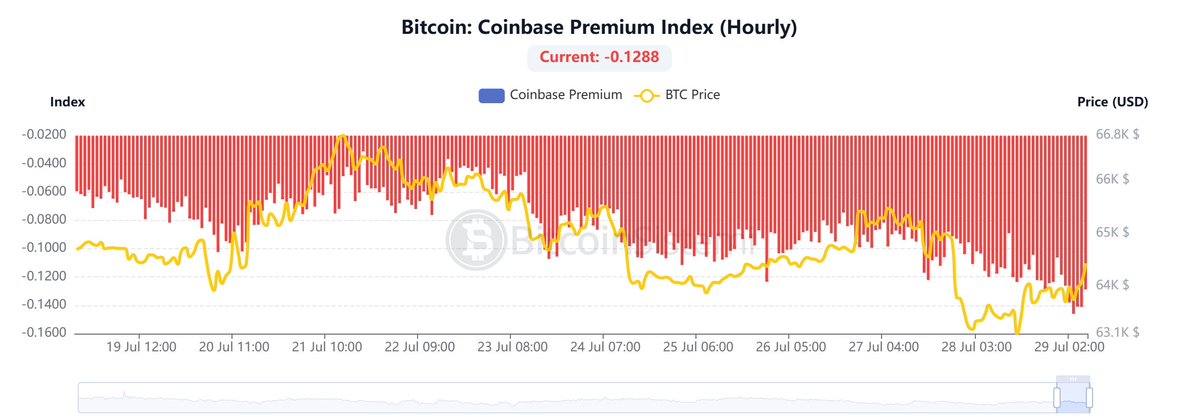
Ever since $BTC tapped $66.9K and started rolling over, the drop has had confirmation underneath it. Coinbase Premium has pushed deeper into negative territory the entire way down, now sitting at -0.1288.
That's the tell. US spot demand isn't stepping in to defend this. When price falls and the premium keeps bleeding red alongside it, the selling is coming from the side that actually matters. This isn't a shakeout on thin liquidity, it's genuine distribution from US flow.
#Bitcoin #Crypto
Some of you probably got shaken out when $BTC dipped below $63K. But I had already mapped the revisit to $64K, and here we are. That played out.
Now comes the next test. Can BTC hold this area, or does it fully reclaim it? That's the question this zone answers.
I won't pretend to predict it with 100% certainty right now, because FOMC is coming. Guessing direction in high volatility is just gambling, and I don't gamble. I wait for confirmation.
What I can tell you is the LTF hourly indicators have reset. Not fully exhausted anymore, which means if the market wants to, it has room to break below $63K again. How much capitulation follows from there, nobody knows yet.
So watch the reaction here. Let the level and the event pass before committing.
#Bitcoin #Crypto
It played out on $ETH too, and I warned you about this one.
Yes, we got the clean +7% on the LTF. But right after, I flagged the danger: if ETH couldn't break through the grey zone, the whole push was at risk. That third test failed, exactly as I said it could.
The reason was never hidden. Overleveraged longs had stacked up, and a sweep of that leverage was always on the table. And for the record, that flush is actually healthy for ETH long term. It clears the excess.
Same situation as #BTC right now. ETH is testing the orange circle on the ascending channel support built since early July. If it can't hold here, the next stop is the two yellow circles below. Those are the last line of defense. Lose them, and $1,500 comes back into play.
Watch how price reacts at these levels. Let them confirm before you commit to a direction.
#Ethereum #Crypto
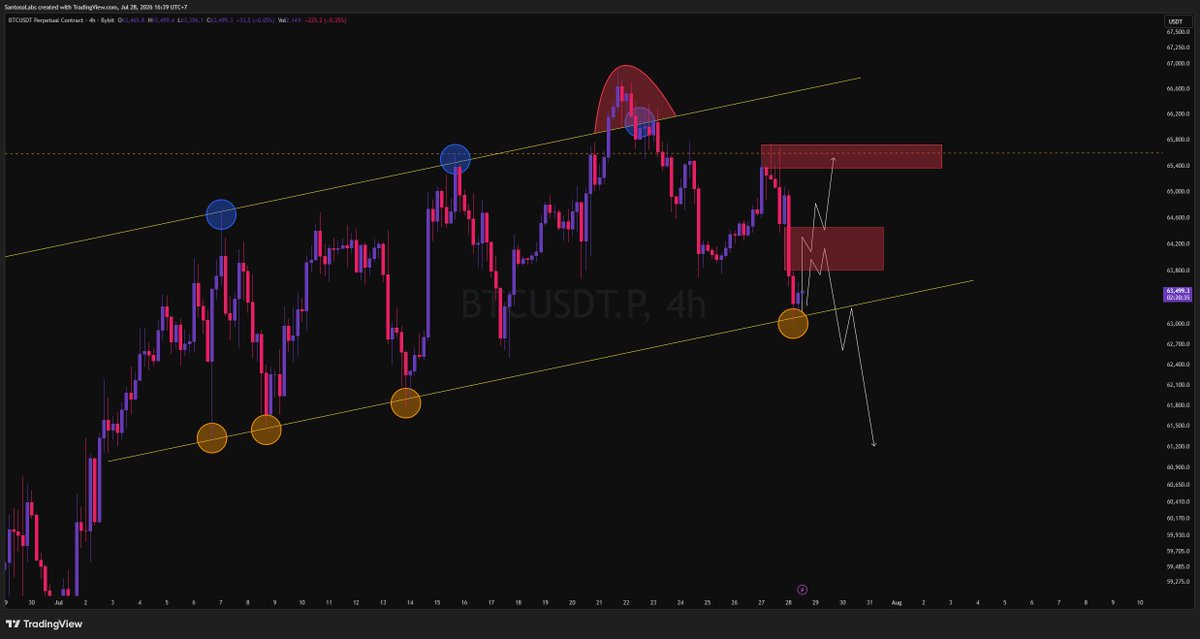
I warned you about this. The correction on $BTC came fast, exactly as flagged.
No surprise there. When a market is stacked with overleveraged longs, even a small trigger sweeps those positions and turns into a squeeze in reverse. That's the danger I kept pointing to.
Here's the tell most people miss: price rose slowly, then dropped sharply. That asymmetry alone tells you the structure was never strong. And it can get more brutal, because there's still plenty waiting below. All it needs is another spark.
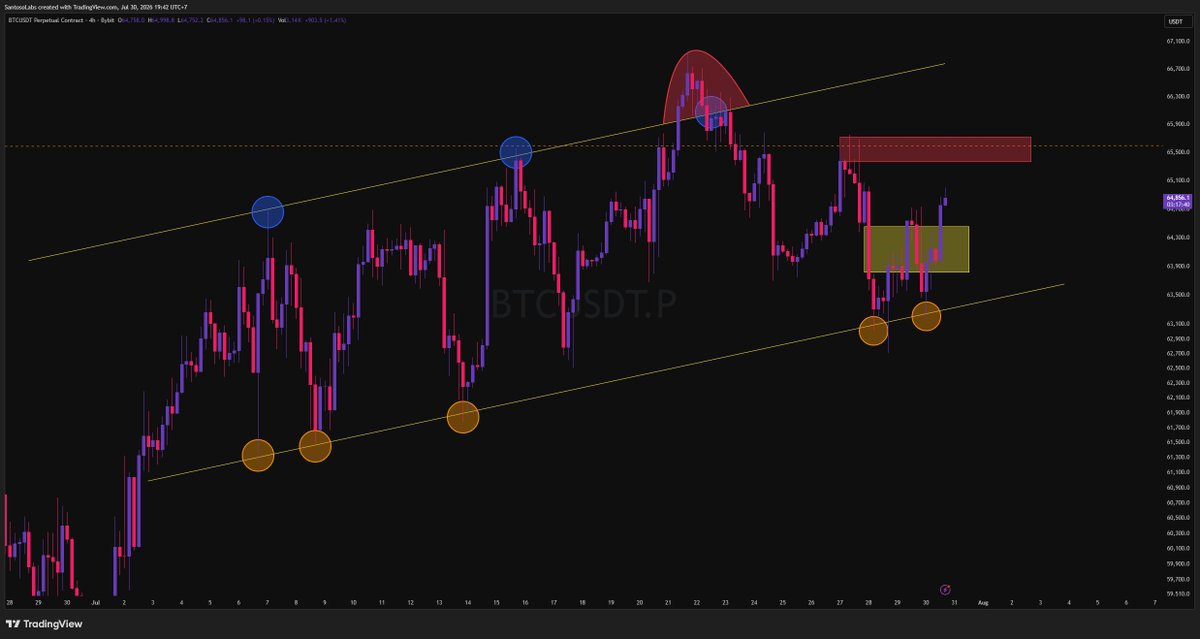
Now the technicals. BTC is retesting the ascending channel support built since early July. This is a crucial zone, it has already held three times. My expectation is a small pull back up to test $64K. If it can't break through there, we head toward the lower area.
None of this is guaranteed though. FOMC hits this week. Volatility is about to spike, and a small trigger this time can sweep a lot in one move. Watch the reaction, don't front run it.
#Bitcoin #Crypto
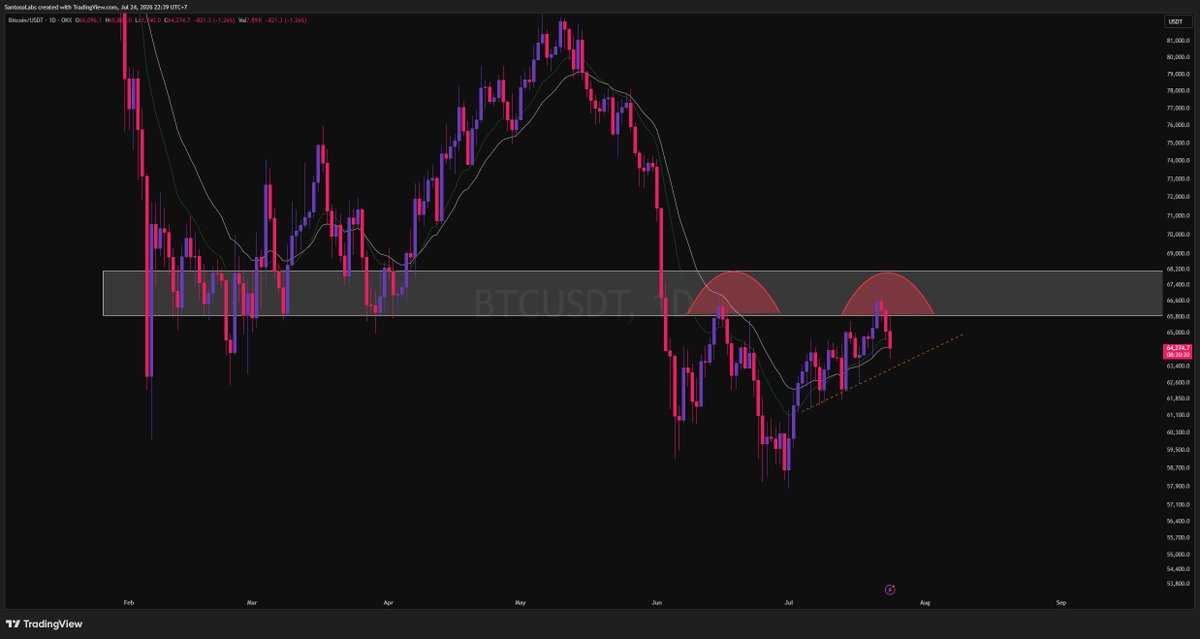
$BTC Rejected right at the zone we mapped. No surprise there.
Now the question shifts to support. Can $63K to $64K hold this correction?
If it holds, we still have a shot at retesting $67K to $68K, especially with FOMC on the table next week. That event can provide the fuel for another push at resistance.
But if $63K breaks, the odds of seeing $60K open up fast.
That's the whole map right now. $63K to $64K is the line that decides the next move. Hold it, resistance stays in play. Lose it, $60K comes into range.
Don't guess the direction. Let the level confirm it, then act.
#Bitcoin #BTC #Crypto #PriceAction