2 things stand out in this chart. First this is a chart of the 30 yr, 10 yr, 1 yr & 3 month t-bill interest rates from 12/31/1979. Second, understand that bond prices rise when rates fall.
2020 is the first/only time in the 44 years of this chart when the rates for ALL these maturities converge on zero. In 2008, the 30 yr & 10 yr interest rates were robustly positive even as the Fed crushed short term rates.
From being in that market, I remember persistent panic about hyperinflation. And you can see spikes in the 30 yr & 10 yr rate in 2010, 2011 and 2013. This occurred as the US and world economy teetered at/near deflation. The Fed was hoovering up every bond it could find to spread liquidity as far and wide as possible.
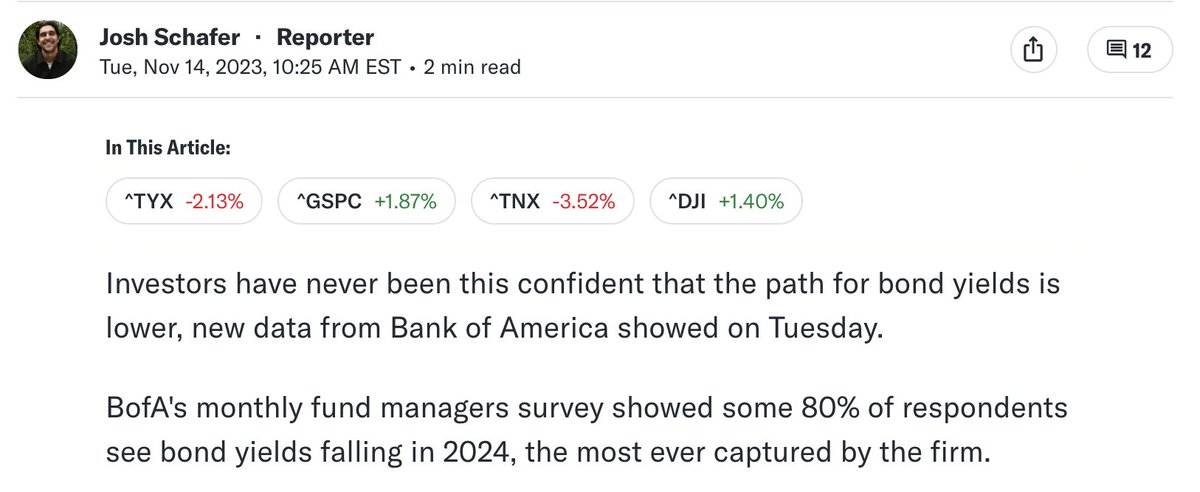
So, the bond market making a wrong way bet on lower rates even as the Fed (and inflation, employment, consumer spending, GDP etc) points to higher for longer is not out of character.
One more thing to point out thats different now. If you look at the chart, you'll see one big difference in this rate cycle. Long rates are lagging short rates higher leaving a inverted yield curve in place for nearly 2 years now. 2 years? With no recession or crisis or crash. Hmmm. 🧐🤔🤨
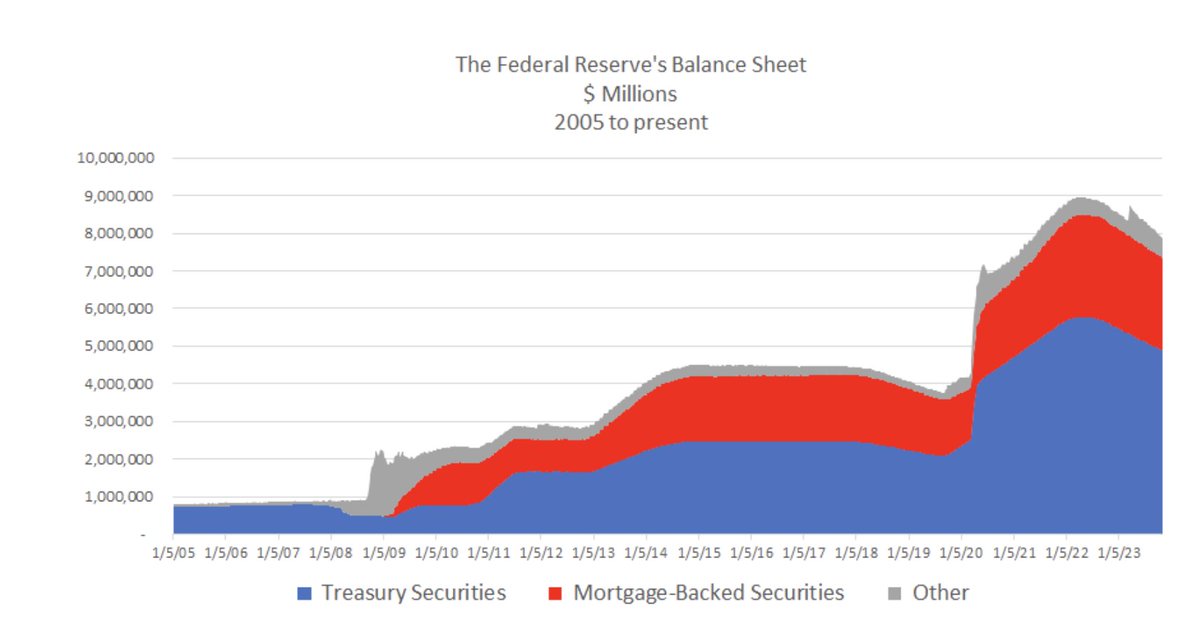
Yeah, something is different this time around. I believe its the cumulative effect of Fed's ZIRP/QE (quantitative easing) and the astonishing spending binge of the US govt in the pandemic. There is way too much money in the system. This is why even after 2 years of rates rising, QT (quantitative tightening) there is no recession, crisis, crash. Its business as usual.
Bond buyers are looking back in hope at the last 14 years and wishing for it to come back. But, all the signals point to higher for longer, no disaster, no recession, no crisis, no crash and most importantly no cuts from the Fed.
In my opinion, rates stay in and around current levels for a long time.
You should never begin your analysis with price.
Begin your analysis by looking at financials, the business, the opportunities in front of it a business. Facts, data, information.
After that you look at the demand/supply balance of the stock to see what is already reflected in the price.
Most people have no formal weighting system for when they bet/invest/speculate/trade. However, this is a critical thing to have no clue about.
From experience, most people without knowing it bet based on their "edge." Edge means what you feel you know/understand or believe/feel yourself to be expert at.
However, "edges" are mostly illusory. The only real edges tend to be illegal like insider information.
As outside investors truthfully, we mostly parrot what the thing that made an impression on us - a post, a article, a podcast, Youtube video or a tip. Often, that thing is well known, understood and widely circulated and has little to no information value. Well known, understood & circulated information has no value because people will have incorporated that information into price already.
Going back to weighting. Now, there are folks like Warren Buffett who believe/feel they have an edge - an understanding of certain types of businesses. For these kinds of investors, there is a formula. It's called the Kelly formula. To call it a formula though is a misnomer. Its more like a rule of thumb. The reason why I say that is because the Kelly formula goes as follows EDGE/ODDS. In short, estimate your edge and divide it by the odds. Simply put you bet/invest more when you have a good edge and good odds.
Warren Buffett (by his own admission) has the knowledge, understanding and expertise to do this ONLY for a select number of businesses. So this kind of weighting is really for the absolute elite investors.
So then, what's the alternative? I have for a long time guided my subscribers to equal weighting by dollar amount and letting it be. That means setting up an amount $100/$1000 etc and to buy equally across a portfolio. Then, you just let the portfolio swing up and down. Over time, your portfolio will concentrate to the biggest winners.
I came to recommending equal weighting for three reasons. First, it limits position sizes in a systematic way. And by limiting position size, you limit your risk. Equal weighting also removes the temptation to follow false EDGE beliefs. It also avoids ALL IN, single stock/investment bets that are a common practice among non-professonal investors. Finally, equal weighting removes your own biases, committing to owning things that you might not otherwise buy. Unlikely things often happen. Just think of how many people avoided $TSLA based on the idea that EVs were a sure fail.
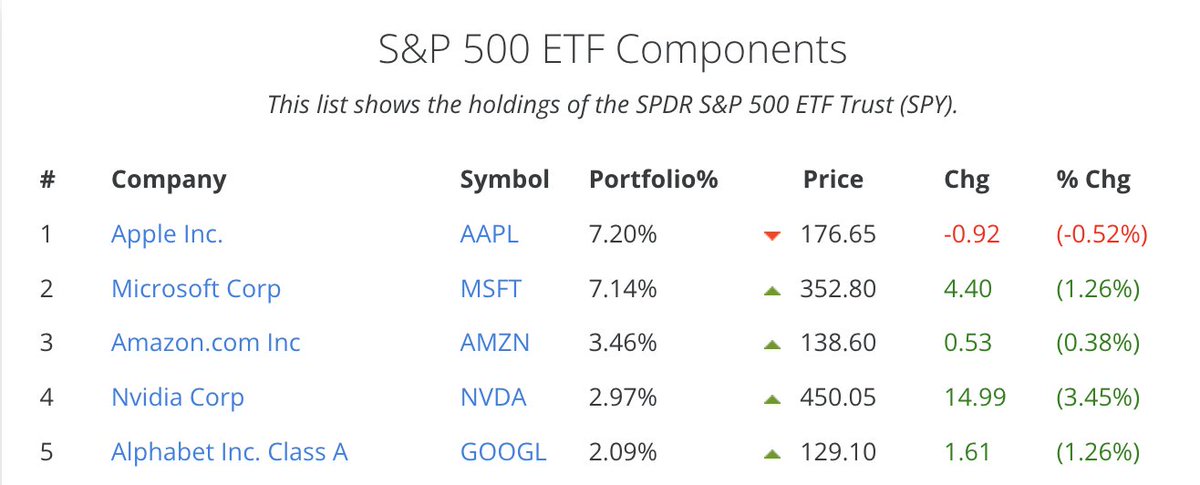
Another way to weight is to weight by market capitalization or "cap weight." Cap weight in simple terms means the bigger the company's stock market value, the higher your investment in dollars. For example, the $SPY is a cap weighted portfolio of the largest 500 companies that trade in the US. $AAPL is the largest company and has a weight of 7.2%.
Cap weighting has a trend following bias. By that I mean that, the bigger the company the more dollars it gets allocated. This can be a problem if these companies end up being near their peaks or have a major problem, In the current market for example, where investors have herded themselves into the "Magnificent 7" and this has caused unprecedented concentration. The top 7 companies command an astonishing 27% of the value of the S&P 500.
Bottom line. Everyone should have an idea of how they are allocating their money. Putting in my money based on personal beliefs is really for the true elite investors. The rest of us need to have a more modest system. The two that are easy to understand and implement are equal weighting and cap weighting. Personally, I believe equal weighting is better/safer/better performing. While this is debatable, there's evidence supporting equal weighting in research and in the very long outperformance of $RSP (the equal weighted version of $SPY). Finally, none of the ways to weight mean that you can't or wont' lose money. However, having a system to weight can mean you lose less when things go wrong like they inevitably do in the markets.
Not investment/financial advice. Just my take on things.
When rates were zero/low depending on the stock mostly one thing mattered - forecast/guidance on sales growth, EPS, dividends, beat/raise game.
No more. Now its everything - the forecast, sales/profits/cashflow, debt, shares issuance/dilution...etc
$MSTR is one of the most unusual, unique and potentially rewarding setups to benefit from a #Bitcoin rise.
$MSTR owns 158,245 #Bitcoin which is worth approximately $5.46 bill. at current prices
To acquire these #bitcoin they've used debt & cash. Debt is $2.18 bill. Debt generate interest expense of approximately $52 mill. a year.
$MSTR has 16 mill. shares outstanding and its market capitalization is $6.7 bill.
What's the difference between a direct bet on #Bitcoin versus $MSTR?
Leverage through the debt it has incurred to load up on #Bitcoin. In the success case scenario, the price of #Bitcoin rockets up. The value of the debt loses value due to long term inflation. With appreciated #Bitcoin, it can pay back the debt. Whatever #bitcoin is left, belongs to $MSTR shareholders.
$MSTR has a relatively puny $834 mill. of shareholders equity. In success mode, the potential returns that accrue to equity holders from a #Bitcoin rise are huge.
$MSTR is essentially a levered hedge fund with a monster, unprecedented bet on Bitcoin. And this bet is a predicated on the decline of US Dollars that will translate to a huge rise in the price of #Bitcoin
Will it work out? Well, stock markets are skeptical. Nearly 25% of $MSTR are sold short. Time will tell but imo (nfa) this is a good, well structured bet that could in success mode generate a return that is 2X - 3X what #Bitcoin generates.
Not investment/financial advice. Just my opinion/take/view on things.