@MikshuAlpha I’ve looked back at the charts for a few of the similar CC days with the steep U formed. If the CC decrease continues at open, from my eyes the most actionable angle I see is the opening CC steep drop during and shortly after open. Once CC begins to flatten the advantage stalls.
There is an intraday rotation edge hiding in this chart.
Blue = $IGV (software)
Red = $SMH (semis)
Yellow = correlation of IGV to SMH
Vertical lines = US cash open
Most traders can see software and semis are rotating.
But the more useful question is not what is rotating.
It is when the rotation actually becomes tradeable.
Look at where the relationship changes… then look at what tends to happen later in the session.
I’ll post my read after people have had a look.
What do you notice?
+500%, +4,000%. +1,000%.
That was the $SPX sequence of wins yesterday.
Long at the open.
Short through the 7,430 gamma trap.
Long again almost exactly off the lows.
Several MikshuAlpha members caught 500%+ gains because the key level was mapped before the move, with live commentary as it happened, not explained after it.
The whole day came from my pre-market note published here yesterday: 7,430 was the trapdoor.
Above it, the market still had support.
Below it, dealer hedging could accelerate the downside.
That is exactly what happened.
I’m more of a swing trader.
But when the regime demands it, you trade the regime.
Yesterday was not about guessing direction.
It was about understanding gamma, vol, flow, positioning and where the market could become mechanical.
MikshuAlpha is not a signal room.
It is a live market room for traders who value detailed explanations to help inform their own decisions.
£20/month and proceeds go to charity. Link in bio.
Pre-market analysis, Thursday 4th June, 2026
1. Market Summary
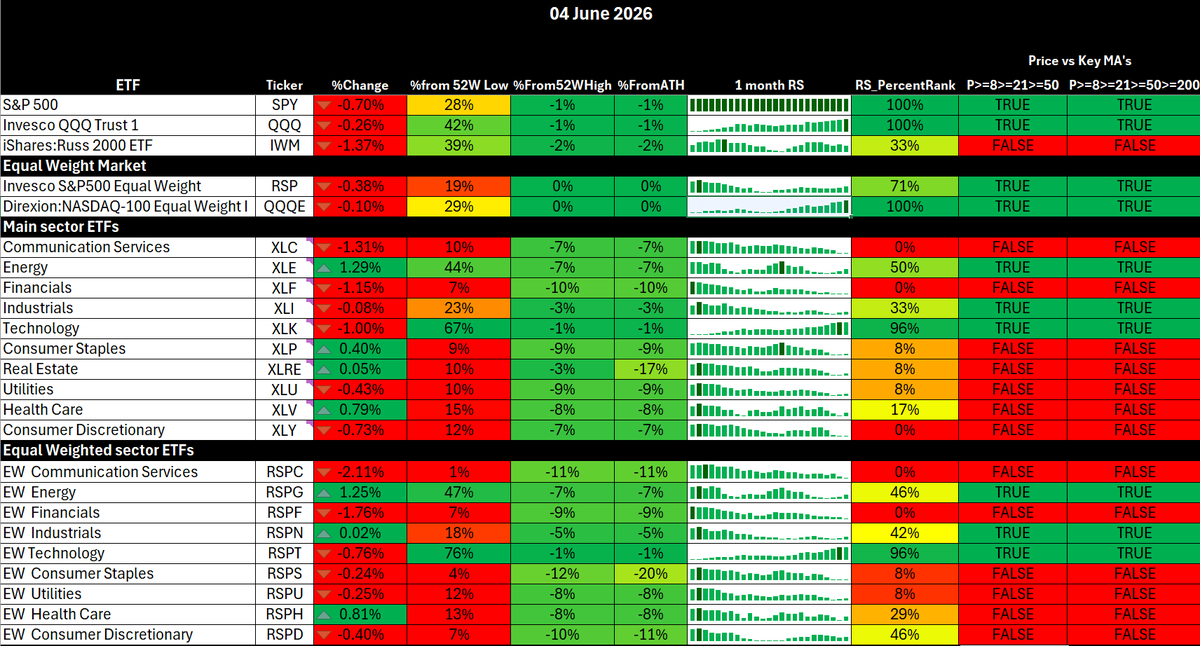
Yesterday was the first proper wobble after the grind. $SPY opened at 758.15, flushed quickly to 753.57 and closed near the lows at 754.24, down 0.70%. $QQQ held up better, down 0.26%, while IWM took the real damage, down 1.37%. That tells me this was not broad institutional panic, but it was a clear warning shot into smaller caps and riskier beta.
My read: still a bullish bigger picture, but today is a genuine test. The low vol regime is still fighting hard to survive, but the gamma structure has deteriorated sharply. That means this can either be a bear trap if SPX holds the 7,535 area and AVGO damage is contained, or it can become a proper negative gamma air pocket if semis fail and spot breaks below the flip.
The key question today is simple: does SMH absorb the AVGO hit, or does AVGO reprice the whole AI hardware complex?
2. Macro analysis
US macro remains awkward for risk assets because growth is not weak enough to force a dovish Fed, while inflation pressure is still being fed by energy and supply chain stress. The latest ISM services PMI rose to 54.5 from 53.6, with prices paid rising to 71.3, the highest since August 2022. ADP private payrolls rose 122k, while Friday’s NFP consensus is only 85k with unemployment expected at 4.3%. That is a “growth holding, inflation sticky” mix, not a clean Goldilocks backdrop.
US economic surprise indexes are running at their strongest in three years, while futures were pricing almost a 50% chance of a Fed hike by October. That matters because stretched AI, stretched multiples and hawkish rate repricing is not a clean combination.
The AVGO catalyst is the immediate equity risk. Shares were down around 12% pre-market after revenue missed expectations and the AI outlook failed to deliver the “beat and raise” that the market wanted. The key point is not that AVGO is broken fundamentally. AI semiconductor revenue still grew 143% year on year to 10.8bn. The problem is expectations. The market wanted perfection, and anything less is being punished.
Eurozone macro is stagflationary at the margin. Inflation rose to 3.2% in May, core rose to 2.5%, services inflation rose to 3.5%, and energy costs were up 10.9%. Markets have fully priced a 25bp ECB hike on 11 June. That is not a global liquidity tailwind.
China is mixed but slightly supportive on services. The private services PMI rose to 54.4 from 52.6, the fastest services expansion in three months, helped by new business and export demand. The problem is that input cost inflation also hit the highest level since October 2024, so China is not giving us a clean disinflationary growth impulse either.
Japan remains a rates risk. JPY is still weak near the 160 area, Japan services PMI fell to 50.0 from 51.0, and Ueda has shifted towards a clearer inflation-fighting stance, with June rate hike expectations now materially higher. That keeps global rate volatility alive.
3. Momentum and breadth
Breadth weakened enough to respect, but not enough to call a full regime break yet.
Nasdaq stocks above the 5 day average dropped hard to 32.83, which confirms short-term momentum damage. $SPY is still close to highs, but underneath the surface the tape is no longer as clean. IWM’s underperformance is the biggest warning because small caps were hit much harder than $QQQ, and Russell breadth has rolled over again.
RSP held up better than IWM, which matters. Equal weight SPX is not confirming a full market breakdown, while equal weight Nasdaq via $QQQE remains one of the cleaner areas in the ETF file. That keeps the bull case alive, but only if semis stabilise.
The best tactical work today is relative strength work, not chasing the first green candle. Weakness inside a bullish structure is where the next leaders reveal themselves, but the right move is to let leaders come back to good spots rather than chase extended names into a cool-off.
4. Volatility
Vol is the most important divergence. SPX fell 0.74%, geopolitical headlines were active, AVGO is down hard, yet fixed strike vol was sold rather than aggressively bid. That is not what a real risk off tape should look like.
VIX is only around the mid 16s to low 17s, VVIX is around 89.8, VIX1D is subdued around 11.48, and VX2/VX1 is up around 1.145. That is steep contango and still a vol selling environment. The message is clear: spot weakness is being treated as chop, not crisis.
Put/call ratios are also not panic. PCC is around 0.80 and equity only put/call is around 0.65. There is some hedging, but not a capitulation bid for protection.
The trap setup is active. Above SPX 7,535, vol sellers can lean back in and the 7,600 magnet can reassert. Below 7,535, the new negative gamma zone opens up and the selloff can accelerate quickly. This is not a day to be blindly bullish or blindly bearish. It is a level driven session.
5. Credit and liquidity
Credit is not confirming panic. HYG/TLT is still holding around 0.934, HYG is not breaking down, KRE is holding around 67.88, and LQD/HYG has bounced but not in a way that screams systemic stress. That matters. If this were a real broad deleveraging event, credit would usually be shouting louder.
Funding also looks calm. SOFR-IORB is sitting around minus 0.02, so there is no funding stress signal coming through. Liquidity is not the problem today. The problem is positioning, gamma fragility, and whether the AI hardware narrative absorbs the AVGO repricing.
6. ETF and Sector rotation
The market still shows growth leadership, but with a clear deterioration underneath.
The important thing is that semis were still leading into yesterday’s close, with SMH up 0.90%, SOXX up 1.76%, XSD up 1.51% and SOXL up 5.34%. That means the AVGO test is happening from a position of strength, not weakness.
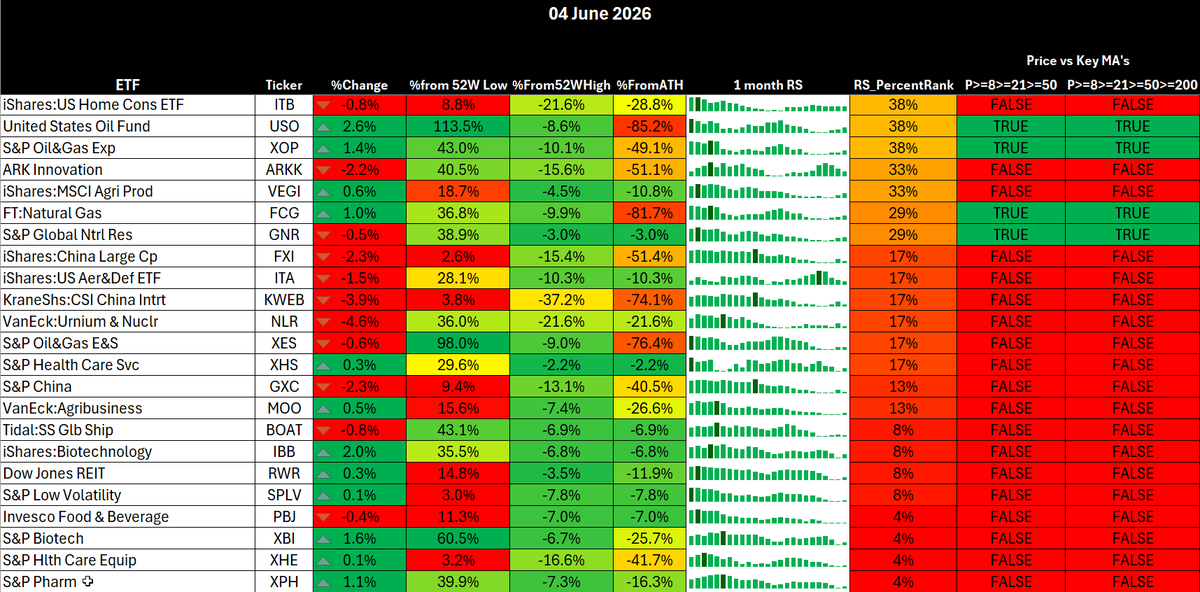
Low relative strength: XLC, XLF, XLY, RSPC, RSPF. This is not healthy broadening. Communication services, financials and discretionary are lagging badly, and small caps are no longer helping.
High RS pockets with MA support: SMH, XSD, $QQQE, SPHB, XLK, RSPT, IGM, DRIV, CIBR, HACK, PBW, ROBO. This is still a growth and innovation tape, but it is now a more fragile version.
Defensives are not taking leadership. XLP was up 0.40%, XLV up 0.79%, XLRE roughly flat and XLU down 0.43%, but none of them have the kind of MA or RS structure that says institutions are rotating into safety. That is important. This still looks more like a growth correction than a defensive regime shift.
Key watch: SMH and XLK. SMH remains the tell. If SMH shrugs off AVGO and stays above the rising short-term structure, the market can recover quickly. If SMH gaps lower and cannot reclaim, then
$QQQ loses its leadership engine and the SPX gamma break becomes much more dangerous.
7. Summary
My bias: cautious bullish above SPX 7,535, tactical risk off below it.
I still think this is more likely turbulence within a bullish structure than the start of a major top, mainly because vol is not confirming panic, credit is not confirming stress, funding is fine, and the best growth ETFs were still leading into yesterday’s close.
But the risk is real. The AVGO selloff matters because it hits the AI capex narrative at the exact moment gamma support has weakened. If AVGO pressure spreads into NVDA, MRVL, AMD and SMH, the tape can flip from controlled pullback into negative gamma liquidation very quickly.
My plan would be:
Above SPX 7,535: look for bear trap behaviour, VIX rejection, SMH relative strength and a move back towards 7,600.
Below SPX 7,535: stop forcing longs. Expect 7,500 first, then 7,475 to 7,450 if semis confirm weakness.
Best long candidates are not random dip buys. I want leaders that hold structure and single names showing clean relative strength into the weakness.
@MikshuAlpha Writing a follow up note.. Have been a member now since the start in mid Feb. 26’. The education is invaluable. I’ve followed Mik since Tenet and continue to learn every day. With disciplined entry and trims, the swing trades alone have officially doubled my book in 5 months.
@MikshuAlpha Quality content in the telegram as always Mik. Loved the video today walking through Monthly timeframe and some real beautiful setups were shown. A good reminder for us all to zoom out.
Pre-market analysis: Friday 29th May, 2026
1. Market Summary
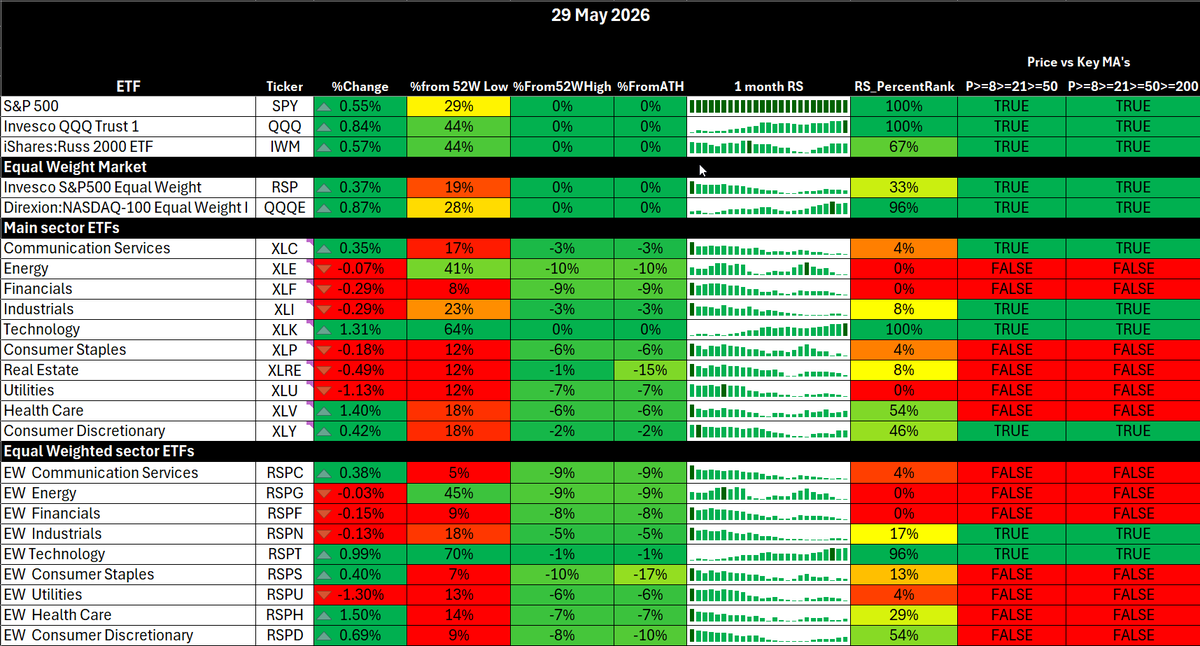
This is still a risk-on tape, but we are now entering the more fragile part of the move. Yesterday was another all-time-high session, with $SPY opening at 750.25, tagging 755.15 and closing up 0.55%. QQQ added 0.84%, IWM added 0.57%, and the more important point is that breadth finally joined the rally rather than mega-cap tech carrying the whole market alone.
My read: bullish, but not a clean chase. The bid into Friday OpEx has played out exactly as expected. SPY has already tagged 756.50 pre-market, VIX is now below 16, VVIX is down near the mid-80s, put/call is low, and vol term structure has steepened hard. That is supportive mechanically, but it is also where the tape starts to become vulnerable to call-delta decay, call-skew fatigue and a post-OpEx air pocket.
The key level remains SPX 7500. Above there, dips are likely bought. Below there, the market can start to lose some of the expiry support. Below SPX 7400, the positioning picture becomes materially more defensive.
2. Macro analysis
The macro impulse this morning is supportive for risk, mainly because the oil shock is easing. Brent and WTI down nearly 2% today, with Brent down around 11% on the week, as markets price a possible US-Iran ceasefire extension and potential easing of shipping restrictions through Hormuz, although the agreement is still not final.
US inflation is not benign, but it was not a fresh shock either. April headline PCE rose 0.4% month on month and 3.8% year on year, while core PCE rose 0.2% month on month and 3.3% year on year. Real PCE only rose 0.1%, so the read is stagflation-lite rather than clean Goldilocks: inflation still sticky, consumer spending still positive but slowing.
Europe is the macro warning flag. Inflation across the eurozone’s four largest economies stayed above the ECB’s 2% target for a third month, with France rising to 2.8%, Italy to 3.2%, Spain stable at 3.2%, and eurozone-wide inflation expected around 3.3% for May. That keeps ECB hike risk alive and means the oil shock is still feeding into inflation expectations outside the US.
China remains mixed. The May manufacturing PMI is expected to slip to 50.0 from 50.3, right on the expansion/contraction line, while weak domestic demand and higher input costs remain the drag. The PBoC has also reportedly told major banks to boost lending because household and corporate credit demand remains weak. That is not risk-off today, but it is a reminder that global growth is still uneven.
Japan is not giving us a clean global easing story either. Tokyo core CPI slowed to 1.3%, below the BoJ’s 2% target and below expectations, but factory output rebounded 0.8% and markets are still debating a near-term BoJ hike. Japan also spent 11.7 trillion yen, around 73.5bn, supporting the yen, yet USDJPY is still sitting close to 159.
3. Momentum and breadth
Breadth is the best part of the bull case. Nasdaq stocks above the 5DMA are around 63%, S&P tech stocks above the 5DMA are around 67%, Russell short-term breadth has recovered into the mid-60s, and Russell 2000 stocks above the 200DMA are around 62%. That is not blow-off breadth yet, but it is a big improvement from the narrow mega-cap-only tape earlier this month.
The message is simple: this is no longer just MAGS dragging the index higher. IWM is participating, QQQE is strong, semis are still high RS, software has improved sharply, and high beta is bid. That supports the rally into OpEx.
The warning is that several breadth gauges are no longer washed out. They have recovered meaningfully, so the easy contrarian long from oversold breadth is gone. From here, bulls need continuation, not just mean reversion.
4. Volatility
Vol is now the clearest complacency signal. VIX is around 15.5, VVIX is around 86, VIX1D is near 10.9, and the VX2/VX1 ratio is around 1.125, which is steep contango. That is classic low-vol, carry-friendly, risk-on structure.
Put/call also confirms complacency. Total put/call is around 0.765, and equity-only put/call is around 0.587. That is not panic. That is upside participation and low hedging demand.
This supports the “theta harvesting still works” view, but it also means fresh short-vol is no longer as clean from here.
The trap setup today is spot up, vol up or spot flat, vol up. If SPY pushes higher but VIX and VVIX stop falling, that would be the first sign that upside is becoming unstable rather than mechanically supported.
5. Credit and liquidity
Credit is not flashing stress. HYG itself is firm, KRE has recovered strongly, and HYG/TLT remains elevated despite a small pullback. That tells me credit is still broadly validating equities.
The one minor divergence is that LQD/HYG has stopped falling and is trying to stabilise. That is not
enough to call risk-off, but it says the credit impulse is no longer accelerating as cleanly as equities.
Liquidity is fine.
SOFR-IORB is sitting around -0.02, with no funding stress signal. That keeps the background supportive for risk assets and volatility compression.
6. ETF and Sector rotation
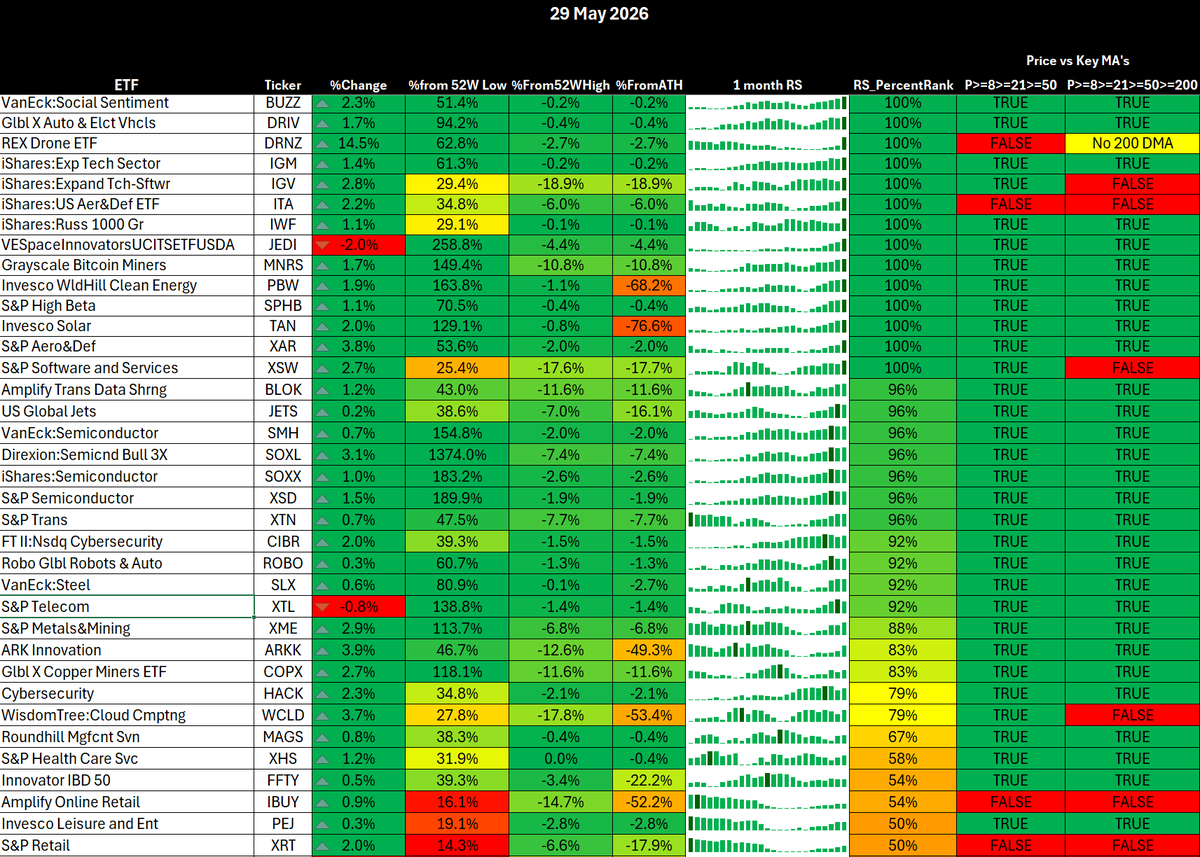
The ETF snapshot is decisively risk-on. Growth, tech, semis, software, cyber, high beta, solar, clean energy and select cyclicals dominate the leadership board.
Defensives and rate-sensitive areas are not leading. That is exactly what you want to see in a bullish tape, but the move is now becoming increasingly stretched.
The strongest leadership cluster is concentrated in XLK, BUZZ, DRIV, IGM, IGV, IWF, MNRS, PBW, SPHB, TAN, XAR and XSW. That tells me the market is still rewarding growth, momentum, tech and thematic beta rather than hiding in defensive or low-beta areas.
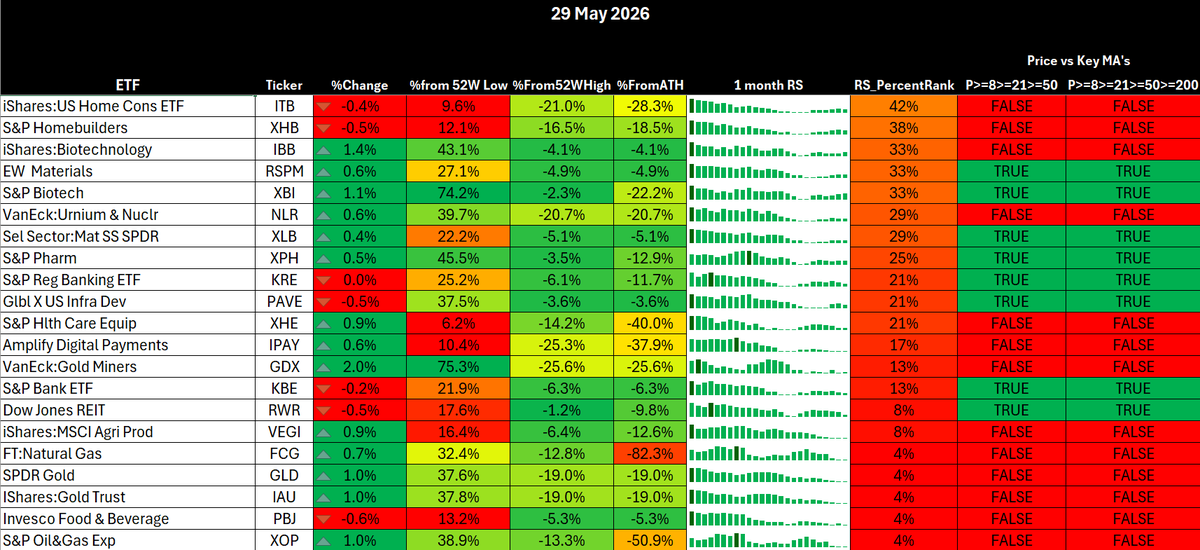
The weakest areas remain XLE, XLF, XLU, RSPG and RSPF. Energy, financials and utilities are not confirming the leadership move. That is not a problem for the index while tech and semis are carrying, but it does show the rally is still selective rather than universally strong.
High RS pockets are very clear: XLK, SMH, SOXX, XSD, QQQE, RSPT, IGM, IGV, CIBR, TAN, PBW and SOXL are all showing strong relative strength with supportive moving-average structure. That is a clean growth and semiconductor leadership signal.
Defensives are weak. XLP, XLU and XLRE remain poor relative-strength areas and are not showing proper moving-average support. XLV is better than the other defensives, but healthcare is still not a true leadership pocket yet.
Growth and cyclicals remain the core of the tape. QQQ, XLK, SMH and QQQE are still the cleanest leadership reads, while IWM participation is encouraging and shows the rally has broadened beyond mega-cap tech. RSP is also above its key moving averages, but the relative-strength quality is still not as strong as Nasdaq, semis and thematic growth.
Key watch: SMH and XLK need to keep leading, QQQE needs to keep confirming breadth inside Nasdaq, and IWM needs to avoid rolling over after this catch-up move. If those hold, the tape remains risk-on. If semis stall while defensives fail to rotate higher, that is where the market becomes vulnerable to a post-OpEx pullback.
7. Summary
My bias is mildly risk-on but late-cycle for this specific leg.
The trade today is not to blindly fade strength, because breadth, credit, vol compression and sector rotation are still supportive. But it is also not the point to aggressively chase upside calls into a euphoric OpEx gap after SPY has already tagged 756.50 pre-market. I may add 1 week index puts in small size to capture the unwind of any mechanical OpEx bid we've seen into today.
Staying bullish while SPX holds 7500 and VIX remains below 16. If QQQ, SMH and IWM all hold green after the first hour, dips should still be bought. The cleanest long setups are pullbacks into support, not opening impulse chases.
The danger zone is a failed breakout above yesterday’s highs, especially if VIX stops compressing, VVIX turns up from 86, and semis stop leading. That would likely raise call-delta unwind risk: everyone long upside, dealers long futures against short calls, then time decay or vol compression reduces deltas and forces futures selling back into the tape.
@MikshuAlpha Mikshu’s swing trades are world class. I can’t wait for the setups and absorb as much of the knowledge I can.
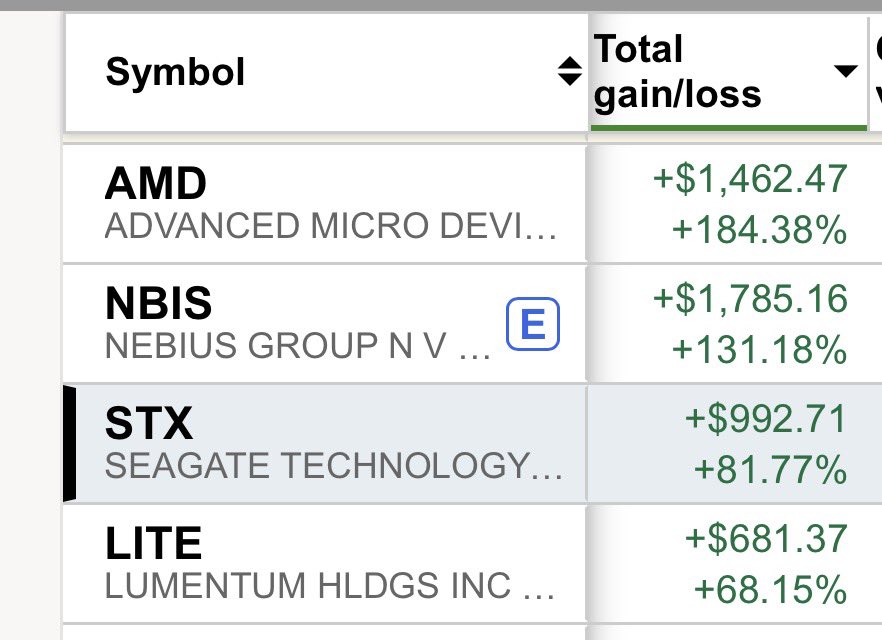
Over the past 3 months I’ve maintained proper risk and more than doubled my account. Here are a few of the top positions I got good entries on