Providing market research and analysis using Elliott Wave and market structure. Primarily covering the #SPY#QQQ and leading tickers. Not investment advice.
Follow @thex3sigma for market research and updates.
X3Sigma framework focuses on quantatative analysis of the market to bring unbiased information to traders. No emotions.
X3Sigma will be bringing additional tools, actionable options framework, and AI-enabled analysis soon
$AAPL #AAPL 4H chart
Moved higher in its B-leg, which was not expected. B-leg has now reached its maximum threshold as far as price goes and its respective Fibonacci retracements (1.618 and .854).
Price is also meeting heavier supply zones. Will need to see sellers step in and a reversal pattern take shape for the ABC to remain valid. If true, C-leg should complete lower, in the $211-216 range.
If they continue to move higher, then this would invalidate the current count.
$AAPL #AAPL 2H chart
B-wave looks to be in and they are set move lower in C-wave of W4 projected to sweep the $211 lows.
Break of support box and trendline (225-226) would add additional confirmation of the move lower.
$AMD #AMD Daily chart
Still expected to move much lower in the longer term. Completed a five-wave sequence and is now in a three-wave countertrend, which could see it top out at $153 (.5) for W2 before moving lower in another five-wave sequence.
Will keep this count for now as price action here has been very weak compared to the market in general.
$AMD #AMD Weekly chart
No changes since last update. Sweep of the projected $138 level occurred as expected.
The bounce off the .618 has been relatively weak as they did not reach the minimum target $143.19, so the bounce here may not be over.
However, the overall move and respective target has not changed. They should move lower to sweep the $107 levels in the next couple weeks to come.
If price stays below the volume support box $137-142, then sell pressure will intensify. The next structure break would come at $132, and should trigger the next leg lower.
$NVDA #NVDA 8H chart
Came very close to the W5 target of $155 and a correction followed as expected. Because this would be a 1-2, the correction hasn't quite gone deep enough to say W2 is in.
Price is expected to fail at current levels - near the .764 or .854 (147-149) to complete B and C lower.
However, if price breaks above these levels, it would indicate that W2 was very shallow and we can expect to see a very strong bullish run to end the year. Until then, will stay with this count until it's invalidated.
$NVDA #NVDA 4H chart
As expected, they moved higher in its final W5 before a major top. The move higher did complete a nominal high, but they did not reach any of the usual W5 targets, so the move here may not be done.
Lowest W5 target would be $155.84 and an extension would be $167.40.
If price falls through the volume box $145, then top is in. If not, then should push higher to reach one of the targets.
Keep in mind, this would be a W5 top and the correction would be a major one.
$TSLA #TSLA 8H chart
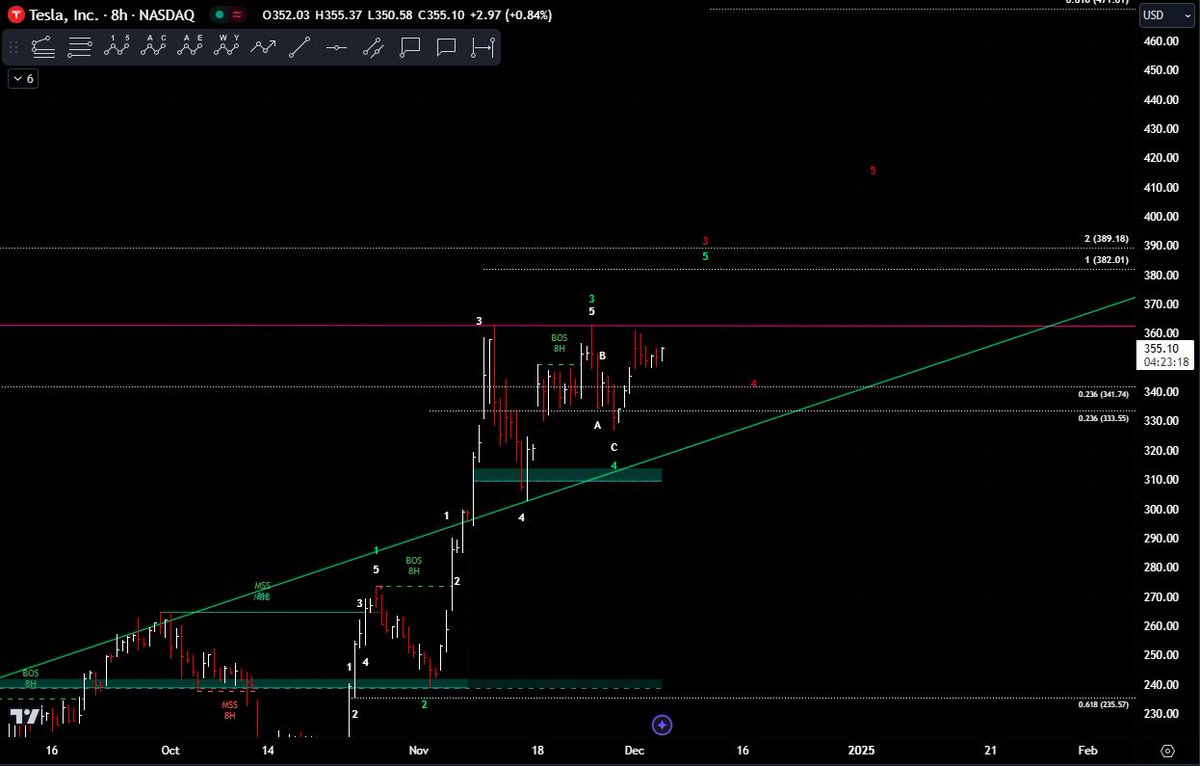
They truncated the previous W3 of W5 and also truncated the W4 correction. Usually this does not happen, but when it does, they are looking to speed up the cycle.
Currently, the entire cycle is not complete and price should head higher in a series of W3, W4, W5s. Because of this, price action will be very choppy.
Next in line is a move higher to complete W3 of W5 in the $382-389 range before another W4 correction.
$TSLA #TSLA 4H chart
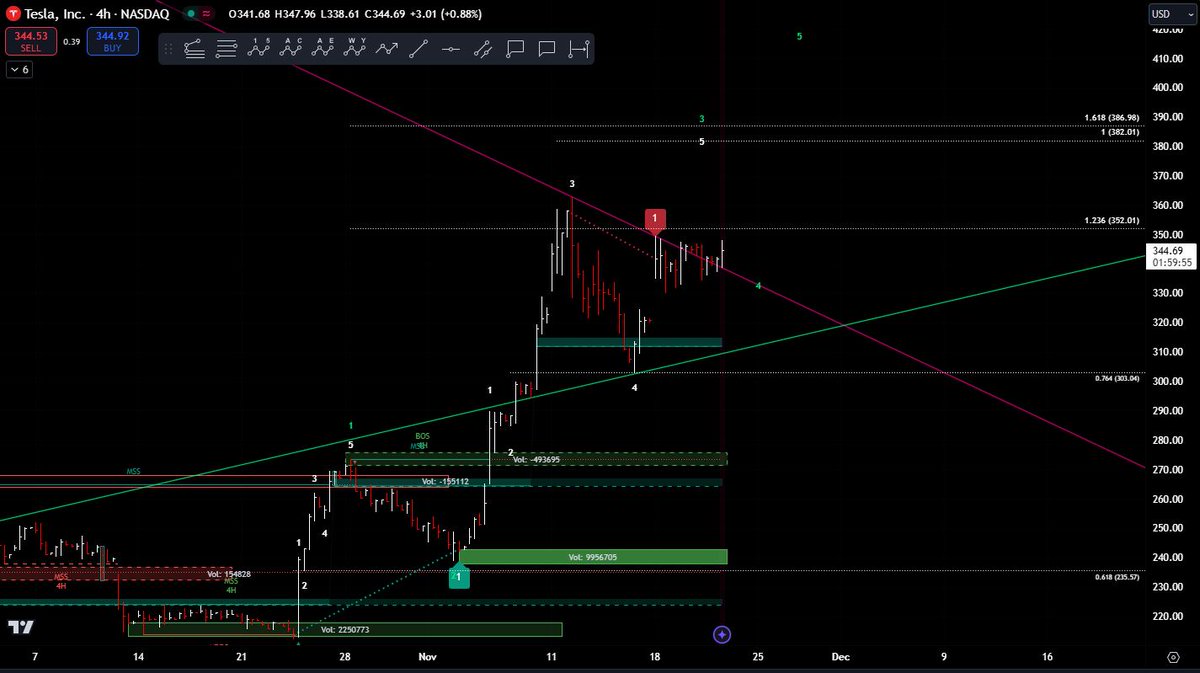
The primary count projected an incomplete sub-wave with a high sweeping the $386 range before correcting.
Although this is still the primary count and is still possible, the move has taken far too long to materialize with no clear impulse waves.
Because of this, caution should be utilized as the alternate count would be a completed sub-wave (W5) that completed a W3 and price is in a complicated WXY correction that would complete near the $286 levels.
Primary count: Price needs to break above $352 and should do so in the next session or two (this is pushing it).
Alternate count: Price breaks below trendline and $333.44 to confirm they are headed lower.
$SPY #SPY 8H chart
Invalidated the count. By doing so, they shortened this bullish run as they are in an ending diagonal for W5 of W3.
Minimum target would be around the $616 range with extensions to $622-627. With so much negative divergence building in the higher timeframes, should be pretty careful at these levels.
Once this cycle ends (W5 of W3) the correction will be quite large as they complete a higher degree W3.
$SPY #SPY 4H chart.
They are in the final stages of completing the ABC countertrend and a reversal should occur at current levels or near $596.32
This would completed the B-wave top with a C-wave to come, which is projected to sweep the $562 lows.
$BTC #BTC 8H chart
W4 corrected into the expected (upper) range, $90K. There is a nice impulse forming, which should take price to new ATHs.
To confirm, they will need to break the 8H resistance trendline, which would trigger a the minor sequence (W3-5) and complete another W3 of W5 in the $110K range before another W4 correction.
To note, if price fails, and breaks the supporting trendline, then the W4 correction would be lengthened into the $84K range. Although unlikely, it should be considered.
$BTC #BTC 4H chart
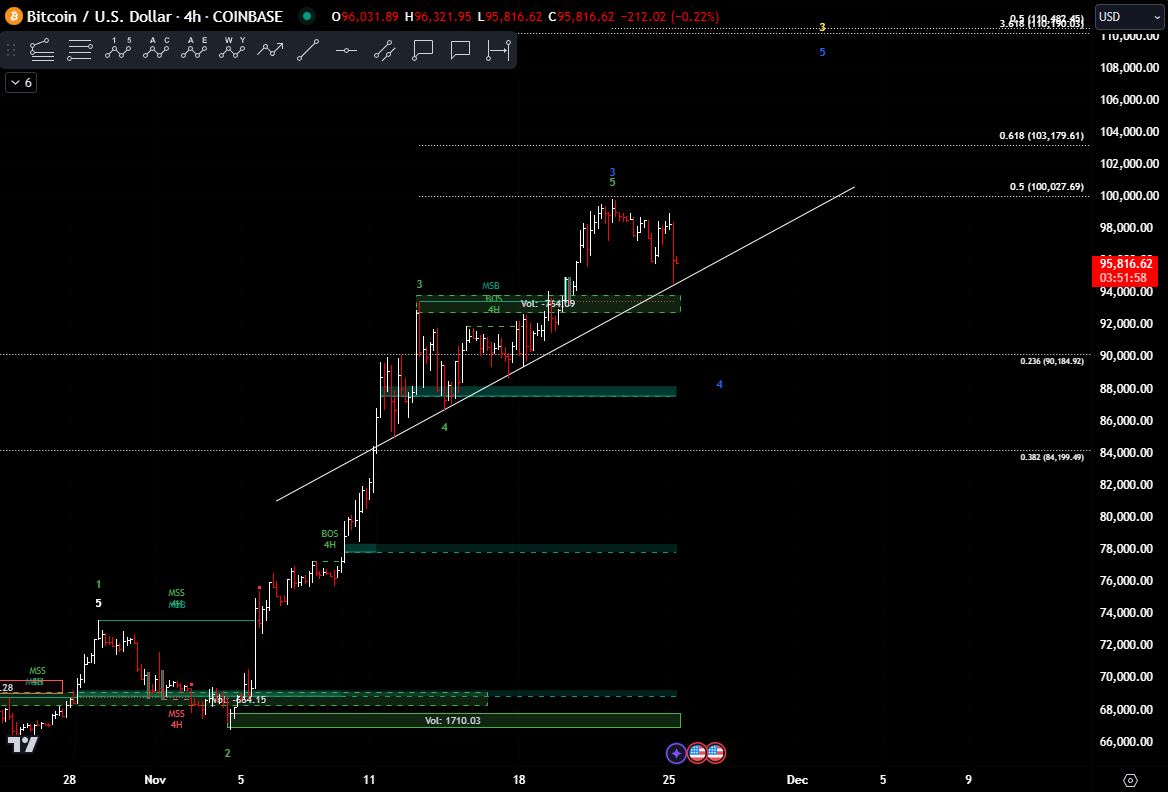
The price has risen higher within the fifth wave (W5) of the third wave (W3), with the expected sweep of the $100K level. Since the price has reached the 0.5 Fibonacci extension of the previous fourth wave (W4), there is a high probability that a prolonged corrective wave (W4) is beginning.
To confirm the start of W4, the price will need to break down below the trendline and volume support around $93,900. This breakdown would solidify the W4 correction, which could then retrace to the $84,000 to $90,000 range before completing.
However, as the price has not yet broken below the trendline and volume support, there remains a slight possibility that the fifth wave (W5) of the third wave (W3) could extend higher, potentially reaching $103,000, before the start of the expected prolonged W4 correction.
I often question how such accounts built relatively large followings when this is their explanation of a correction?
Market maker manipulation
FUD
Dropping the bid to cause panic
It’s hard to believe that retail traders actually believe these things.
$TSLA #TSLA
There is no news, Elon is NOT selling and it IS oversold now. There is no reason (other than FUD) that it should have lost $30+ in 3 days. MM's are manipulating the stock on low volume, dropping the bid and causing panic. Seen it 100X's. $TSLA
$SPY #SPY $QQQ #QQQ there is an elevated level of complacency in the market. A lot of retail traders have developed the mindset of "buy and hold" and it will go higher.
As an example, "On X date $TSLA #TSLA fell $19 but then ripped $30 higher the next X trading days. $500 by year end."
This builds up a lot of FOMO, coupled with complacency, and it is a recipe for disaster in the making.
$QQQ #QQQ 8H chart
Completed a five-wave sequence to the upside and is now in a correction.
A-leg was formed in a five-wave sequence to the downside and hit the usual .236 Fib target. They are currently working on B-leg, which can extend a bit higher, but should fail and head lower. C-leg is projected to complete near the $479.71 level.
On the next rollover, breaking through the volume support box (red) will accelerate selling a great deal.
$VIX #VIX 8H chart
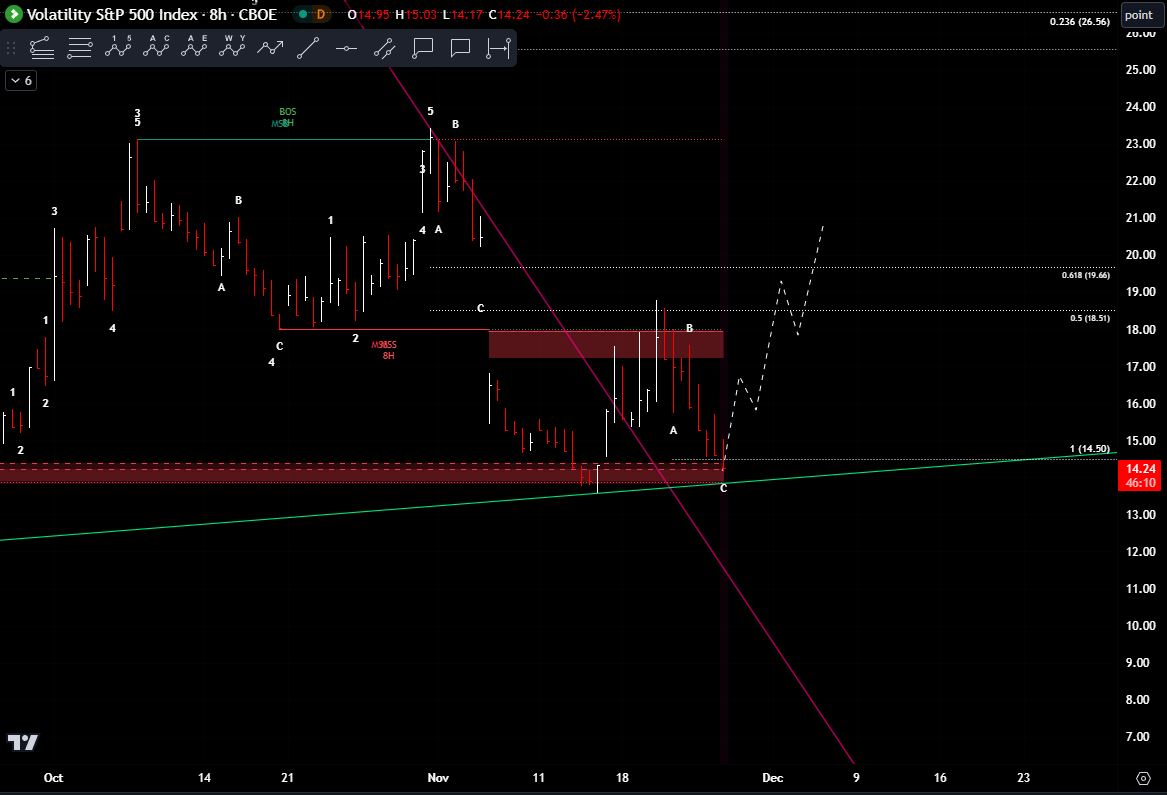
The retracement as now reached equal lengths (1:1) from the November 20th peak. Price is also at a strong volume support zone and trendline support.
As they complete the correction, they will look to build another five-wave sequence to the upside. If true, should see the $VIX spike higher and through the resistance (supply) zone.
$VIX #VIX 8H chart
Disregard the count as the previous structure failed. I haven't had a chance to breakdown the current structure, but it does look like they are attempting to restart an impulsive wave to the upside with a series of 1-2s.
1-2s are built very slowly but once complete, the 3rd wave is explosive, or can be.
If price breaks above $17.97, then there's a very good chance they will run this much higher, which can be problomatic for the market.
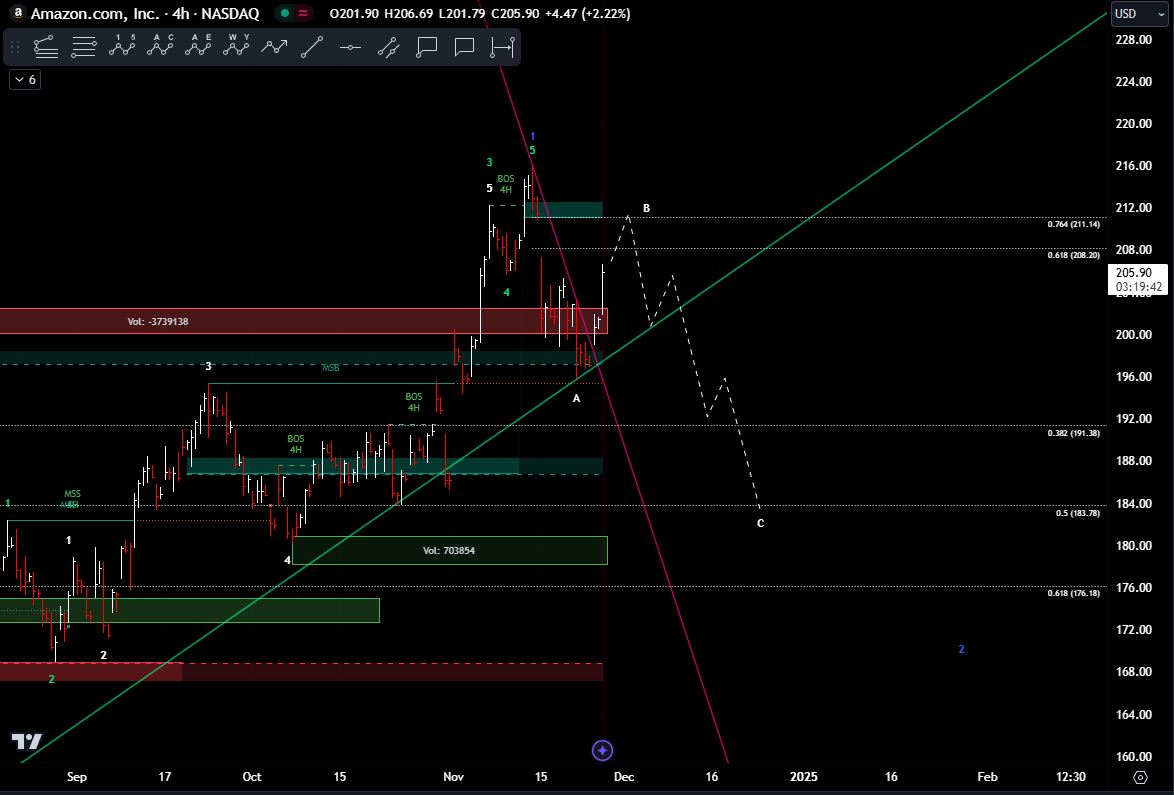
$AMZN #AMZN 4H chart
Moving as expected but minor adjustments are required. Due to the strength of the current bounce, it would seem that A-leg is in and they are working on B-leg, which can move into the $208-211 level before failure.
C-leg is now projected to complete at the .5 Fibonacci retracement or $183.76 price level.
$AMZN #AMZN 8H chart
As mentioned in the last update, if price moved any lower, then overall count needed review/adjustment
The primary now is a completed five-wave structure in place to complete W1 with W2 projected to sweep the $176 level to complete.
Currently, price is near a very heavy support zone (MSB, volume support box, previous breakout zone) so may see a minor bounce before heading lower to complete A (188-191).
$TSLA #TSLA 4H chart
Primary count continues to valid as price broke above $352 to record a new nominal high. With this new high, a five-wave sequence was completed, W5 of W3 and they have entered into a W4 correction.
W4 correction has only completed its A-leg, with a B-leg bounce in session before failure and C-leg to move lower into the $315-320 range before completing.
The next move higher would be another W5 of W3.
$TSLA #TSLA 4H chart
The primary count projected an incomplete sub-wave with a high sweeping the $386 range before correcting.
Although this is still the primary count and is still possible, the move has taken far too long to materialize with no clear impulse waves.
Because of this, caution should be utilized as the alternate count would be a completed sub-wave (W5) that completed a W3 and price is in a complicated WXY correction that would complete near the $286 levels.
Primary count: Price needs to break above $352 and should do so in the next session or two (this is pushing it).
Alternate count: Price breaks below trendline and $333.44 to confirm they are headed lower.
$BTC #BTC 4H chart
The price has risen higher within the fifth wave (W5) of the third wave (W3), with the expected sweep of the $100K level. Since the price has reached the 0.5 Fibonacci extension of the previous fourth wave (W4), there is a high probability that a prolonged corrective wave (W4) is beginning.
To confirm the start of W4, the price will need to break down below the trendline and volume support around $93,900. This breakdown would solidify the W4 correction, which could then retrace to the $84,000 to $90,000 range before completing.
However, as the price has not yet broken below the trendline and volume support, there remains a slight possibility that the fifth wave (W5) of the third wave (W3) could extend higher, potentially reaching $103,000, before the start of the expected prolonged W4 correction.
$BTC #BTC 4H chart
As expected, they have moved higher in a W5 of W3. They have hit the minimum target $96.8K of a W5 so the W5 of W3 top could be in.
If price breaks above the resistance trendline, then look for them to push higher to sweep the $100-103K target(s) to complete W5 of W3.
If price breaks below $95.3K, then the minor top is in and would be looking for a W4 correction.
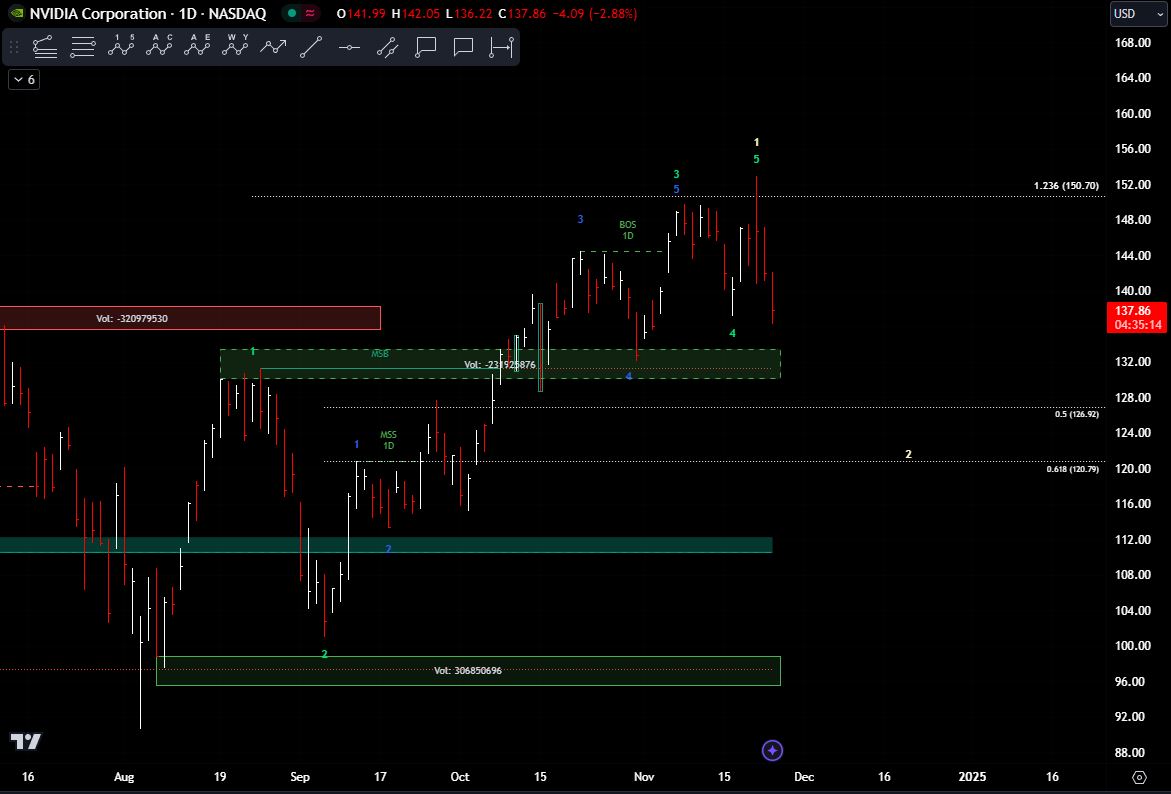
$NVDA #NVDA daily chart
As mentioned in the last update, if price fell through the 4H volume support box of $145, then the five-wave sequence would be marked complete.
Therefore, they have completed a W1 top and have entered into a W2 correction, which should see price get dragged lower into the $120-126 range in the next several weeks.
$NVDA #NVDA 4H chart
As expected, they moved higher in its final W5 before a major top. The move higher did complete a nominal high, but they did not reach any of the usual W5 targets, so the move here may not be done.
Lowest W5 target would be $155.84 and an extension would be $167.40.
If price falls through the volume box $145, then top is in. If not, then should push higher to reach one of the targets.
Keep in mind, this would be a W5 top and the correction would be a major one.
As $SPY #SPY completes its topping process in its B-wave and the $VIX #VIX builds for a potential W3 breakout, you will experience a lot of whipsaw.
Whipsaw is normal during topping processes as naive buyers buy dips while institutions and their respective traders offload positions.
During this time, it's imperative that you adhere to strict rules and always abide by them. Don't rely on emotions and hope that the market or specific ticker will turn in your favor.
If you find yourself confused or unclear about direction, then sit on the sidelines and be patient until things become clear. No need to trade blindly.
$AMZN #AMZN 8H chart
As mentioned in the last update, if price moved any lower, then overall count needed review/adjustment
The primary now is a completed five-wave structure in place to complete W1 with W2 projected to sweep the $176 level to complete.
Currently, price is near a very heavy support zone (MSB, volume support box, previous breakout zone) so may see a minor bounce before heading lower to complete A (188-191).
$AMZN #AMZN 4H chart
Price reached the minimum target of $216 before correcting for a W4. W4 did go a bit lower than usual but still continues to be valid.
Price needs to break above the $205-207 range in order to trigger a continued move to the upside. W5 of W3 projection would come in at the $222-225 range before another correction.
Correction should not go lower, if it does, then pattern needs to be reviewed for alternate.