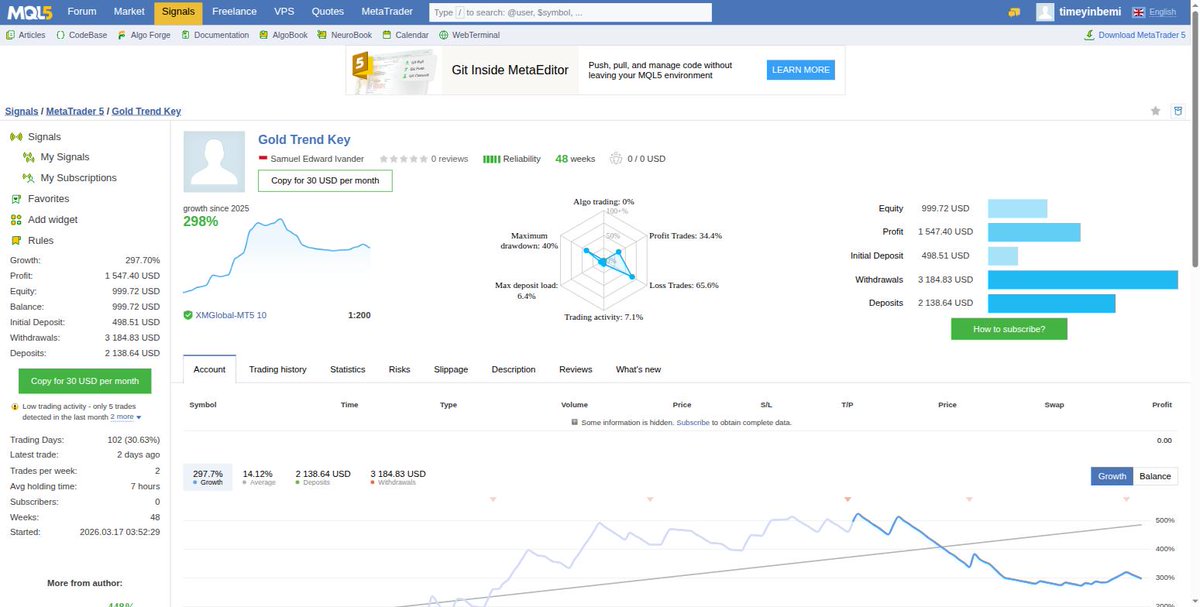
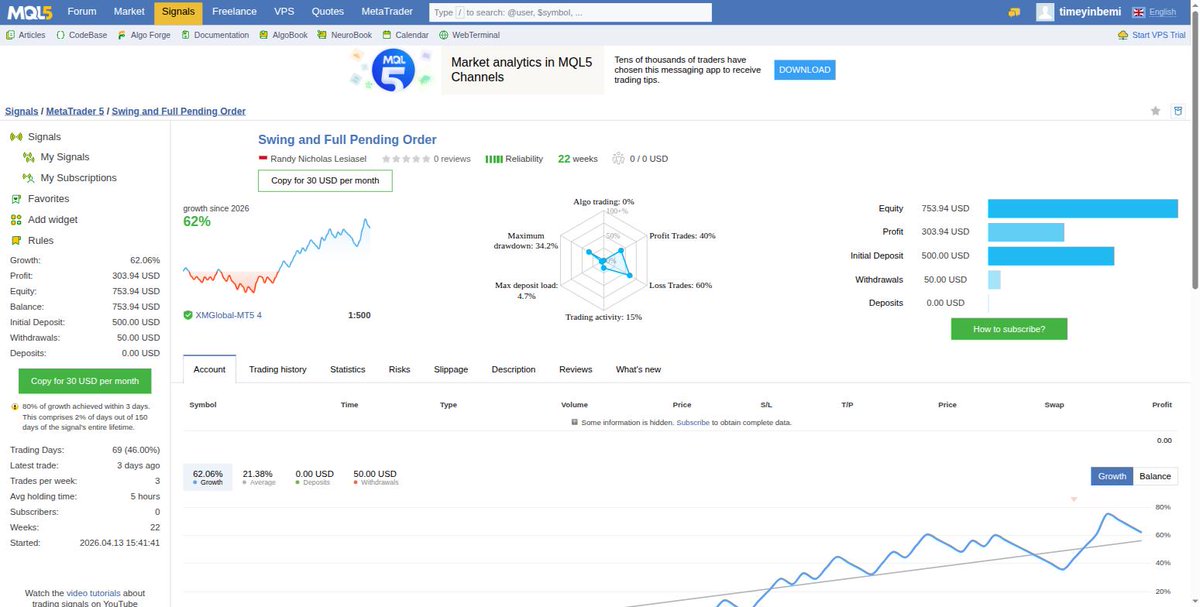
Most "is this strategy legit" questions get answered by eyeballing an equity curve.
That's the weakest possible test. Here's what a real pass/fail check actually looks at, and why growth % is nowhere on the list.
That's the actual pass/fail logic behind a real audit: certified, conditional, or rejected — measured against fixed, published thresholds, not vibes from a chart.
No cherry-picked date range fixes a failed Sharpe ratio.
Found a copy-trading signal with a 90%+ reliability score and a Sharpe ratio near zero.
Found another at 0% reliability with a genuinely positive growth curve.
Two completely different numbers. Most buyers assume they measure the same thing.
Spent this week pulling apart public trading track records — signal marketplaces, prop firm leaderboards, backtests people post.
Growth % is the number everyone leads with. It's also close to the least useful one for judging whether the edge is real.
Thread on what matters 🧵
The 5-minute version, before you trust any track record:
→ Sharpe ratio
→ trade count
→ profit concentration
...before growth % gets anywhere near your decision.iv
Strip that one week out and the whole story changes.
None of this means the seller did anything wrong. Most are transparent, the numbers are public. It's that the one-line summary (growth %, star rating) never surfaces any of it.