Gold and Oil
First, let's state our viewpoint: the main part of the gold bull market has likely already ended.
From a speculative perspective, the hype surrounding a sector usually starts with a leading stock rising, and then spreads throughout the sector. This sector-wide spread is one of the hallmark events of the end of a speculative frenzy.
The speculation in the precious metals sector, starting with gold's continuous rise, eventually spread to silver, platinum, and palladium, with even some long-dormant metals being repeatedly hyped. It has already completed the process of sector-wide spread from early adopters to those who reacted later. There may be rebounds later, but those will only be rebounds.
Furthermore, historically, the ratio of bull to bear market periods for gold is close to 1:1. This current gold bull market, from the end of 2018 to 2026, has already lasted approximately eight years. The time frame has been quite sufficient; what awaits it is likely an 8-10 year bear market.
Oil is a powerful tool to counterbalance gold.
Oil can burst all major bubbles, including those in the stock market and capital markets. Ultimately, if oil prices remain high for a period, the US dollar will enter a rate hike cycle. If the CPI rises sharply, the wave of rate hikes will completely burst all bubbles. Of course, if a financial crisis occurs, gold may experience another surge due to the impact of the easing policy, but that would only be a continuation of the upward trend, not the main body of a major bull market.
When the direction of an issue isn't clear, try simplifying it to get a better look. The precious metals sector has been one of the hottest areas in recent years. People have had their minds filled with a host of "logical truths." Unless you spontaneously recognized the sector's unique potential early on—before the rally began—the ideas currently in your head were likely instilled later by news reports.
To put it simply: if you stripped away the "precious metals" label and looked at the chart pattern alone, would you dare to buy in? Personally, if I saw a chart like that, I’d dismiss it immediately. While the downside might not be drastic, history shows that such patterns often signal a prolonged bear market cycle. This isn't just about a single chart; it applies to the entire sector. Historically, seeing this kind of price action across various sectors has signaled the onset of a bear market. That is a classic tenet of technical analysis.
It pays to be wary of herd mentality. The current craze for precious metals mirrors the frenzy in 2022 when everyone was piling on leverage to buy real estate. Looking back now, nothing lasts forever; it was all just a speculative game. Young people in mainland China often lack practical experience in business and investment. In contrast, children in the West often start selling things early on—Warren Buffett, for instance, began doing business and buying stocks at age six—whereas when I tried selling phone cards at university at eighteen, I was reprimanded by school staff. Students are conditioned to do nothing but rote-memorize "standard answers." Yet, in the real world, there are no standard answers. What is right today might be wrong tomorrow, and vice versa; time and again, the "winners" of the college entrance exams have seen their fortunes wiped out, leaving them penniless. Do you believe the system was designed that way?
The Oil Question
I have long held the view that the situation with oil shouldn't just play out this way; the speculative activity surrounding it has been insufficient. While assets like silver have seen plenty of speculation, oil has lagged behind.
If oil were to enter a major bear market right now, global interest rates would likely embark on a new downward cycle, accompanied by another wave of massive monetary easing. Is that plausible? We have already seen four years of easing; stock markets are awash in liquidity and exhibiting bubble-like characteristics, with IPOs surging. If more liquidity were injected, those stock market bubbles could easily double in size.
Given the prevalence of bubble-prone assets, why would oil be left to enter a bear market without attracting speculative capital? That logic simply doesn't hold up.
The logical scenario is this: bubbles are rampant across various sectors—speculative money has flowed from gold, silver, platinum, and stocks all the way to hard drives and memory modules (with rising memory prices eventually driving up the cost of Apple phones and computers). Once oil prices drop into the bear-market range seen in January, "hot money" will flow into this undervalued area. Oil would then stage another rally, cementing the CPI at a high level and forcing the US dollar into a rate-hike cycle.
Consequently, global assets across the board would collapse into a bear market. That is the logical progression.
Oil prices will continue to hover at high levels—or even consolidate at even higher ones—through the summer. Subsequently, the CPI will break out to the upside. This will force interest rates higher, compelling the stock market to adjust its valuations to reflect the new, elevated rate environment.
The entire precious metals sector—gold, silver, and platinum alike—has broken downward from its consolidation range; simply put, the bullish momentum is gone. Do not fight the market; the trend is king. Cutting losses upon a technical breakdown is standard practice for traders. Do not try to guess the bottom or the top.
Whenever the economic cycle reaches a point where oil prices surge, it is generally a time for caution; nothing good ever comes of it. Historically, many years marked by skyrocketing oil prices have also been years of financial crises.
Warren Buffett wields such immense influence that a great many investors are following his lead—sitting on the sidelines and holding cash. The sheer number of these followers is far greater than what was seen in 1999 or 2007. Consequently, the market cannot reach a true critical turning point until the collective influence of this group has diminished significantly. I find it difficult to articulate this sentiment precisely, but I believe that, in the future, the most prudent course of action for Buffett's successors would be to distribute Berkshire's entire $400 billion cash hoard back to shareholders as dividends. Once those shareholders inevitably squander that capital by haphazardly throwing it into the stock market, the actual volume of cash held on the sidelines will plummet; only then will the market be able to reach its true critical turning point.
@ZeeContrarian1 When a person has too great influence ,it’s not a good thing. The influence will make many people follow him. Then the influence can change the bull and bear ratio.
At the start of 2008, Berkshire Hathaway held $44.329 billion in cash and cash equivalents, while the U.S. M2 money supply stood at approximately $7.23 trillion. Its cash accounted for roughly 0.61% of M2.
In Q1 2026, Berkshire’s combined holdings of cash and short-term Treasury bonds reached $397.383 billion. The U.S. M2 money supply was about $22.686 trillion as of March 2026, with the proportion coming to around 1.75%.
He now holds $400 billion in capital, compared with just over $40 billion back then. You can just imagine the difference in scale.
Back in the day, an opportunity worth $400 billion was already an elephant-sized deal. Now it would take at least a $4 trillion opportunity to count as one. As a result, there are fewer and fewer elephant-sized targets worthy of Berkshire Hathaway’s move, and eventually there will likely be almost none left.
Only when the tide goes out do you discover who's been swimming naked. In every speculative boom, most people end up swimming naked in the end.
China’s real estate rose for more than two decades. It formed a peak consolidation from 2017 to 2023, a span of five years. After that, three years of decline trapped almost everyone who bought property after 2017. Even those who bought homes in some regions as early as 2014 are now sitting on losses. Very few real estate tycoons managed to exit safely. Most ordinary people who got rich overnight from property have ended up right back where they started, with devastating losses. And this was a market that kept rising for over 20 years.
I once asked AI: After the dot-com bubble burst in 2000 and bottomed out in 2002, did it trap everyone who had bought internet stocks in the preceding years? AI said basically anyone who bought index funds from 1996 onward ended up in the red.
Every speculative mania eventually buries an entire generation. Only a tiny minority manage to escape intact. Do you really think this time will be different?
1. Two historical reviews: Time lag between Buffett’s bearish calls and market peaks
- Oct 15, 1998, University of Florida speech: Buffett clearly warned overvalued U.S. stocks, severe tech bubbles and vanishing margin of safety. The market mocked value investing and ignored his warnings. Speculation continued unabated, and the dot-com bubble finally peaked and crashed about **one and a half years later in 2000**.
- 2007: Buffett heavily reduced positions and hoarded massive cash, issuing clear alerts on financial and asset bubbles. The global financial crisis erupted roughly **one year after**.
2. Core difference: Divergent influence and follower capital
- 1998–2007:
Buffett held limited market influence. His bearish views were widely ridiculed by mainstream media and investors, with nearly no copycat capital. His cash holdings truly reflected the market’s natural cash ratio, serving as an authentic contrarian signal.
- Current era:
With record asset scale and global influence, Buffett’s $380 billion cash pile has become a powerful benchmark. It has attracted **tenfold follower capital**, as a huge number of swing investors mimic his defensive, cash-heavy allocation.
3. The critical threshold for market crashes
A severe market collapse typically occurs when the capital structure hits an extreme ratio:
**Stocks : Cash = 99 : 1**
At this stage, investors are fully invested with almost no dry powder, triggering total liquidity exhaustion.
4. Current market structure & conclusion
- In past cycles, Buffett’s cash level aligned with the broad market’s cash ratio, making his bearish signals highly effective and close to critical crash conditions.
- Today, Buffett’s massive cash holdings, plus trillions in follower defensive capital, have artificially lifted the overall market cash ratio.
The real market structure is roughly **89 : 11**, far from the 99:1 crash threshold.
- Core logic: Massive swing and wait-and-see capital remain on the sidelines. The market will only reach a breaking point when this defensive cash is fully deployed into stocks, exhausting all idle liquidity.
The Iceberg Law of Resources
We live in an era of information explosion yet information fragmentation. Social resources are just like an iceberg:
· Above the water (10%): Public, standardized resources — supermarket goods, job postings on recruitment platforms, stock K-line charts, mainstream news, and more. These are hyper-competitive, low-margin red oceans where ordinary people fight endlessly. No amount of hard work will easily lead to class advancement here.
· Beneath the water (90%): Confidential, top-tier core resources — insider information, exclusive medical access, pre-determined projects, limited partnership seats, and other hidden privileges. These are the real hard currency, privately circulated among a tiny elite through blood ties, academic connections, shared interests, and long-term trust.
Blind to the 90% of hidden resources underwater, most people live in a passive "mystery-box world". Job hunters never know if a position is pre-occupied; investors cannot spot hidden traps; patients remain unaware of better treatment options. This universal unawareness is resource segregation — an invisible glass ceiling that cuts ordinary people off from high-value resources, trapping them in aimless competition in the open market.
The ultimate solution is to turn yourself into core value.
Abandon empty socializing and chasing after influential figures. Focus instead on honing professional skills to an elite level. A top-tier doctor gets approached by high-net-worth clients; a renowned lawyer specializing in tough cases attracts high-profile mandates.
Once you become an irreplaceable value node, resources will gravitate toward you naturally. Only when you hold solid bargaining power can you gain entry to exclusive circles.
Buffett’s influence is far greater than it was in 2008. Back then, his follower base was quite small. He now holds $370 billion in cash, and the cash held by his global follower community is roughly ten times that amount. This massive pool of capital stands on the sidelines as market bears, waiting to buy the dip. Once bullish sentiment collapses, Buffett’s collective camp will fully seize global counterparties’ bottom positions. As a result, a prolonged tug-of-war between bulls and bears is inevitable.
In the AI era, if your insights are inferior to AI’s, they are utterly worthless. If your insights surpass AI’s, they become extremely valuable. Before choosing a career path, compare your capabilities with AI first, then make your decision. It is reasonable to abandon early those fields where humans are inevitably no match for AI; otherwise, failure will be inevitable.
Nassim…
I did some historical forecasting on the Hormuz disruptions, between 73-79 (approx)
Previously, only ~6-7% of Oil production was removed from global markets…
This caused atleast a decade of price disruption, which manifested as a global hike in oil prices…
Previous Disruptions:
1973 - ~10–12% of Hormuz exports restricted, 5 months
1979 - ~10–12% of Hormuz exports restricted, 6–12 months
Current:
2026 (now) - ~70-80% of Hormuz exports restricted
The current disruption is roughly 6-7x more severe than either historical episode, the previous two alone caused global economic crises.
The scale now is historically unprecedented.…
And it will take ~6-8 weeks for the full effects to overwhelm the global economy, effects which WILL last many years…
Granted the SPR, and the Saudi pipeline will flex the timeline slightly (this is a given), plus we have the injection of Russian Oil, but this is only a short term bandage (est 4-7 MBPD)….they still can’t make up the shortfall…
They are so screwed if we get past 8-9 weeks…as that will be the same economic impact as the much longer closures of the past…
There WILL be CHAOS !
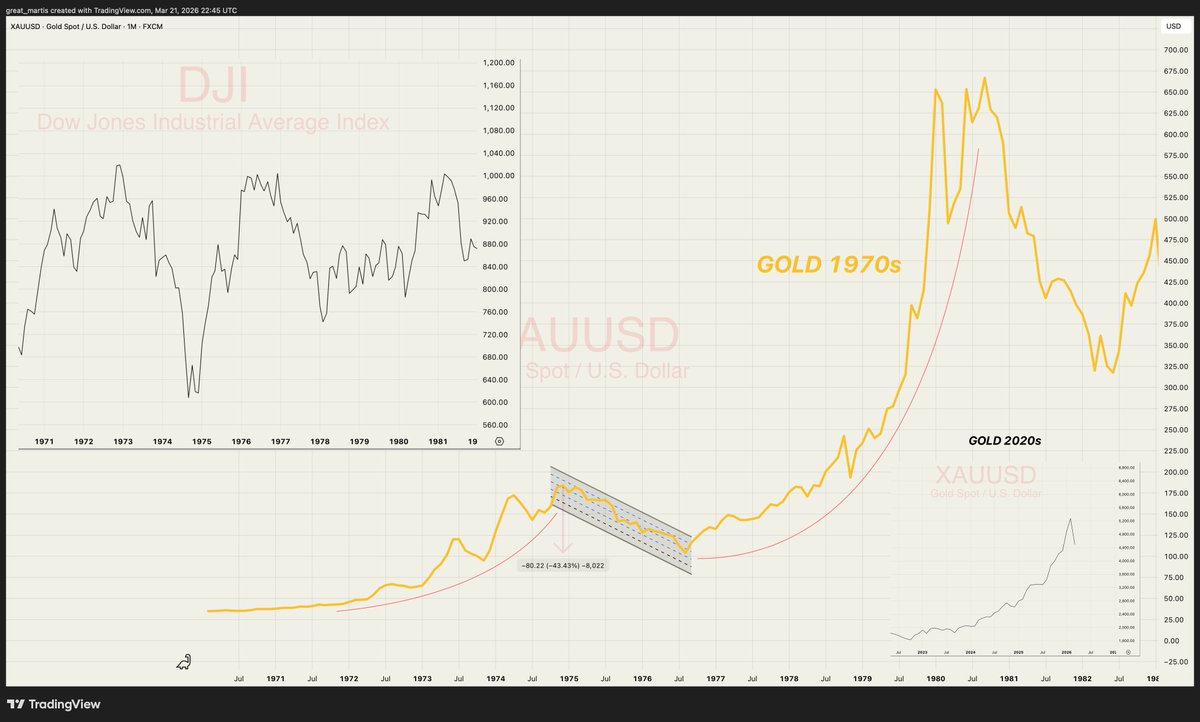
GOLD 1970s vs TODAY.✨
The 1970s gold market unfolded against a backdrop of post-WWII monetary expansion, low rates, and eventual oil shocks that fuelled stagflation, commodity chaos, and wild equity volatility. The Dow Jones endured a lost decade of sideways-to-down performance with repeated 30-50% swings that thrilled traders but tormented long-term investors.
Gold surged dramatically on inflation panic, only to suffer a severe 40-50% drawdown from late 1974 to mid-1976, bottoming near $100/oz. Many declared gold dead at that low...yet it then exploded higher, multiplying roughly 8x to over $800 by 1980 as the next crisis wave hit.
Today’s environment echoes those themes even more closely than before. We’ve seen a multi-decade explosion in money supply driven by relentless central-bank interventions, far larger debt burdens, and yields now stirring from a long slumber in dramatic fashion.
Fresh oil supply risks and widespread commodity disruptions amplify the 1970s parallels, while recent gold strength to multi-year highs has been propelled by persistent inflation fears, geopolitical tension, and uncertainty..classic stagflation signals.
Sharp pullbacks of 8-12% or more in short windows feel familiar, yet a repeat of that deep 40-50% correction seems less likely now because central-bank backstops are vastly stronger and global debt levels are vastly greater.
What looks probable instead is wild equity-market volatility reminiscent of the 1970s, with gold correcting seems temporary even if more downside is seen in the near term.
Over the longer horizon, however, the current moves will likely appear modest compared to what could unfold if the powder keg fully ignites...the upside in gold could dwarf even the remarkable 1970s rally.
Yours truly,
The Great Martis✨
Over? Oil has only just been awakened. The era of oil priced in dollars is coming to an end. Oil priced in gold is still at historic lows. In the future, it will surge suddenly like silver did before, returning to its historical average. The whole world is wrong—using a constantly depreciating paper currency as the benchmark for oil. Gold should be the measure of oil’s value.