AI is changing email marketing. It isn't killing it.
Email still returns about $36 for every $1 spent (Litmus).
But most advice stops at "build a list."
Here is a 7-point audit for an email system people open, trust, and act on - plus where AI actually helps in 2026.
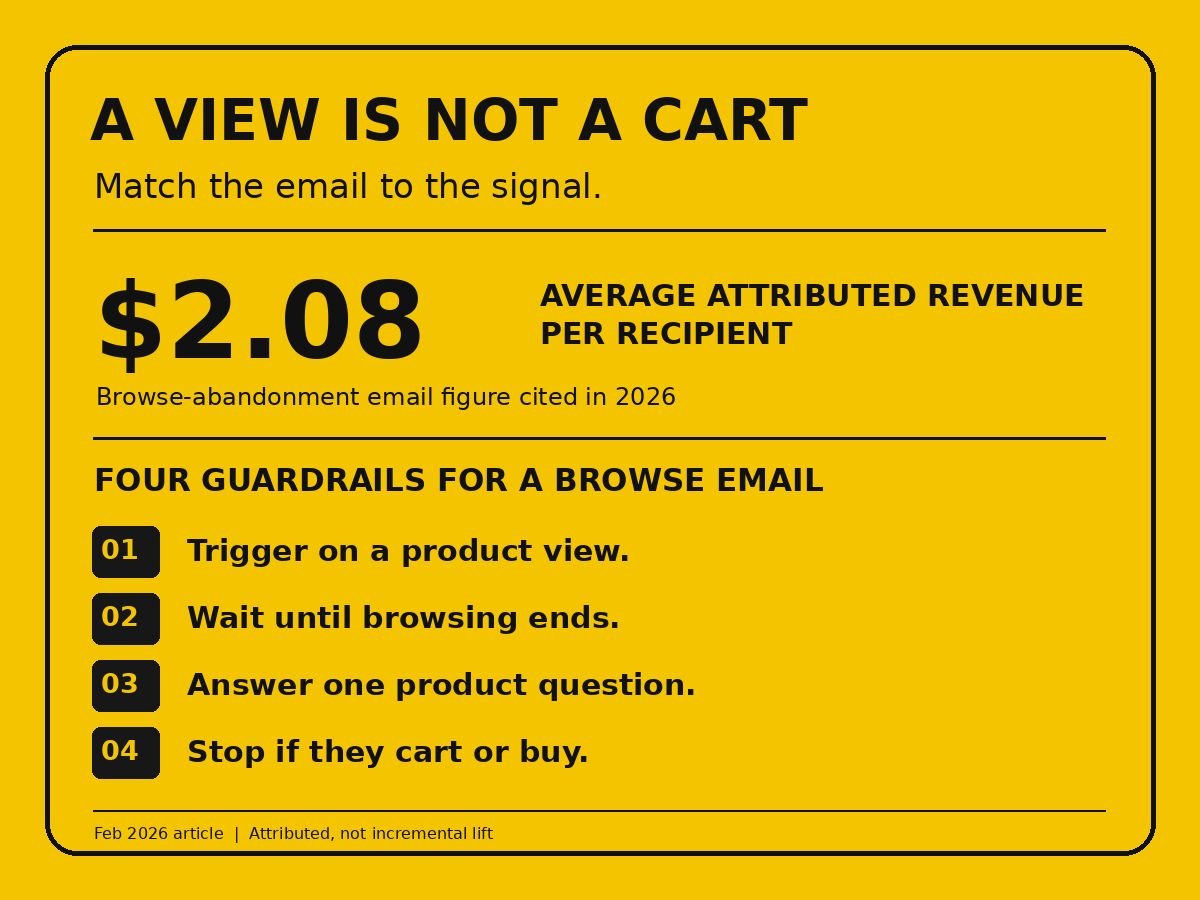
$2.08 in attributed revenue per recipient. A February 2026 ecommerce article cited that average for browse-abandonment emails. It is a platform benchmark, not a promise for your store.
A product-page view is a weaker signal than a cart. Treating both visitors as if they were one click from buying is an easy way to send the wrong email.
Build the browse path around what they actually saw:
1. Trigger from a real product view, not every page visit.
2. Wait long enough for a session to finish. Don't interrupt active browsing.
3. Show the viewed product and answer one likely question: size, use, shipping, or returns.
4. Suppress the email if they added to cart or bought. Let the more relevant journey take over.
Then split revenue per recipient and placed orders by product and traffic source. Compare against an unsent holdout if you want to estimate incremental lift; attributed revenue alone cannot tell you what the email caused.
@scalingmail The refund chance is more interesting than another blanket 10% off. I'd watch contribution margin per recipient alongside orders, then separate entrants from non-entrants. More clicks only matter if the campaign brings in profitable purchases.
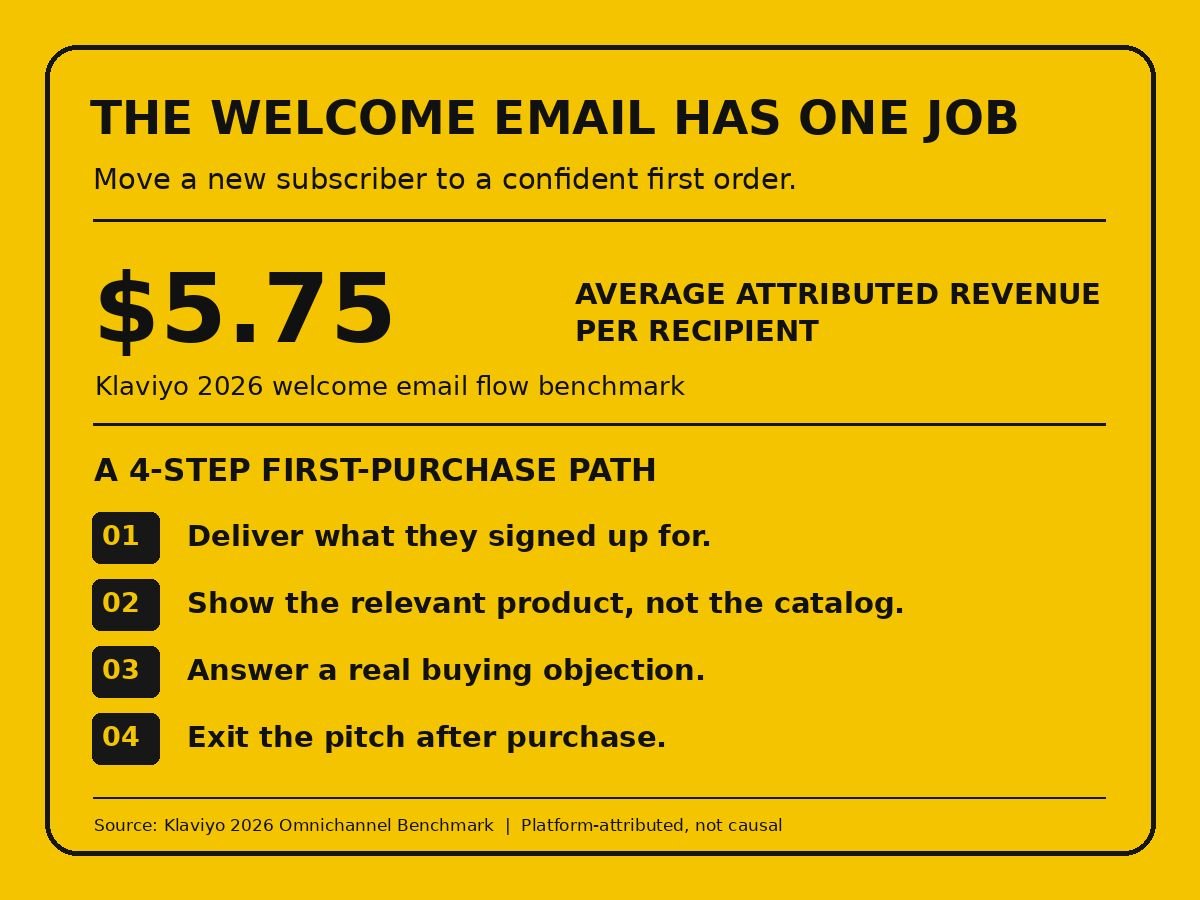
$5.75 in attributed revenue per recipient. That is the average Klaviyo reports for welcome email flows in its 2026 benchmark, not a guarantee for your store.
A new subscriber has already told you something: they were interested enough to give you their address. The first email should not make them hunt for the reason they signed up.
Build the welcome flow around one clear path:
1. Deliver the promised offer, guide, or answer immediately.
2. Show the product that solves the problem they came with, not the whole catalog.
3. Answer one real objection: delivery, fit, returns, or how it works.
4. Stop the first-purchase pitch once they buy. Move them to a post-purchase path.
Measure completed orders and revenue per recipient by signup source and first purchase, not opens alone. Test the first weak step before adding five more emails.
Klaviyo also reports a 6.5% average click rate for welcome email flows. Those are platform benchmarks across its data, not proof that this exact sequence caused the revenue.
@ecommilan I'd judge the test on first-order contribution margin, not conversion rate alone. A bigger discount can win the click but leave less room for paid traffic. Then carry the better offer into the welcome flow before Q4.
It seems like every B2B SaaS company is spending heavily on sponsorships across podcasts, newsletters, YouTube, X, LinkedIn, and IG.
Surprisingly, I've seen very few B2B brands looking at Facebook creators.
The organic reach on Facebook right now with 'comment to get a resource' posts is massive. Simple resource drops can drive hundreds of comments (or more).
I get daily requests for the platforms mentioned above, but I still haven't received a single sponsor request for Facebook.
I've grown my account to 40,000 followers on Facebook and typically get 750,000 to 1 million impressions a month there.
Maybe a hot take, but I'd probably include Facebook in the mix if I were a B2B brand.
@iamshackelford I'd split the first-to-second query by each product's natural reorder window. A 45-day gap means something different for a consumable than a one-off purchase; the same win-back timing can misfire.
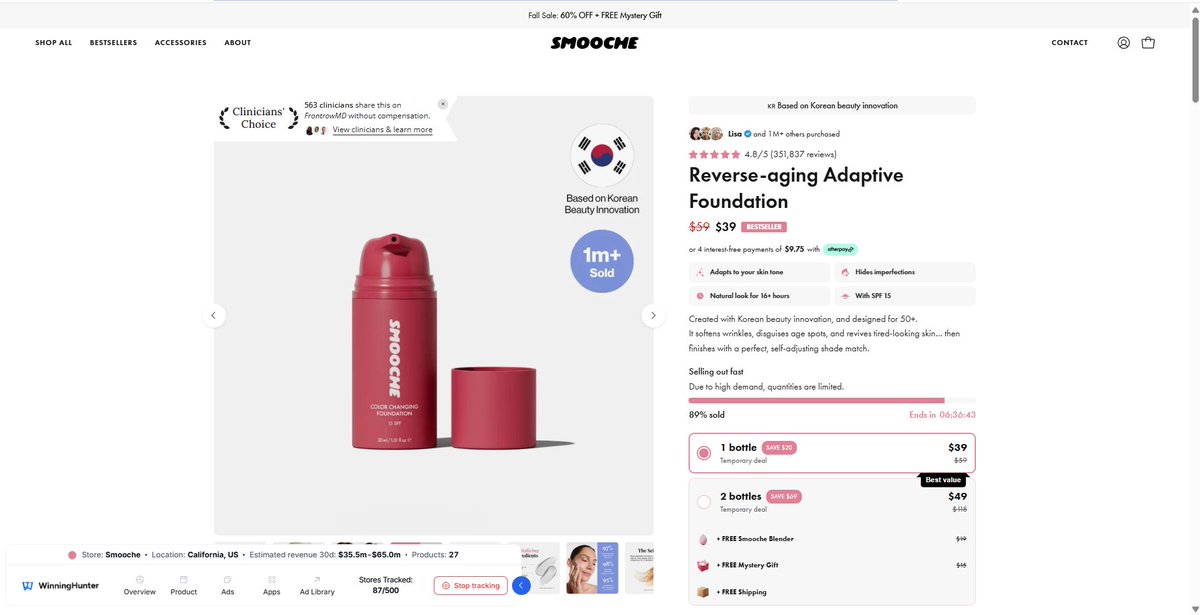
Filtering the same brand by US and UK ads inside @winninghunt surfaced two landing pages for the same foundation
One leads with the product mechanism:
Color-changing foundation that adapts to your skin tone
The other leads with a specific customer:
Reverse-aging foundation designed for women over 50
Same product
Same $39 price
Same core visuals and bundle structure
Different reason to buy
But this reveals an important distinction
The country filter shows where the ads are being distributed
It does not automatically mean the buying experience has been localized for that country
Both pages still use USD and largely the same purchase mechanics
The bigger change is the positioning:
- Broad shade-matching versus a defined age group
- Blemishes and redness versus wrinkles and age spots
- Product novelty versus a demographic-specific outcome
- General benefits versus more explicit proof points
When I compare results across countries, I separate four things:
- Where the ad is running
- Which creative angle is being used
- How the landing-page promise changes
- Whether the price, shipping, proof and checkout are genuinely localized
If only the headline and benefits change, the brand is segmenting its message
If the offer and buying experience change too, the brand is adapting to the market
A different URL does not automatically mean localization
Sometimes it simply means the same product is being sold through a different argument.
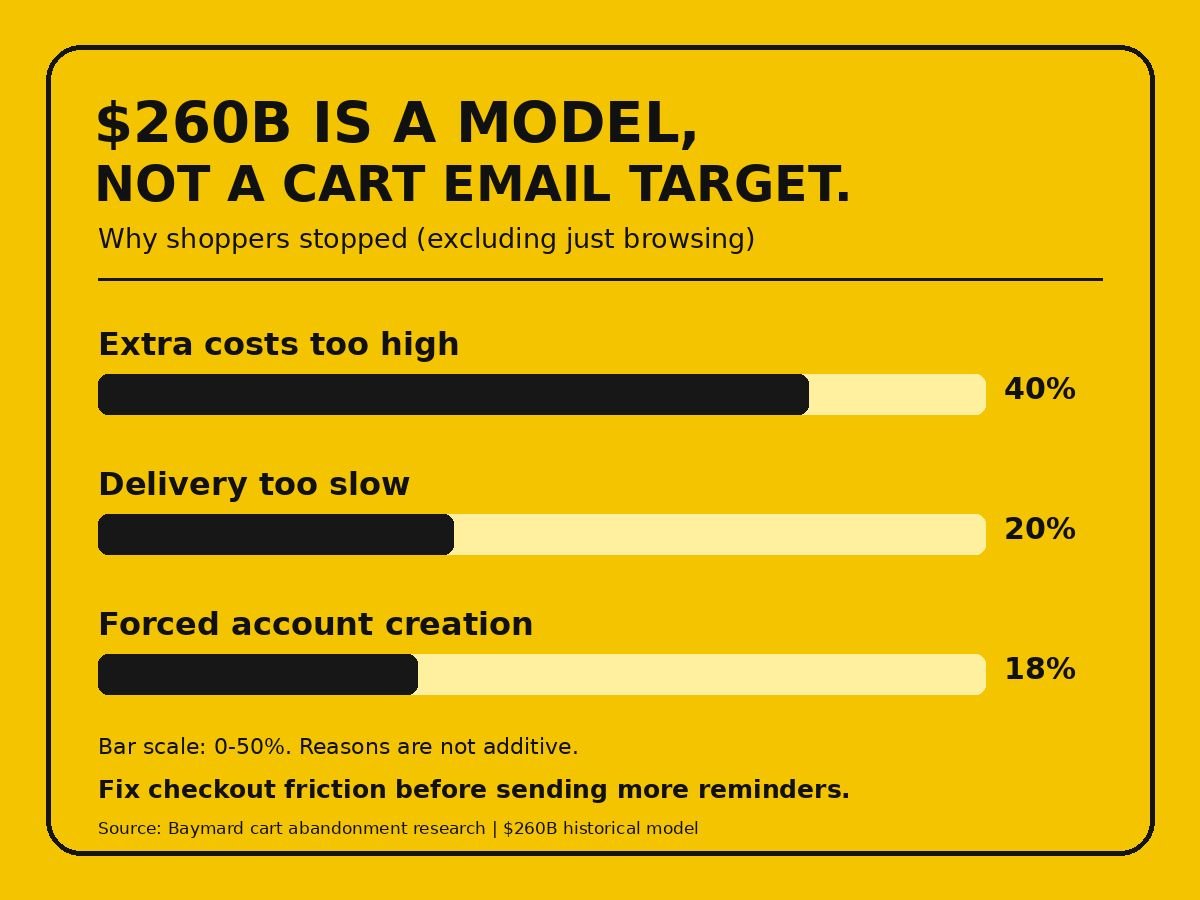
$260 billion is a modeled checkout opportunity, not a number you can recover with one abandoned-cart email.
Checkout usability research estimates that better design could lift conversion by 35.26% at the average large ecommerce site. Applying that estimate to a historical $738 billion US/EU sales base yields $260 billion in potential orders. That is not a current sales forecast or a result for any one store.
The useful distinction: why did the shopper stop?
- Extra costs too high: show shipping, tax and fees before the last step.
- Delivery too slow: make the arrival date clear before asking for payment.
- Forced account creation: offer guest checkout.
Those were three reported reasons after excluding shoppers who were just browsing. A reminder email may bring someone back. It cannot fix a price shock or a broken checkout when they return.
Segment abandonment by the step and reason, fix the friction, then measure completed orders and margin. Don't count a recovered click as a recovered sale.
@markdmei The first-time versus repeat-buyer split is the one I'd test first. New buyers may need shipping and return reassurance; repeat buyers need a reorder cue tied to the product. I'd judge completed orders and margin by cohort, not just opens.
Thought of the day: Ads shouldn’t be responsible for all the results after the click.
Paid media might get someone to the site, but that first visit is rarely the full journey.
Visitors may browse products, subscribe to the email list, compare options, leave, return later, or wait for a stronger incentive to purchase.
That is where email comes in.
An effective welcome flow should communicate the brand’s value. Browse and cart flows should address customer hesitation. Post-purchase flows should encourage repeat purchases.
If these elements are ineffective, paid media must continually invest to regain customer attention.
That is why I don’t think paid media and email should be treated as completely separate channels.
They are part of the same growth system.
The objective is not only to drive traffic but to provide a clear path for visitors to become customers.
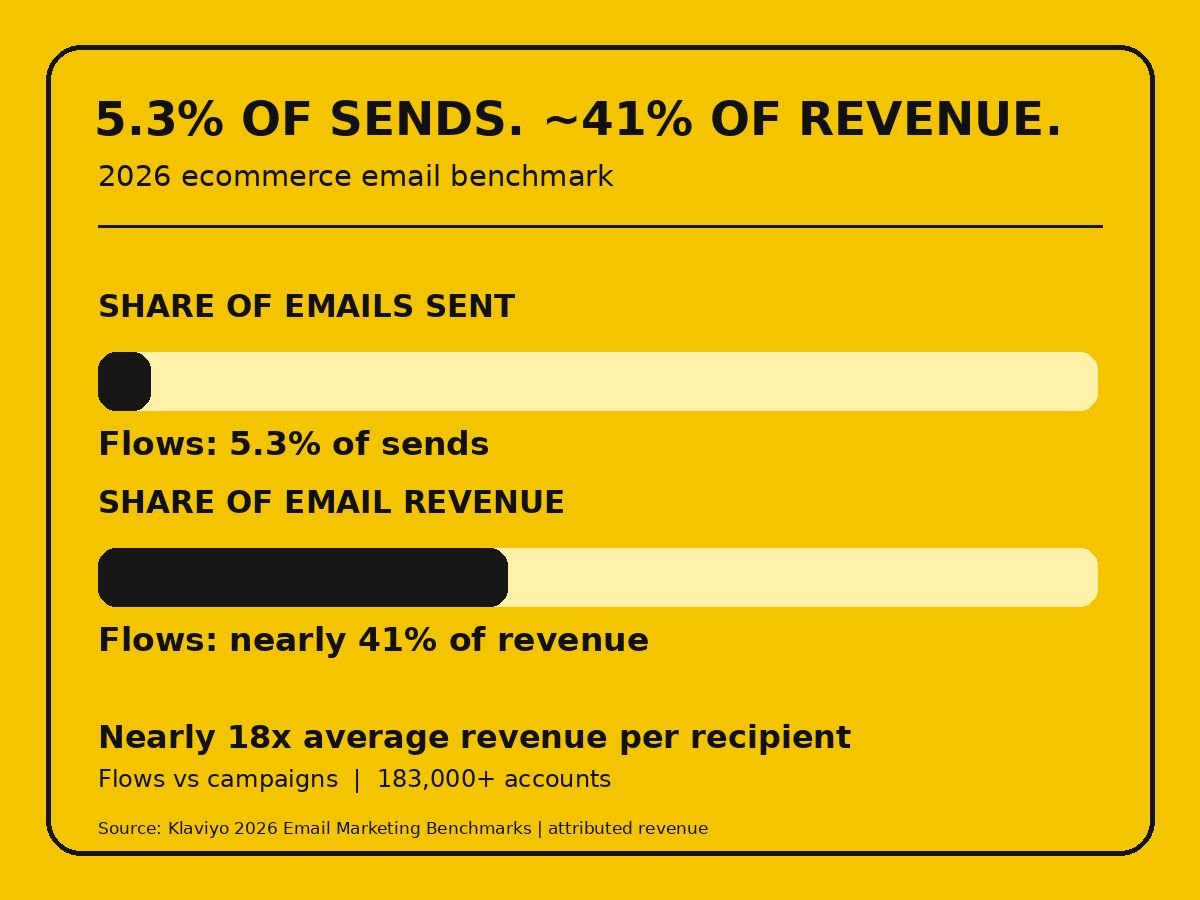
$7.79 per delivered flow email is what the top 10% can reach. It is not the average.
The more useful number: automated flows produced nearly 41% of email revenue from only 5.3% of sends in a 2026 benchmark of 183,000+ customer accounts.
That is a timing problem disguised as a volume problem.
Before adding another campaign, check the messages sent at a decision point:
- New signup: did the welcome email answer the reason they joined?
- Abandoned checkout: did the reminder address the likely objection before offering a discount?
- First purchase: did the next email acknowledge what they bought, rather than restart the welcome pitch?
Measure revenue per delivered email by flow and buyer cohort. Compare it with campaigns, then test one weak trigger at a time.
The benchmark describes attributed revenue across accounts. It does not prove that sending more flows will create the same lift for yours.
@Ferastotle The Q1 full-price reorder is the useful test. Compare BFCM buyers by discount depth, second-purchase rate and contribution margin. A big November total can hide an expensive customer.
Most ecom brands are about to waste Q4 twice.
Once on acquisition. Again on the customers they just bought.
You will spend November inflating the list.
Then send every new buyer the same flows you used in April.
Holiday buyers are not brand buyers yet.
They bought:
• the deal
• the gift
• the urgency
Not you.
If your post-purchase, browse and winback flows don’t change for BFCM cohorts, you rented revenue.
Segment them the day they buy.
Talk to them like they still need to be converted.
@GlennNieuwenh I like the delivery-time trigger, but the support form needs a hard owner and response clock. If low ratings go into a sheet nobody checks, the flow has only delayed the bad experience. I'd measure resolution time alongside public-review rate.
For many eCommerce brands, growth used to feel simpler.
Launch ads. Drive traffic. Measure ROAS. Scale what works.
That model has become much harder to rely on.
Rising customer acquisition cost has changed the way online brands need to think about growth. Paid media is still important, but it can no longer carry the full burden of revenue growth on its own.
The cost of reaching, persuading, and converting new customers has increased, while attribution has become less precise and buyer journeys have become more fragmented.
A customer may first see a Meta ad, search the brand on Google, read reviews, join the email list, browse the website twice, abandon cart, receive a discount reminder, and finally purchase days later.
That purchase did not come from one channel.
It came from a system.
This is why eCommerce brands need to rethink growth across channels.
A high customer acquisition cost is rarely just an ad platform issue. It is often a signal that the brand’s acquisition, retention, creative, website, email, offer, and measurement systems are not working together as efficiently as they should.
The brands that adapt will not simply spend more to win customers. They will build better paths from attention to purchase, and from first purchase to repeat revenue.
$1.69M in welcome-flow revenue sounds like a win. But attributed revenue is not the same as revenue the emails caused.
In a 2026 analysis of 159,229 DTC customers who made a first purchase, 66.4% bought before subscribing or within an hour of signup. Another 8.6% bought 1 hour to 30 days later. The final 25% took 30 days or more.
That doesn't prove the welcome emails had no effect. It tells you the usual revenue dashboard mixes very different buyers.
Before you rewrite your welcome sequence, split the audience:
1. Already bought: send setup help or product-use tips, not another first-order offer.
2. Signed up but didn't buy: make the first message answer the objection that stopped them.
3. Still unconverted after a month: don't keep calling them a "new subscriber." Test a different reason to return.
Then compare first orders in a holdout group, not just revenue credited to the flow. Attribution names the last touch; a holdout gets you closer to impact.
Source: BS&Co, 2026 time-to-first-purchase analysis. The $1.69M is Klaviyo-attributed welcome revenue across its portfolio, not incremental lift.
@IdrisEcom_email The second-order clock is worth watching. I'd segment by the product's real usage cycle, then compare time to second purchase and margin, not just clicks on the reminder. A refill nudge sent too early can look like a push for another sale.
The most expensive mistake you can make is building something nobody wants.
@jasminestar gets her clients to test their offer first, by talking to their audience to find out what result they want and what they’d pay for it.
Watch the full episode here: https://t.co/DkUlfbYeVa
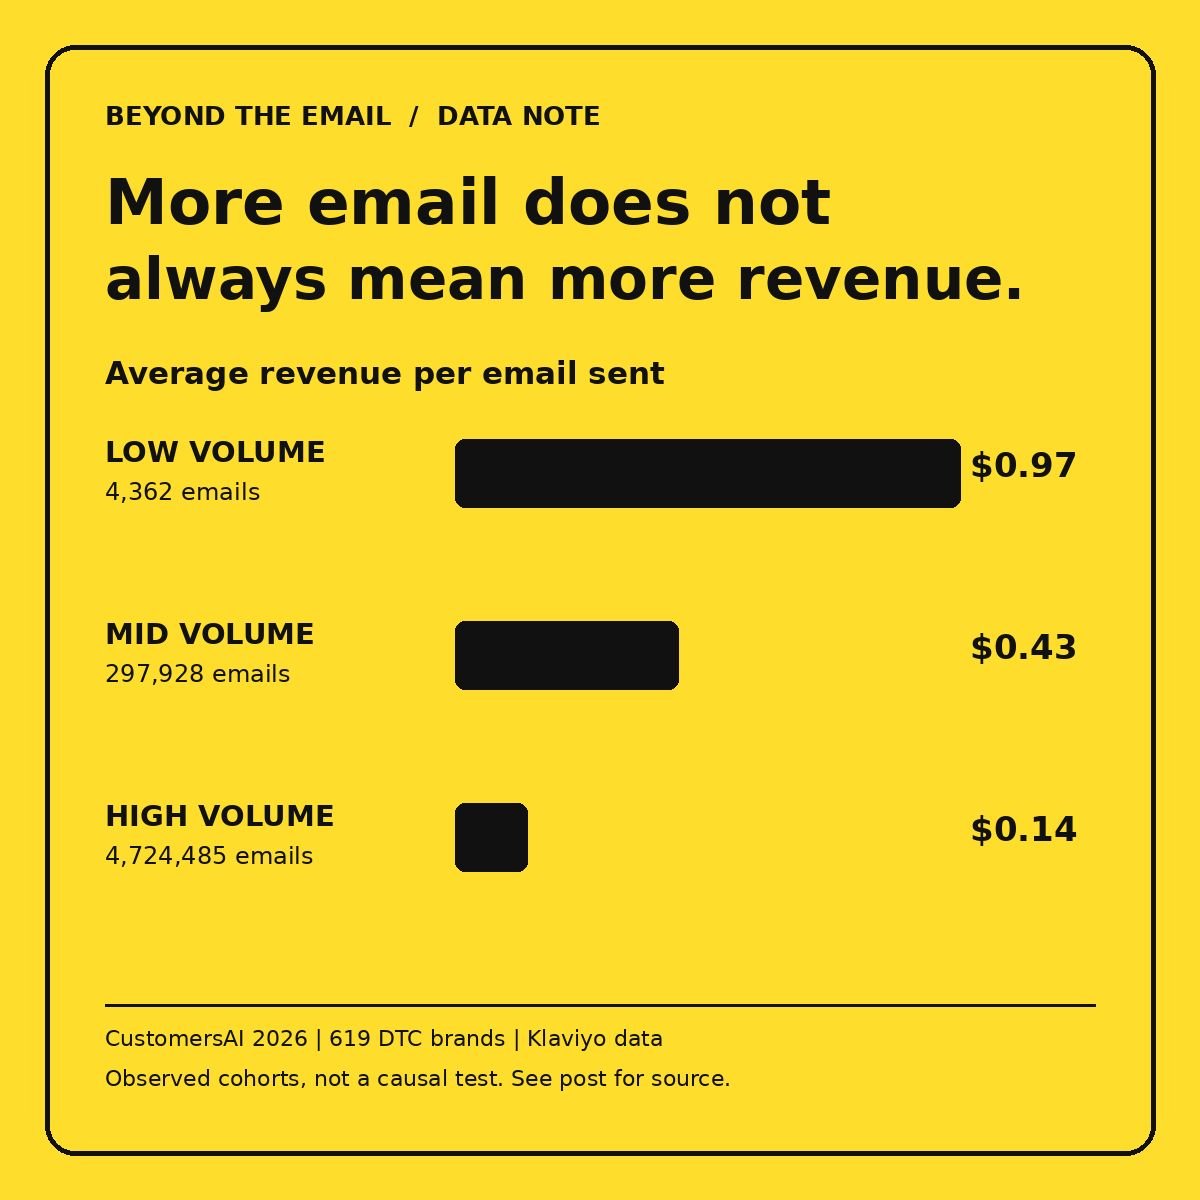
$0.97 per email. That's what the lowest-volume cohort averaged in a 2026 study of 619 DTC brands.
The highest-volume cohort? $0.14.
This isn't proof that sending less causes more sales. But it is a good reason to stop treating send volume as the goal.
Before your next campaign, split the list into 3 groups:
1. Bought or clicked recently: send the offer.
2. Opened but never clicked: change the angle, not just the subject line.
3. Haven't engaged in months: test a smaller reactivation send before mailing everyone again.
Watch revenue per email and clicks by group. Keep the segments that earn their place in the inbox.
Source: CustomersAI, 2026 Ecommerce Email Benchmarks Report (740M emails across 619 Klaviyo accounts). Volume cohorts are observational, not a controlled test.