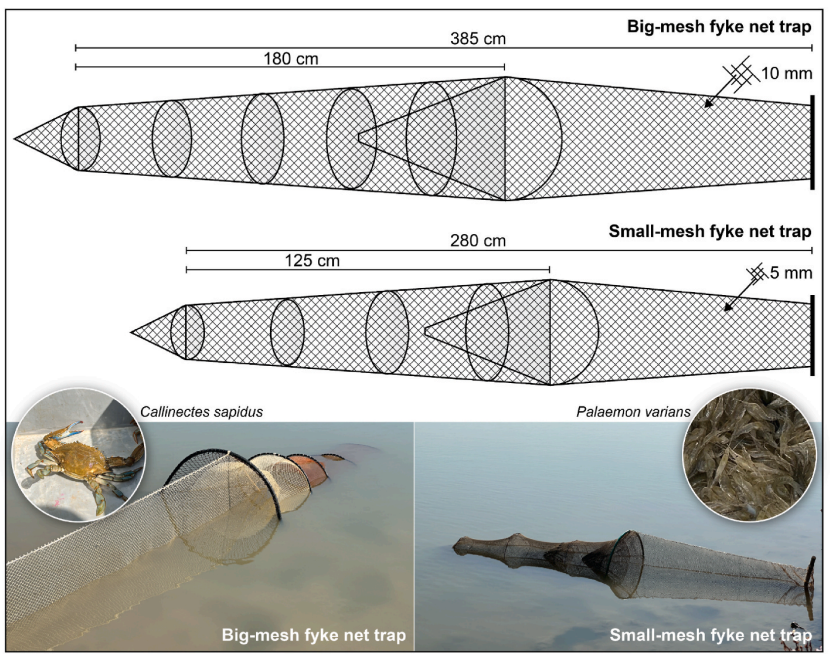
Seasonal lipid and fatty acid profiles of the invasive blue crab Callinectes sapidus and the native ditch shrimp Palaemon varians in the Bay of Cádiz salt marshes
Open Access
https://t.co/wpD9AmSyaR
Dramatic video captured the moment a powerful lightning bolt struck the top of Mecca’s famous clock tower amid turbulent weather and intense lightning activity.
Submissions are now open
Special Issue: Marine Ecosystems Under Multiple Stressors: Climate Change and Other Anthropogenic Pressures https://t.co/mRt4Ddhn2K #mdpiwater via @Water_MDPI
Visualizing complex data can be challenging, but Principal Component Analysis (PCA) offers a powerful solution. By reducing the dimensionality of data sets, PCA not only simplifies the data but also uncovers hidden patterns that can be missed in the maze of high-dimensional data. Let's explore how PCA transforms data visualization:
From Complexity to Clarity
🔹 What It Does: PCA reduces data to two or three principal components, making it possible to visualize complex data sets on a 2D or 3D plot.
🔹 Why It's Helpful: It allows us to see the big picture, revealing relationships, clusters, and variances in data that were not apparent before.
Highlighting the Essentials
🔹 How It Works: By focusing on components that account for most of the variance, PCA ensures that the most informative features of the data are highlighted in the visualization.
🔹 Benefits: This makes it easier to identify patterns, trends, and outliers, providing clear insights into the data's structure.
Enhanced Decision Making
🔹 Impact: Visualizations simplified through PCA provide a more intuitive understanding of the data, supporting better, data-driven decision-making.
🔹 Applications: From market research to genomic studies, PCA-enhanced visualizations are invaluable in countless fields.
Embrace the power of PCA for your next data visualization project and turn complex data sets into insightful, easy-to-understand visuals.
Want to master PCA and elevate your data visualization skills using the R programming language? I've crafted an extensive course exploring both the theoretical aspects of PCA and its practical use in R programming. More info: https://t.co/DUfoAHuxxD
#programming #Statistics #Data
A new study from an associate scientist at the Marine Biological Laboratory shows that two different cell populations in a skate embryo can give rise to the same repeating structures (or “serial homologs”) in the adult.
Read the full story here: https://t.co/hGaCbsQaI9
I am excited to share my research is now published! 📚
Mangrove Ecosystem Carbon Stocks: Insights from Setiu Lagoon, Malaysia
https://t.co/O5XNZLL89p
@SN and #SNAuthor.
🐟Larval Fish Assemblages in Coastal Waters of Bangladesh: Spatial and Seasonal Dynamics
👉https://t.co/DsGQKF8rtg👈
Keywords: Bay of #Bengal; #estuary; #fish larvae; #biodiversity; spatiotemporal distribution
#Conservation_OA
🧐This study investigates the diversity, abundance, and distribution of larval fishes at four sites (Bakkhali River Estuary, Moheshkhalipara, Naf River Estuary, and Rezu Khal Estuary) on the southeastern coast of Bangladesh.
Excited to share my research highlights for 2025! Check out this personalised summary of my Springer Nature publications and the impact of my research in 2025. https://t.co/8xe1b9mQ2Y #SNAuthors#YiR2025
What exists up to 11,000 meters below the surface? And why should we care?
It’s the deep seabed - one of Earth’s last great frontiers - and full of mysterious life. 🦑🪸
Here are 5 things you need to know - and how to protect it 👇
New study! 🦀
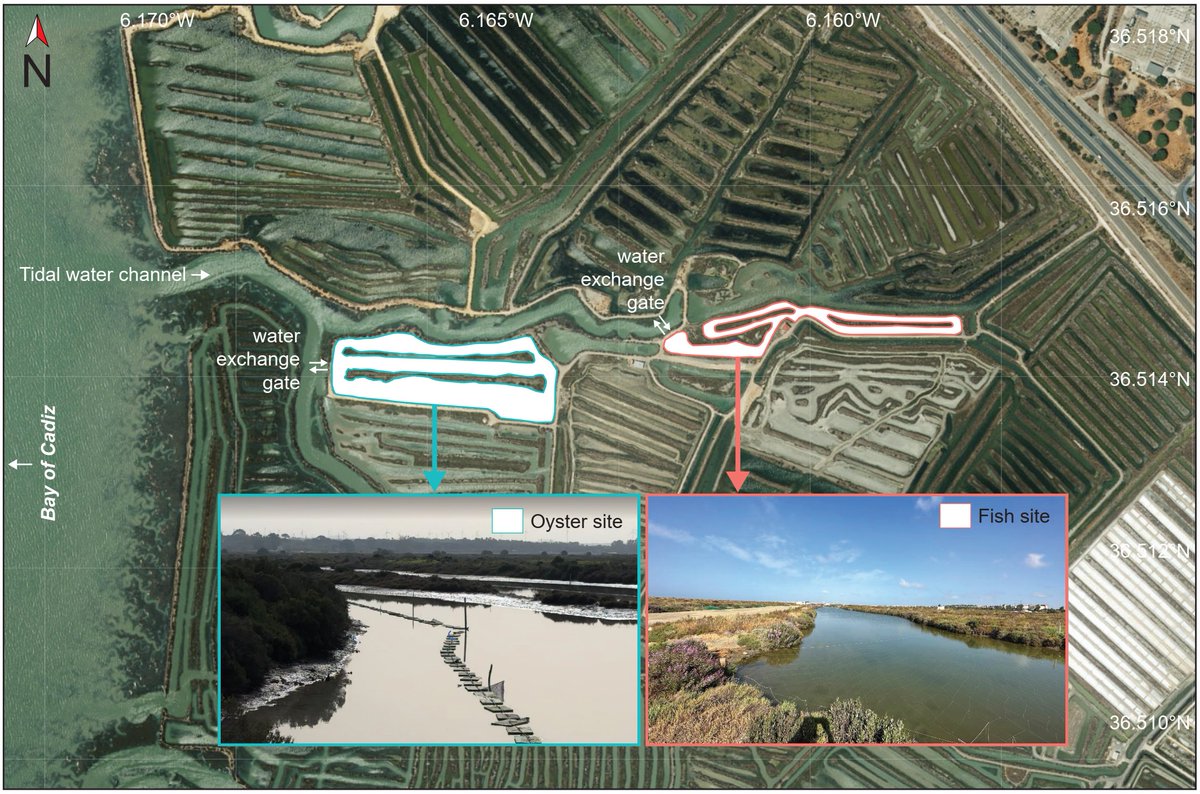
Our research in the Bay of Cádiz salt marshes shows how warming + traditional fish ponds favour invasive Atlantic blue crabs over native green crabs.
We identify key prey links, thermal windows, and propose seasonal management actions.
https://t.co/PqLs6FMQ6M
⚠️ Plastics are pushing threatened species closer to extinction. But just how much plastic does it take to kill ocean animals? The lethal dose is much smaller than you might think…
🔬 Explore our NEW landmark peer-reviewed study: https://t.co/2yAxX1vUMq