You won't believe this map of South America's rivers that I made 🤯. It shows the different sizes of the rivers using HydroSHEDS data. Look at the Amazon river. It's huge! 😍
Watch my video to learn how I did it and some cool tips for your own projects:🔗https://t.co/R9NHxNrPTb
Like, comment, share, and follow me for more awesome content like this! 🙌
#DataScience #dataviz #maps #geospatial #GIS
#TidyTuesday | Week 1 | Bring your own data (BYOD)
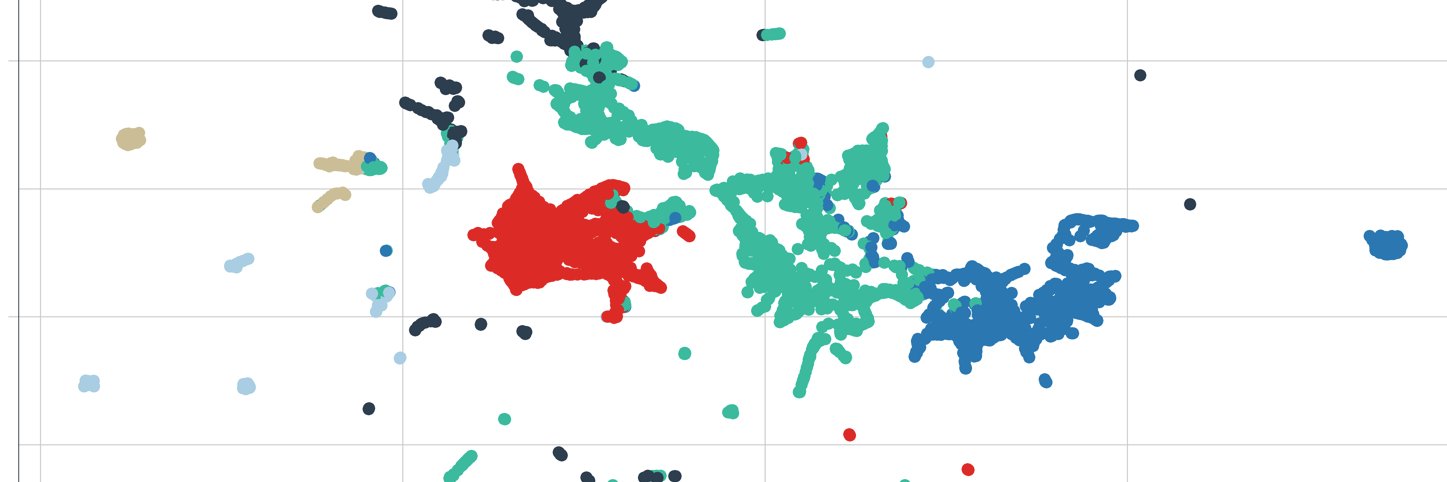
Visualizing my past running 🏃♂️data using Strava's API and the GitHub (dark mode) code contribution chart for design inspiration.
code: https://t.co/IJmZsESIQm
#rstats#dataviz
It was really fun to create a customer service chatbot with #OpenAI and #Python. Here's the first in-depth setup article on the steps and I am excited to for the next one - Fine tuning it with actual customer service support query dataset.
Article 1: https://t.co/UgLGoGw9AP
#30DayMapChallenge - That’s a wrap folks. These challenges are so helpful to learn new things and most importantly to find that amazing community of support and growth.
@observablehq collection of all plots: https://t.co/fGb0o7RJmT
#30DayMapChallenge | #Day30 | Favorite
Finally did it! 3D population density map. I've wanted to do this for a very long time, but as a non-programmer, it was a difficult task. Thanks to @milos_agathon for your tutorials; they helped a lot.
#RStat#QGIS#3D#Maharashtra
Hey #Azure#DataFactory fans!! Just dropped another new #MicrosoftFabric video. Looking to learn ADF & Synapse concepts in Fabric Data Factory? Here is a video I put together to help get you started and it's less than 15 mins long, yay! @AzDataFactory
https://t.co/7d41LYg3iM
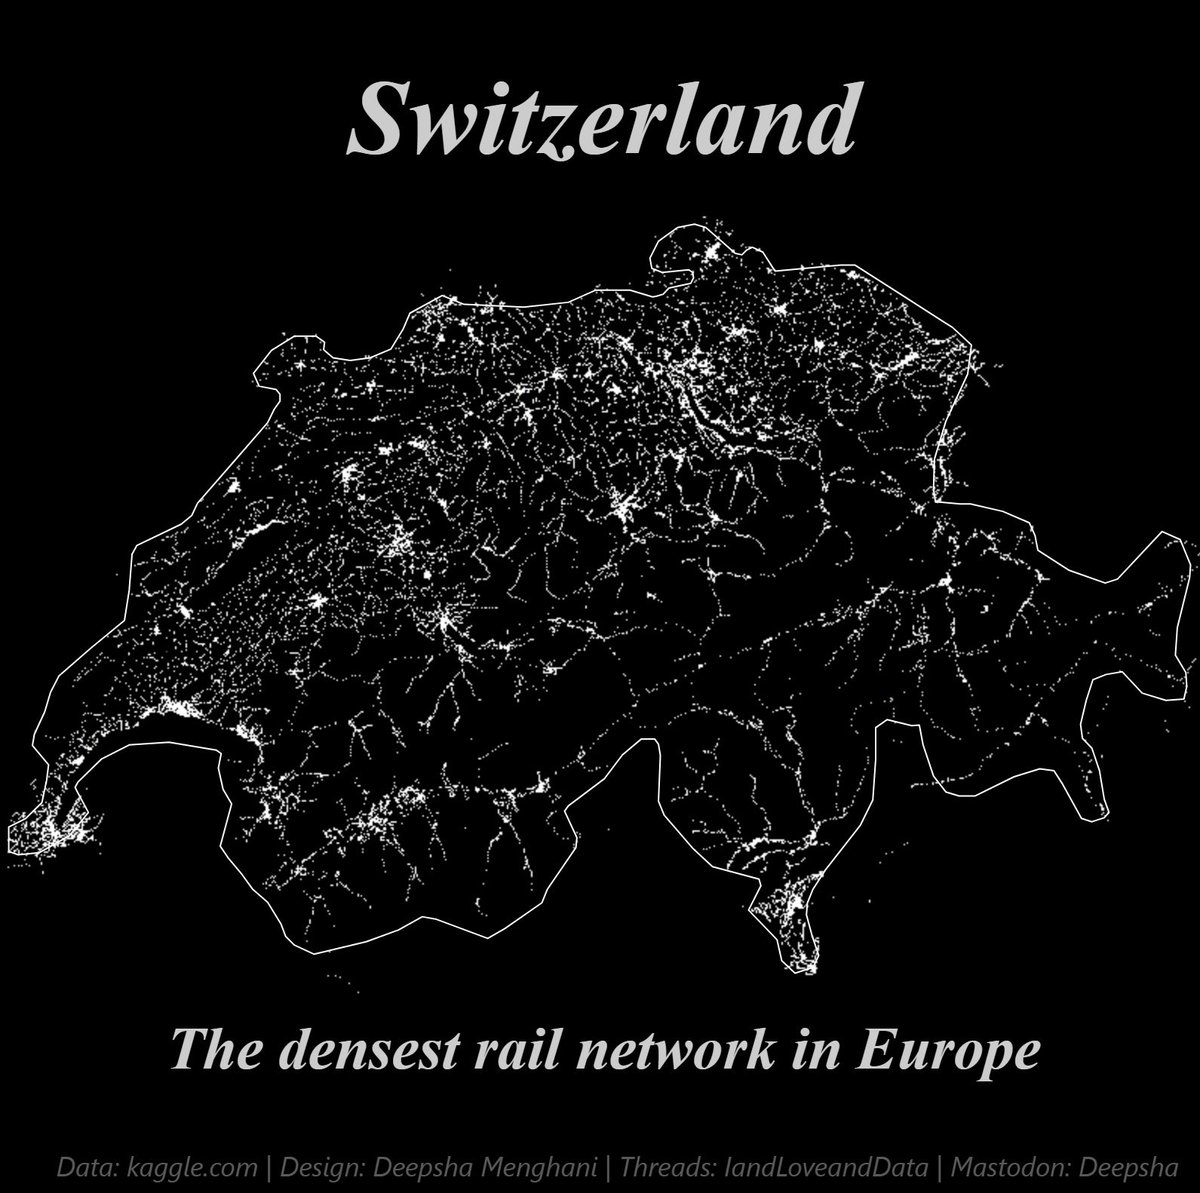
Day 30 - #30DayMapChallenge coming to a close with my favorite… the rail network in Europe, so I plotted the densest one!
@observablehq code: https://t.co/f3cS7bQ0n5