A study checked how often cheap stocks (low price-to-cash flow) beat expensive stocks (high price-to-cash flow) from 1968 to 1990
What they found:
1. 1-Year Periods: Cheap stocks did better in 17 out of 22 years
2. 3-Year Periods: Cheap stocks beat expensive ones in 18 out of 20 periods.
3. 5-Year Periods: Cheap stocks did better every single time.
We focus on finding the most undervalued stocks in the world.
First, we used screeners. That helped us find companies like Huationg Global. The numbers alone were good enough to make us want to dig deeper.
We improved our screeners over time. But once we saw AI's early developments, we went all in on developing Argus (our internal research platform).
The goal of a screener is to maximize return on time. To do that, we must provide the most value per bit of information.
The value of information is proportional to the edge it gives us. Edge is knowledge we have, that prices don't reflect.
But the value of research is the speed at which our understanding gets more causal and complete.
So the next step is using agents to close the loop on all public information. This gives us a large set of evidence to test theses against each other.
A thesis can iterate fastest when it uses the least words possible to completely explain the idea. Each statement must be critical, and iterated both in isolation, and in connection to all other statements.
From 1968 to 1990, 3 professors studied how stocks did based on different price-to-cash flow ratios.
What they did:
-They sorted stocks into 10 groups by price-to-cash flow, from cheapest to most expensive.
-Each year, they made new groups and kept them for 5 years.
Results:
-The most expensive stocks (highest price-to-cash flow) averaged 9.1% per year.
-The cheapest stocks (lowest price-to-cash flow) averaged 20.1% per year.
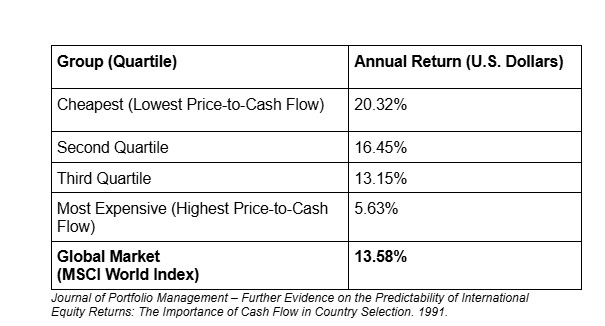
A. Michael Keppler studied low Price to Free Cash Flow stocks in 18 countries over 19 years, from 1970 to 1989:
-Every 3 months, countries were ranked by their price-to-cash flow ratios.
-They were divided into 4 groups, from cheapest to most expensive.
-Performance was then measured for each group.
Results:
-The most expensive group returned 5.63% per year
-The MSCI World Index returned 13.58% per year.
-The cheapest group returned 20.32% per year.
Other Observations:
-Cheap stocks based on cash flow, were usually also cheap based on earnings and book value.
-These stocks often paid high dividends
Over 18 years, from 1962 to 1980, professors David Goodman and John Peavy looked at 2,600 companies each year:
-They compared stocks by P/E ratio within the same industry.
-Each year, they ranked stocks in over 100 industries by P/E ratio.
-Sorted them into 5 groups, from cheapest to most expensive.
-Tracked how much each group earned over those 18 years.
What They Found:
-Expensive stocks (highest P/E) returned 5.42% yearly.
-Cheap stocks (lowest P/E) returned 23.61% yearly.
From to 1962 to 1980:
-$1 million in expensive stocks grew $2.6 million by 1980.
-$1 million in cheap stocks grew to $45.3 million by 1980.
A professor studied how low P/E stocks performed in the UK from 1961 to 1985.
He split the companies into 5 groups, cheapest to most expensive.
What he found:
Over 24 years, the cheapest stocks made 332% more than the most expensive ones, turning £1 million into £50.6 million by 1985.
John R. Chisholm looked at how stocks with different P/E ratios did from 1974 to 1989.
What he did:
-Every year, he ranked companies by P/E ratio, from cheapest to most expensive.
-Divided them into 5 groups.
-Invested equally in each stock and sold them after one year.
-Measured results in U.S. dollars.
Over the 15-year period:
-Low P/E stocks earned more money than High P/E ones in all 4 countries.
3 researchers studied 1,000 large U.S. companies from 1979 to 1995, ranking them by P/E ratios.
What they found:
1979 to 1988:
-Overall group: 18.00% yearly return
-Cheapest stocks: 25.28% yearly return
1989 to 1995:
-Overall group: 16.4% yearly return
-Cheapest stocks: 20.4% yearly return
A 22-Year Study of Cheap vs. Expensive Stocks
3 professors looked at all stocks from 1968 to 1990 (22 years).
What they did:
-Sorted stocks in 10 groups by price-to-earnings ratios.
-Tracked each group's returns for the next 5 years.
-Repeated this process every year from 1968 to 1990.
What they found:
-Cheap stocks made more money than expensive stocks every single year
-After 5 years, cheap stocks made almost 2x as much money as expensive ones
-The difference got bigger the longer you waited
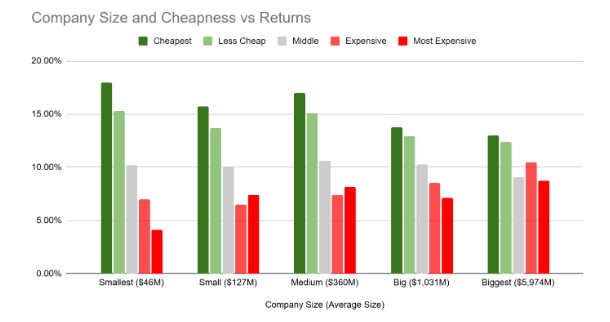
Small, Cheap Companies: A 20-Year Study
Two researchers studied 6000 stocks for 20 years (from 1969 to 1989).
What they did:
1. First, they sorted companies by size
2. Then they sorted by price compared to earnings.
3. They tracked how each group performed over the next year.
Results:
$1 million in small, expensive companies grew to $2.3 million.
$1 million in big, cheap companies grew to $12.3 million.
$1 million in small, cheap companies grew to almost $30 million.
17 Year Study on Small vs. Big Companies
A researcher looked at cheap companies at different sizes from 1963 to 1980.
What he did:
1. He looked at all stocks on the New York Stock Exchange
2. He sorted them by cheapness – (cheapest to most expensive compared to earnings)
3. Then he sorted them by size (small companies to big companies)
4. He watched how they did year after year.
Results:
-$1 million in the biggest, most expensive companies grew to $3.5 million
-$1 million in the biggest, cheapest companies, grew to $8.1 million
-$1 million in the smallest, cheapest companies, grew to $19.5 million
The smaller and cheaper, the better.
Benjamin Graham was Warren Buffett’s teacher at Columbia University.
One test he had for finding investments was:
1. Look for companies where earnings compared to price were 2x as good as the safest bonds.
2. Make sure the company didn't have too much debt.
3. Sell the stock either:
- After two years, or - When it went up 50%.
Whichever came first.
Henry Oppenheimer tested if Benjamin Graham's test worked. He looked at stocks from 1974 to 1980.
In this period:
-The market averaged 14% per year.
-Graham’s Formula averaged over 38% per year.
Cheap Stocks Based on Earnings (Low Price-to-Earnings Ratios)
A professor studied how cheap stocks (low price-to-earnings ratios, or P/E) did compared to expensive stocks (high P/E) from 1957 to 1971. He looked at ≈ 500 stocks each year from the New York Stock Exchange (NYSE).
What he did:
-Grouped stocks by P/E ratios – Highest to Lowest
-Made equal investments in each stock
-Sold each stock after one year
In 14 years:
-$1 million in high P/E stocks grew to $3.47 million.
-$1 million in low P/E stocks grew to $8.28 million.
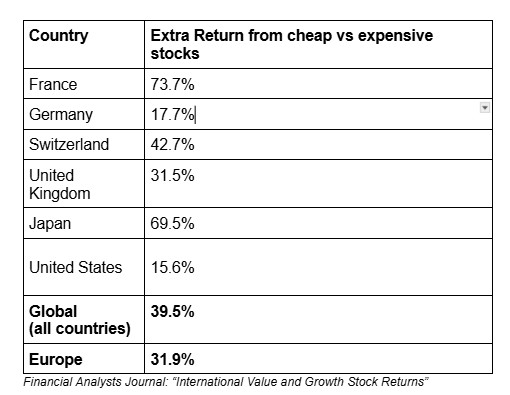
3 researchers compared cheap stocks to expensive stocks in 6 countries: USA, UK, France, Germany, Switzerland, and Japan.
What they did:
-Every six months, they sorted stocks by price-to-book value.
-The bottom half went into the "cheap” group.
-The top half went into the "expensive" group.
-They tracked the returns from 1981 to 1992.
What They Found:
-In every country, cheaper stocks did better than expensive stocks
-Cheaper stocks made 39.5% more over those 11.5 years
From 1974 to 1989, John R. Chisholm saw how cheap stocks (low price-to-book value) did in the UK, France, Germany, and Japan.
What he did:
-Each year, he listed companies in each country by how their stock price compared to their book value.
-He split them into 5 groups, cheapest to most expensive.
-He imagined investing the same amount in each stock and selling them all after a year.
-Tracked returns in U.S. dollars.
In all 4 countries, cheap stocks always earned more money than expensive ones over the 15-year period.
Is The Market Efficient?
Knowledge is information with power to cause change.
Efficiency is the overlap between our knowledge and the market’s. Inefficiency is the difference between them.
Edge is inefficiency in our favour.
Its size over time depends on how fast we correct errors relative to the market.