SUPPORTER COLUMN: @Join_OxVox and @AnalyticsOxford have a tactical look at what Gary Rowett has done so far as #oufc head coach
https://t.co/EnPe0G8nKD
Pretty angry about this and I really feel for Des. He’s shown what he can do with a side with quality on the flanks and been sacked after a poor run with no wide options. Gutted.
🏟️ Oxford United Football Club can announce it has submitted a full planning application to Cherwell District Council for its proposed new stadium.
Full details ⤵️
Analytics Toolbox // code and viz now on GitHub: https://t.co/cJ0g78Z6SR. Some example of the viz created also! Will continue to add…happy to help if any queries!
I’m putting together an ‘Analytics Toolbox’ that uses publicly available data to create football viz. Data also available for the EFL. Will hopefully act as a guide/blue print for getting into coding/adding own data. Some examples 👉
NEW POD (YES ANOTHER ONE)
https://t.co/IBKO9r4t9C
https://t.co/acwWiO883u
@tomlegg joined @SBunching to discuss the world's most exciting football continent, Africa.
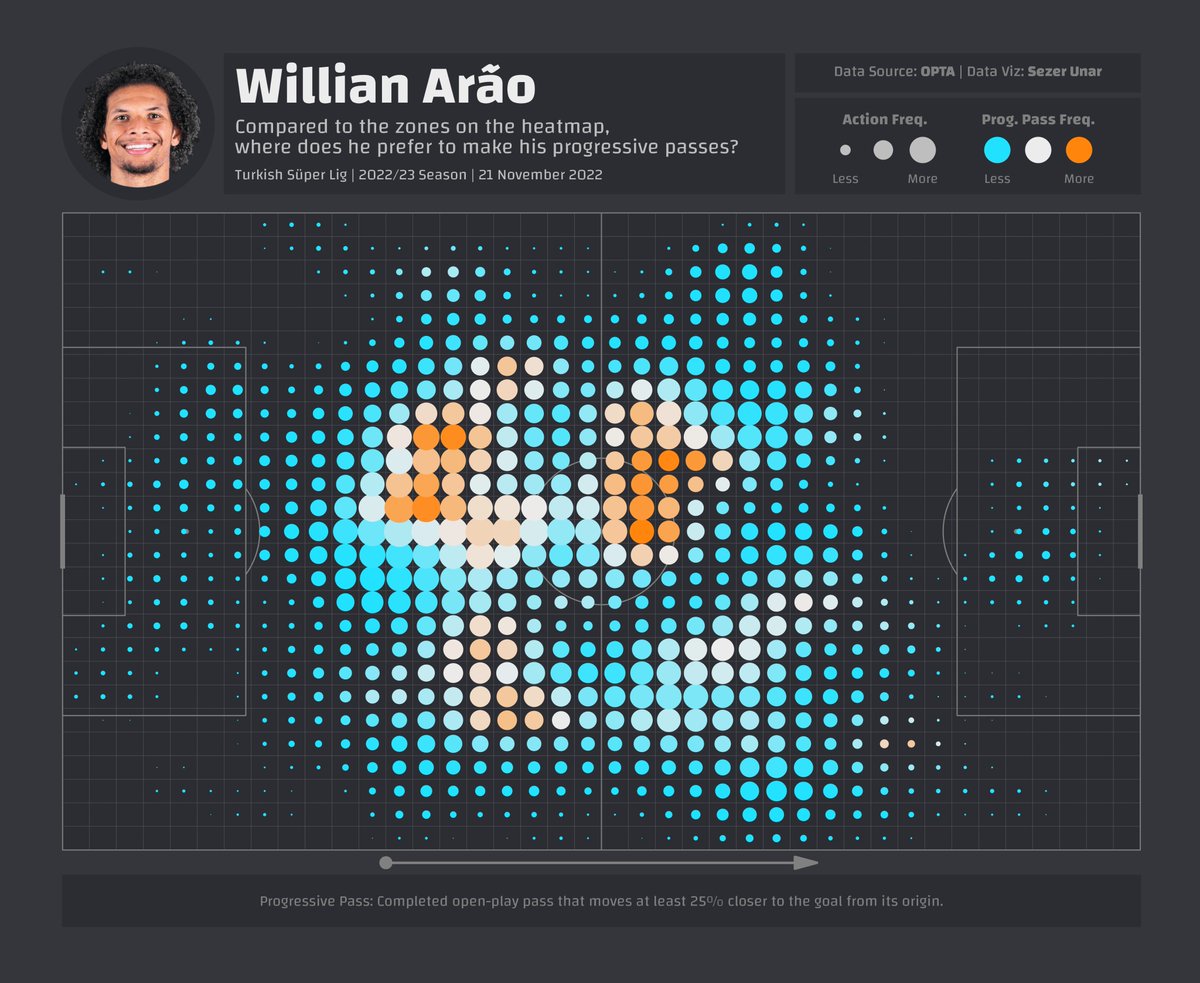
⚽️📊 Experimental viz.
Heat maps are good. They show where and the frequency of a player's events. What if we add a second dimension to this?
We can look at where a player makes his prog passes compared to all actions.
Not necessarily prog pas, maybe turnover locs, key passes...
It creates a quick function to pull the data, save the output to both .csv and sql database. This is then automated to run weekly updating after weekend fixtures. Hopefully useful!
Last year I put together an initial piece creating a SQL database within Rstudio, housing understat shot data for the top 5 European leagues. The above piece builds on that.