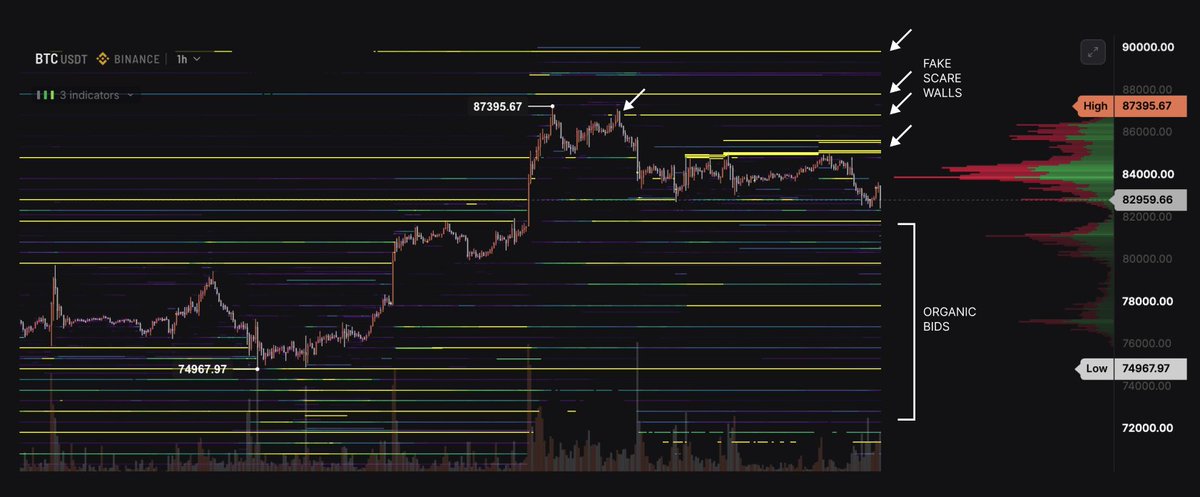
$BTC does have a potential favorable Oct 15-18 for a rebound with Jupiter opposing BTC Neptune
Historical transit data leans bullish
However Friday-Sat Unfavorable Moon in detriment in Capricorn square heavy Saturn, and generally Venus retro makes this tricky to predict
All second intervals and tape mode are now free on OpenMarket.
We're giving you 1s, 5s, 15s and 30s candles on every major crypto exchange, with tape mode on top. Other sources will follow shortly.
Tape mode is the order book and every trade, live, one second at a time. Zoom in and you see every single order in the book.
🚨 THIS POST SHOULD NOT EXIST
In December 2020, a random anonymous post on 4chan predicted every major Bitcoin price move for the next 4 years.
Nobody believed it.
Now people are going back and reading it again.
The post was made on December 18, 2020 at 11:01 PM.
No name, No account, No credentials.
Just a message from "Anonymous" the kind that gets buried under thousands of identical posts every single day.
But this one was different.
" We hold around 90% of total supply now and here's our plan.
We will slowly rise and rise. Then we will boom. Screen cap this."
And then a list of dates and prices.
Most people scrolled past it.
A few screenshotted it and laughed.
Nobody took it seriously.
Then the dates started hitting.
> February 2021 - Bitcoin hit $40,170. Exactly as written.
> July 2021 - pullback to $33,700. Exactly as written.
> November 2021 - $67,930. Exactly as written.
> November 2022 - the infamous collapse. $16,100. Exactly as written.
> March 2024 - the pre-halving breakout to $73,200. Exactly as written.
Six out of six, Every top, Every bottom, Every correction.
Posted three and a half years in advance.
Now there's only one prediction left on that list.
" October 2026, BTC - $145,000."
With a total market cap of $5.7 trillion.
Bitcoin dominance between 40% and 47%.
We're currently in June 2026.
You have four months to decide whether this was coincidence.
$BTC
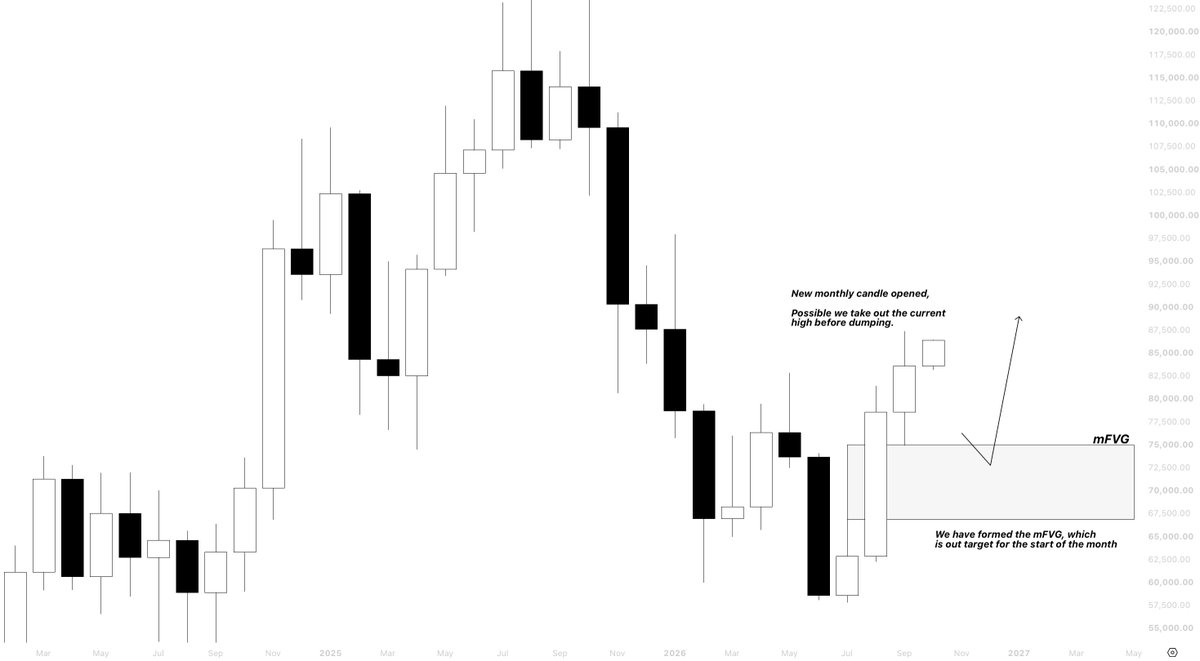
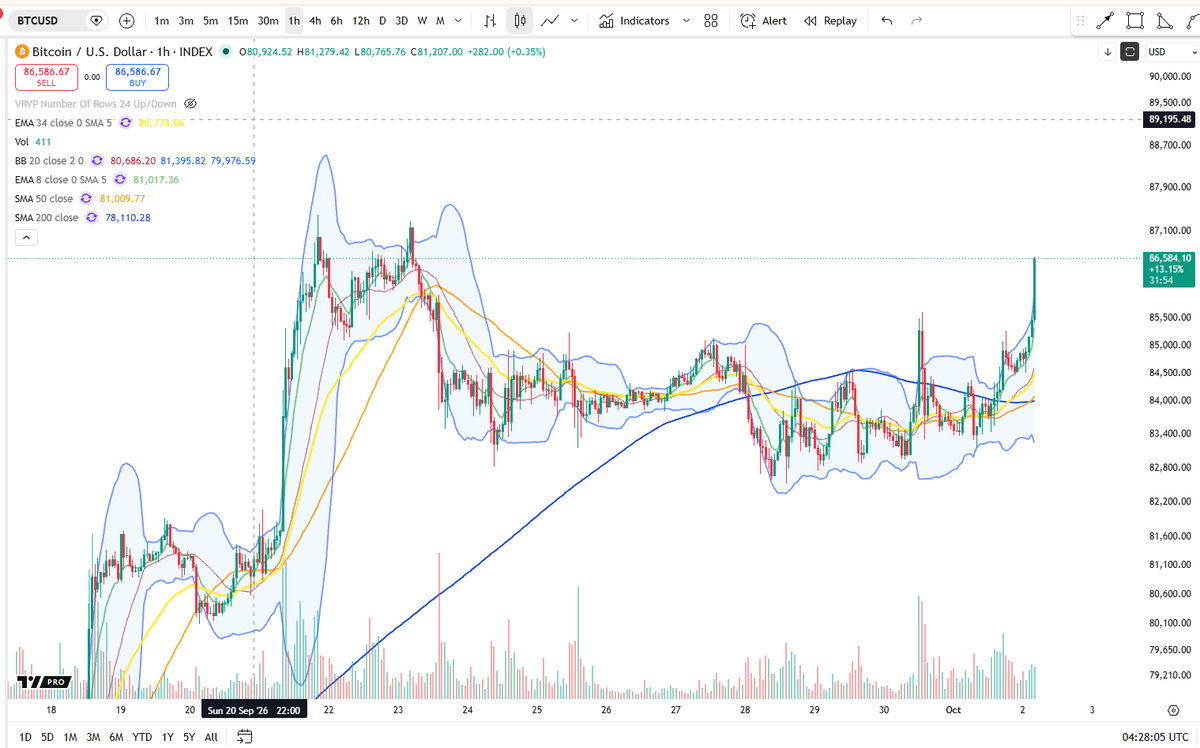
New monthly candle started and we are pumping at the start of the month,
Possible we hunt out early shorts till the current highs (87.4k),
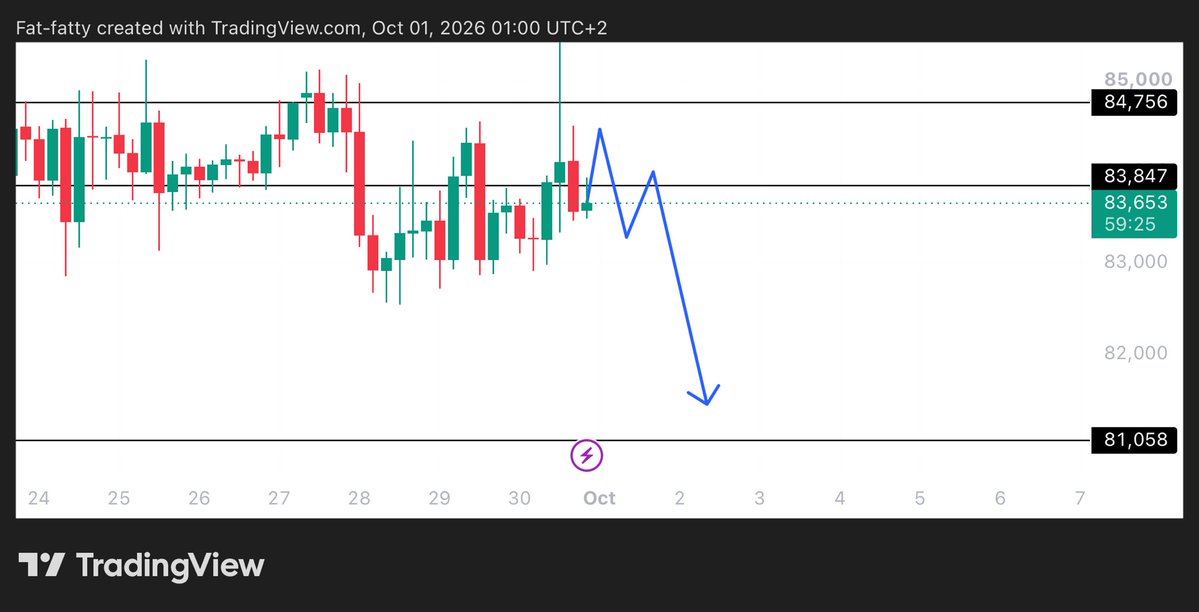
Then dump down to flush the over leveraged longs before starting the next leg up,
We also created mFVG below, which is one of the main confluence that I am taking for the dump.
Overall, I am still biased towards the shorts until price tests 75k one last time,
Which is where I will be looking for max longs for the next leg up to 95-100k.
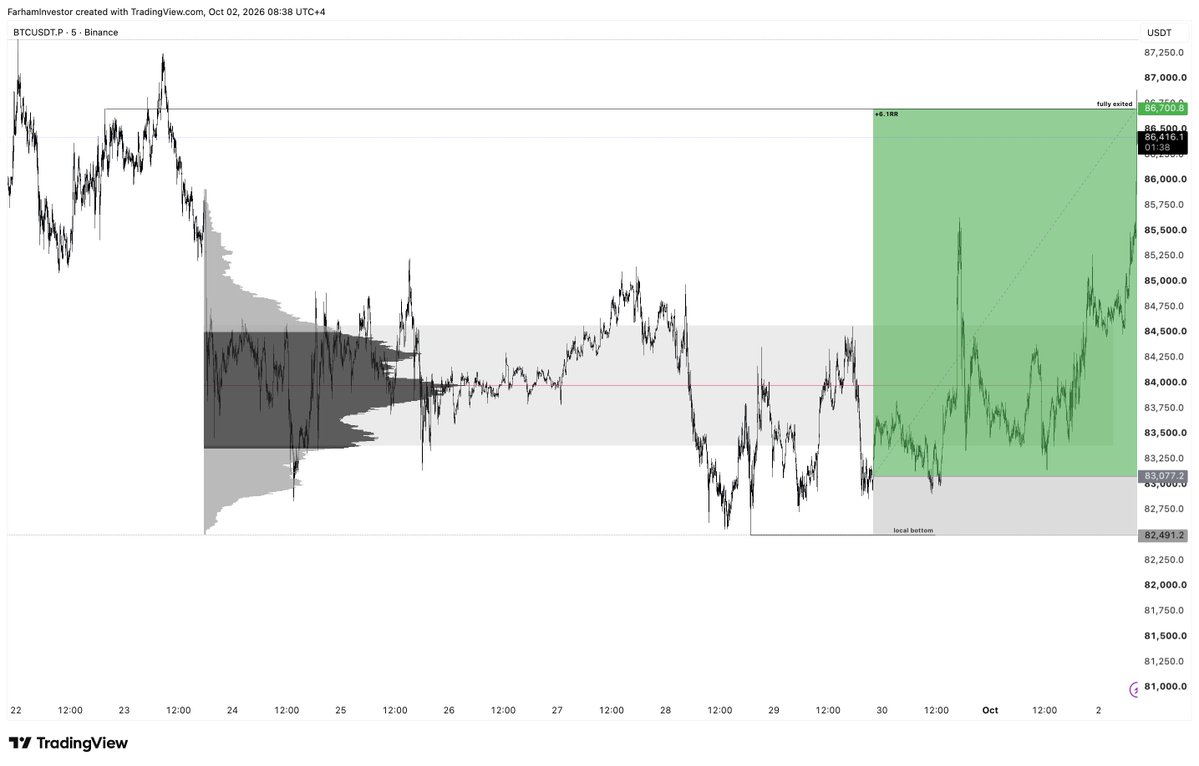
+6.1RR $BTC
Fully exited this trade here, Follow + Rt if you want me to share more live setups like this.
Shared it live beforehand over at X and can join my server for active updates on my trades : https://t.co/QX1fALArfd
This manipulation is crazy.
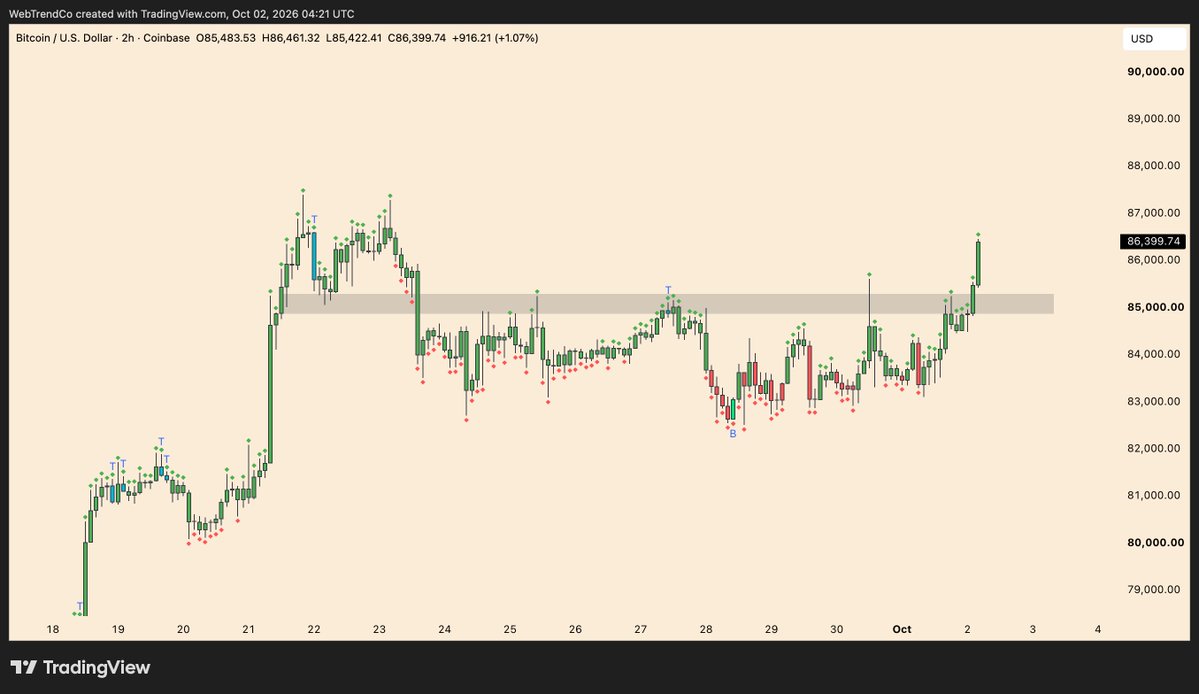
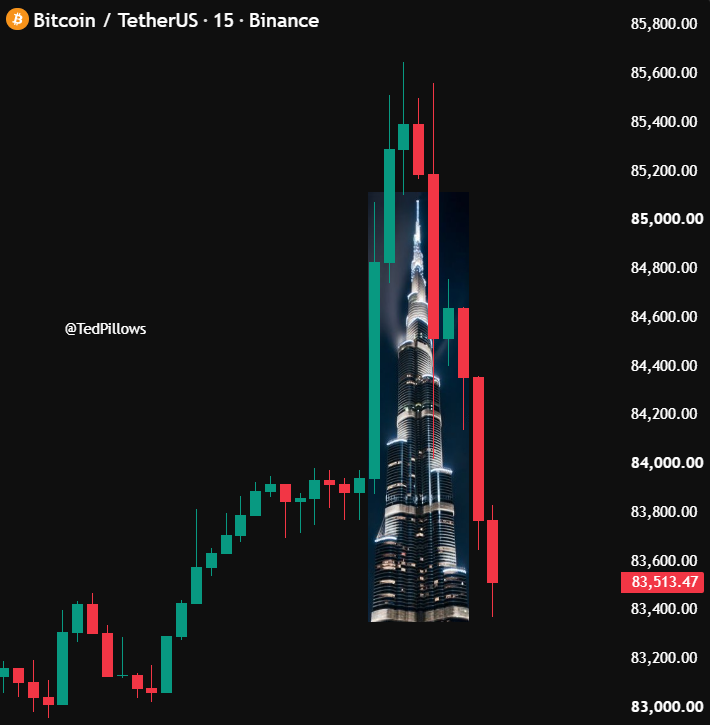
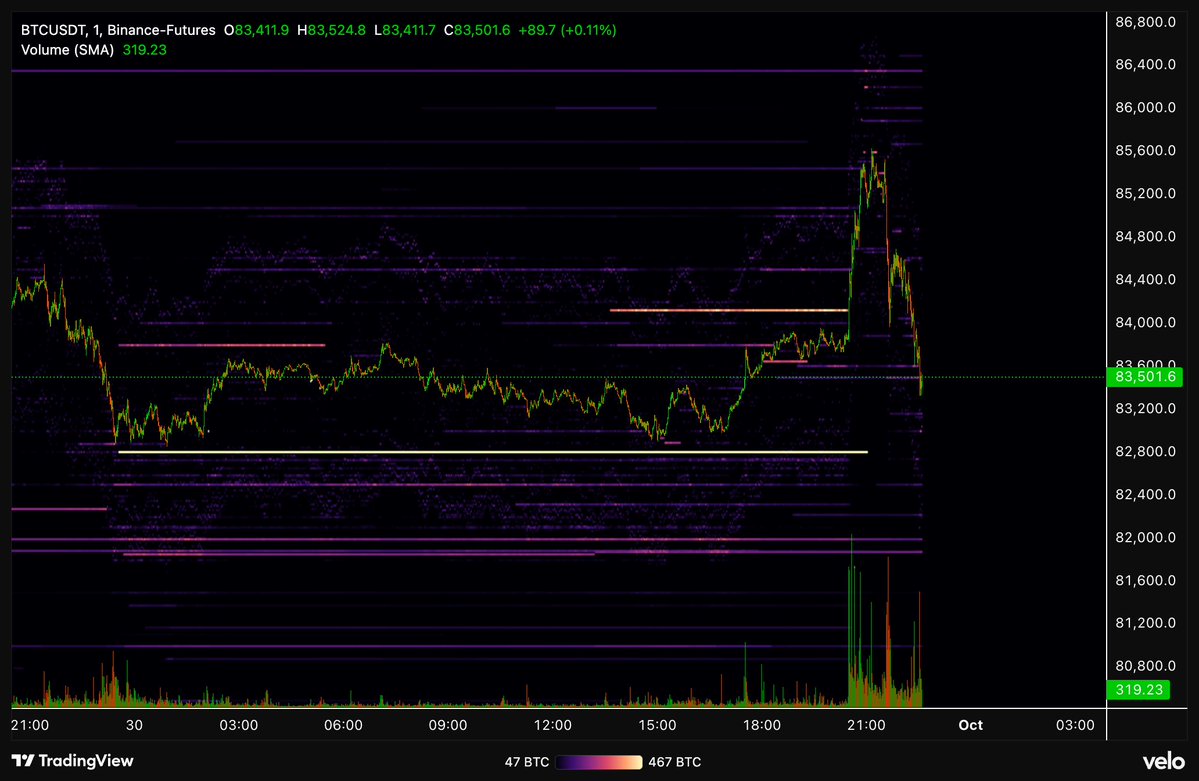
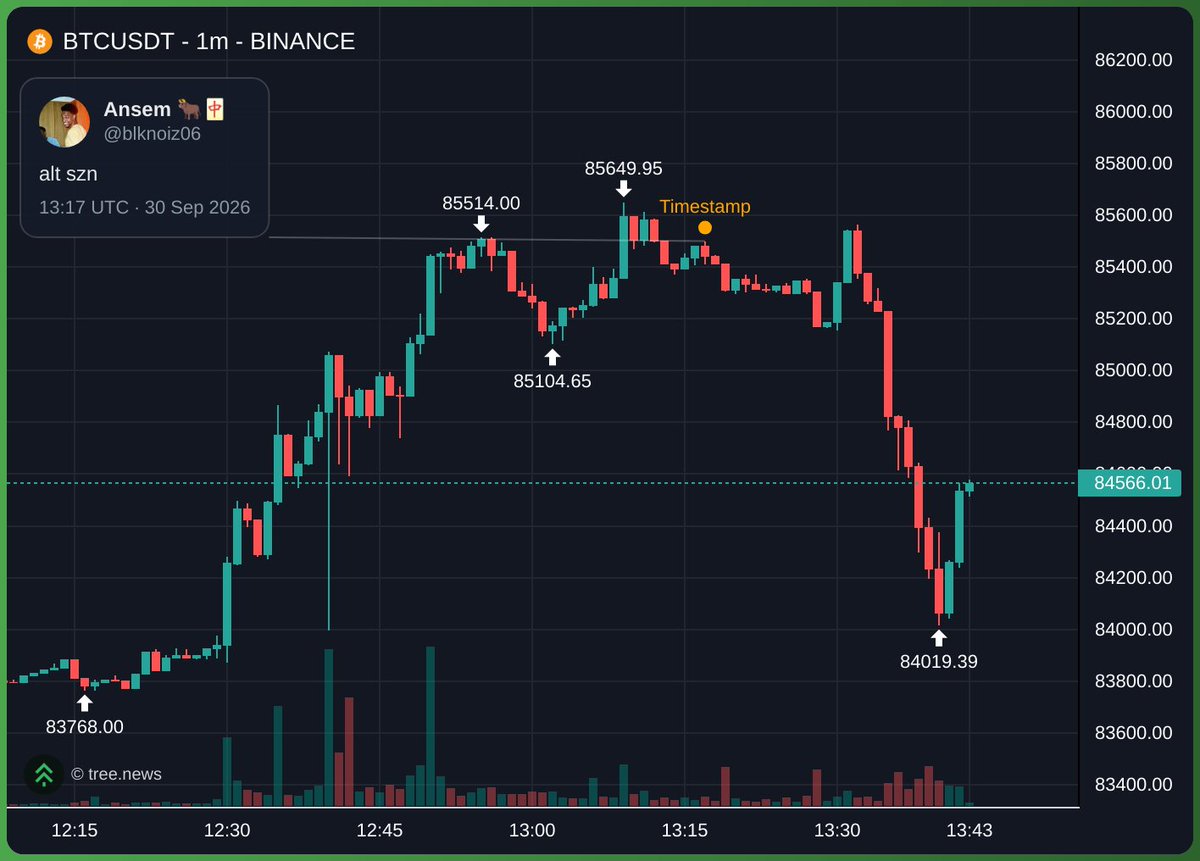
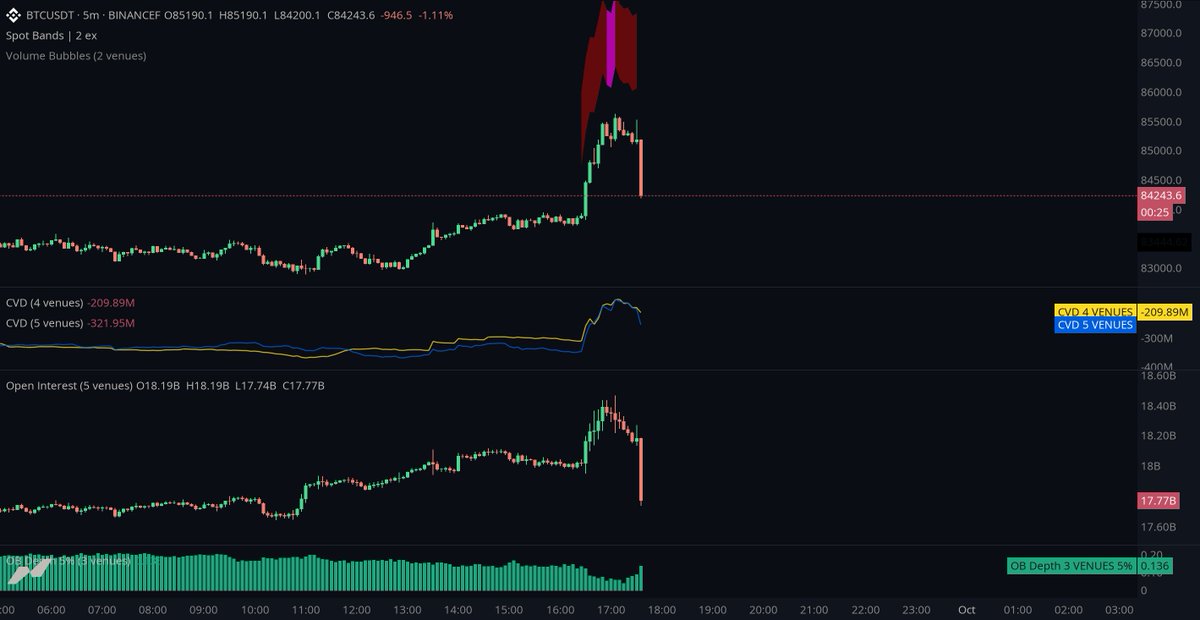
$BTC pumped from $82,900 to $85,600 this morning liquidating $210M shorts!
Then, $BTC immediately dumped back to $83,000 liquidating another $100M!!!
And now, $85,500 - $87,500 above has sizable liquidity that could be swept next.
However, $79,500 - $82,500 below has almost 3x more liquidation clusters stacked up, making this the 'higher probability' zone to visit next.
Bulls and Bears just got wiped out!
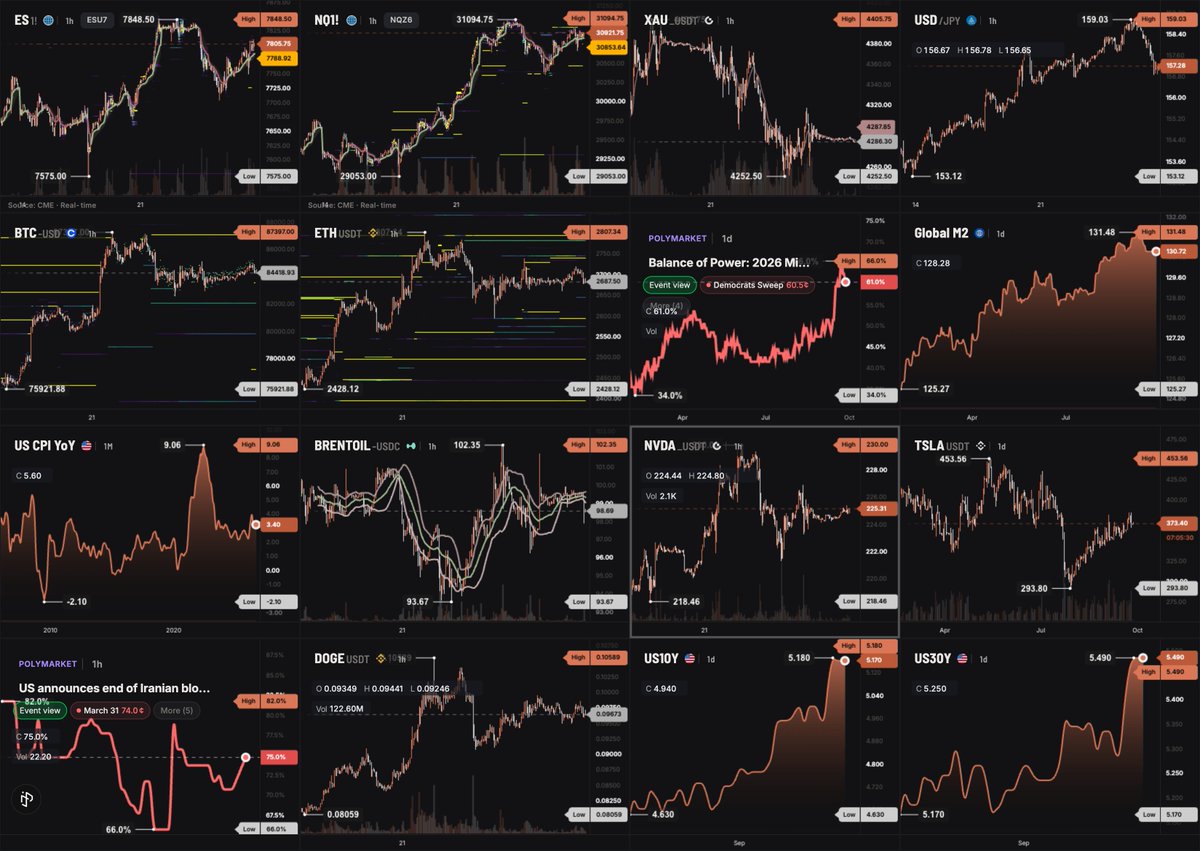
TradingView charges $2,399 a year to plot 16 charts on one screen.
Starting today, you can do the same for free on OpenMarket.
Everyone now gets:
→ up to 16 charts per layout, any grid from 1x1 to 4x4
→ no limit on classic indicators: RSI, MACD, moving averages, Bollinger and more
→ 5,000+ economic series from 200+ countries and 50+ central banks
And beyond candles: footprints from every trade, not estimates, and live order book heatmaps from real depth, on crypto, CME futures and more.
Every market, one terminal:
• US stocks and tokenized stocks
• Crypto
• CME futures
• Forex, commodities, indices
• Prediction markets
• Macro: CPI, GDP, rates, M2 for 200+ countries
https://t.co/U91agdMf58