#Bitcoin – What's Next?
The Big Sunday Report: All We Need to Know
🚩 TA / LCA / Psychological Breakdown:
THE FINAL TRAP: Today I want to speak about the most important development on the chart right now, and it is going to be very interesting. I am watching the MA200 weekly closely, and what we are seeing is what looks like a retest of the MA200 weekly. Hold on, this is exactly the moment where things get dangerous. Let me take you back to 2022 to explain what is loading right now. In 2022, Bitcoin lost the MA200 weekly and everyone believed it was over. Then something happened that trapped everyone. A few weeks later, Bitcoin regained the MA200 weekly, and not only that, BTC printed three weekly closes above it. Bitcoin pumped 10% above the MA200 weekly in 2022, and guess what happened with the narrative? Everyone thought the bottom was in. "Wow, MA200 weekly reclaimed, this is bullish, the bear is over." This is exactly what they said. And so many bought right above the MA200 weekly, believing it was the confirmation they needed. Just to get trapped again. This was the final trap, and this is what led directly to the capitulation event. The reclaim of the MA200 weekly in 2022 was not the bottom signal, it was the trap that preceded the final flush to 15-16k.
Why This Matters Right Now:
Look at where we are today. Bitcoin lost the MA200 weekly. And now BTC is doing exactly what happened in 2022. It is testing the MA200 weekly from below, and there is a very real possibility that we see the same repeat. So in my idea there if we see a weekly close above MA200 Weekly, it will be definitely a trap! And for this case I told two weeks ago at 60k that I am placing short orders at 68-69k in case market allows to visit. This is exactly the setup I have been warning about for the last two weeks when I spoke about the white and blue lines converging and the death cross loading. The MA200 weekly retest is the key ingredient of the final trap, and history is about to repeat with almost perfect timing.
The reason this trap works every single time is because retail cannot resist a reclaim of a major moving average. When Bitcoin closes above the MA200 weekly, every one will be bullish and start FOMO buying. And this is exactly why it works. Market makers need this trap to build the maximum amount of long liquidity before the final flush. Without this trap, the capitulation would not have enough fuel. The final trap is what generates the liquidity for the final flush. This is how bear markets always end, and this is how this one will end too.
Why This Aligns With the CBB
If the 2022 pattern repeats, the final flush after the trap lands us directly at the CBB, the 40-50k zone where the BlackRock ETF launched. My timeline of September-October 2026 for the bottom aligns perfectly with the timing of a MA200 weekly reclaim happening now, followed by a fake bullish move in July-August, followed by the final rejection and capitulation in September-October. Every piece of the puzzle continues to fit. (Visit our website: https://t.co/oP8wCPuO9J) The 2022 playbook, the death cross setup, the aSOPR realized losses, the MA200 weekly trap, and the CBB target all point to the same conclusion.
My Positioning
Both shorts remain fully open. The 120k big short and the 80,500 average are in deep profit. New short orders at 68-69k remain prepared in case the market allows another visit. The plan is for the macro move toward the CBB, but the sideways zone between 57-68k is not over yet. I would not bet on an upside move, but I would bet that if the market allows another visit to 68-69k, I add more into my shorts. I am not interested in adding below this zone. If the MA200 weekly reclaim scenario plays out and BTC pumps 10% above the line, this is the perfect zone for me to add aggressively.
Calendar This Week:
FOMC minutes from the June 16-17 meeting release Wednesday July 8 at 2:00 p.m. This is a major event because it was Warsh's first FOMC as Chair, and the meeting delivered a clear hawkish shift with the median federal funds forecast implying the potential for one rate HIKE before year-end 2026, not a cut. Exactly what I predicted in the June 14 Sunday report when I said the dovish pivot would not be delivered cleanly. The minutes will show how divided the Committee was and how strong the hawkish argument was internally. Any confirmation of the hawkish tone will give us more sell pressure. Initial jobless claims Thursday July 9. Consumer credit data also Wednesday July 8.]
Join Premium: https://t.co/oP8wCPuO9J
THIS IS NO FINANCIAL ADVICE BUT EDUCATIONAL CONTENT ONLY.
WEEKLY BEARISH ENGULFING CANDLE🚨
Nothing screams bearish more than a weekly engulfing candle that swallows the previous green body by a factor of five.
There is a high probability we will see a further 30% drop from current levels.
She's beautiful
🚨 JUST NOTE THIS S&P 500 PLAN:
- May: Euphoria
- June: Rejection
- July: Bull Trap
- August: Capitulation
- September: Bottom Hunt
- October: Reversal
Bookmark this and let's see how it ages
I have perfectly predicted this pump.
S&P 500 is now following a rare Wyckoff pattern.
New all-time high → price retest → massive leg down (next).
For the record, I’ve predicted all the market tops and bottoms for the last 15 years, including the exact Bitcoin bottom at $16,000 three years ago and the top at $126,000 in October.
If you missed those calls, don’t worry. I’ll call the next one too.
Turn notifications on. If you’re not following yet, you’ll understand why that was a mistake later.
#Bitcoin – What’s Next?
The Big Sunday Report: All We Need to Know🚩
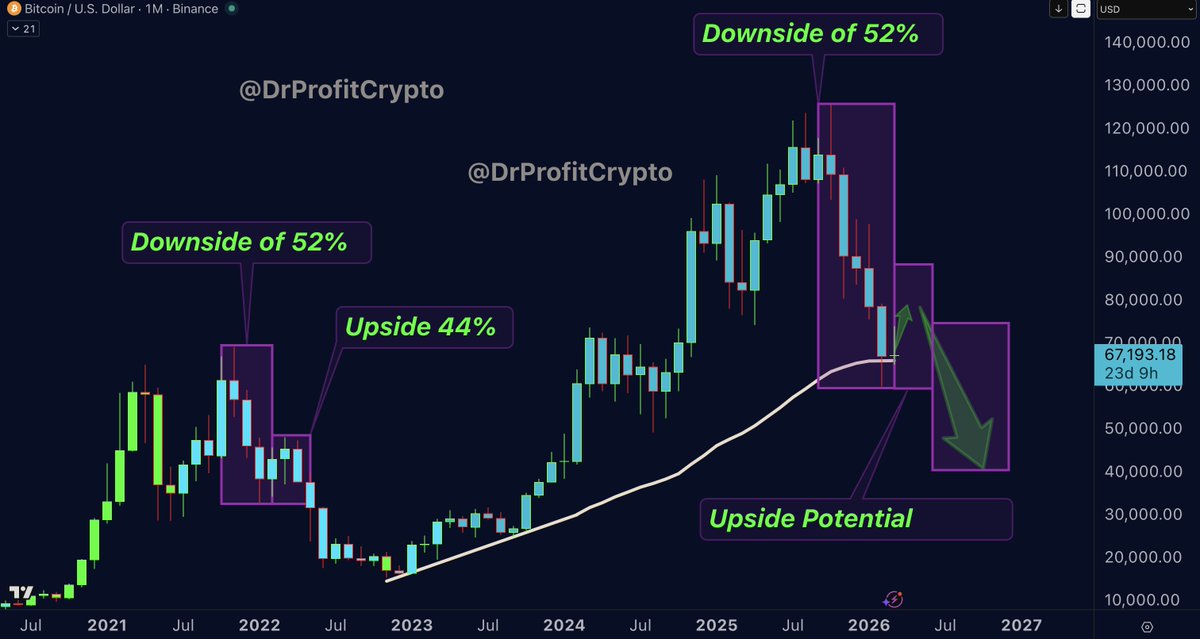
TA / LCA / Psychological Breakdown: In last Month’s Sunday report at 65K, I made it very clear that a new box is forming. I expect Bitcoin to move sideways between 57k and 87k, a 33% range, as already stated. This sideways phase is not bullish, it is the preparation for whats coming in the next months. I expect a leg down after this phase, with a breakdown from the box toward lower targets in the coming months of 44-50k region. One year ago, in 2024, Bitcoin spent an entire year moving inside a box between 58k and 74k. At that time, I repeatedly explained that this box had three main purposes. The most important one was the drawing of future reference lines for the next bear market. I said many times that the 2024 box would play a key role again during the 2026 bear market, in the same price areas. That is exactly what is happening now. Bitcoin is currently trading in a zone where it previously consolidated for an entire year before breaking higher toward 100k. In a bear market context, this same zone is not support, it is structure, and structure eventually breaks. Once the sideways phase is complete, I expect a breakdown below the box.
Bitcoin is entering the phase of relief phase, means sideway move for several weeks with potential bullish moves as shown in the upside potential box. Please compare the charts with 2022, we are repeating the exact move of 2022 in which BTC went down 52% from its ATH, beofre it went up 44% from its low, before the next and strong leg down. Exaclty as what we saw right now! An exact repeat of 2022! Both went down exactly 52% from ATH, and now is the time to start the sideway move. This means Bitcoin that is following the same fractal and has strong upside potential for the coming months before continue going down lower than 60k. The market psycology supports this idea as well as everyone is now scared and the fear and greed is at absolute extreme fear. Before the new leg down happens we need to create additional liquidity in the downside and take the liquidity that was built to the upside. Remember, markets are mainly all about liquidity taking and now is a good time for market makers to send BTC into a relief mode, before the bear market continues.
Current Plan and Range Logic: I am expecting a large sideways movement between 57k and 87k. My clear intention is to buy between 57k and 60k, which is the bottom of the current box. A buy order was hit few weeks ago at 60k and most recently I have bought at 68k. It is critical to understand that the bottom of the box does not mean the final bottom for Bitcoin. It means the bottom of the current phase. I buy 57k–60k for percentage gains, not for the long term plan as I usually do.
As an example, Bitcoin is already up roughly 12% up from the 60k buy entry I shared a few weeks ago, and 2% down from the recent 68k buy order. Does this mean 88k is a guaranteed target? No. It means two simple things. First, Bitcoin between 57k and 60k is in a recovery and bounce phase, which usually includes sideways action. Second, the highest level I expect Bitcoin could reach during this phase is around 88k, depending on the strength and duration of the sideways market. If the market allows a visit to the 88k area, I am open to adding more to my existing shorts that were opened between 115k and 125k and are still fully held.
Positioning and Execution: Some people like to complicate things. From my perspective, it is very simple. I am holding shorts from 115k–125k. At the same time, I placed multiple spot buy orders between 57k and 60k, in addition to the recent 68k buy order. I plan to hold these gains because I expect continued sideways action and no immediate further downside in the coming weeks. I consider 57k–60k the local bottom, not the macro bottom, and I expect this area to be tested multiple times. That is exactly why buying there makes sense to me. There is no reason to sell while upside potential remains. When the moment to sell comes, I will metion once I sold or planning to sell.
Bitcoin will move sideways until it no longer does. The largest and most aggressive long-term bets will be placed much lower, between the 50k level and into the low 40s. That is where I will re-enter with serious size for the next cycle, while taking profits from the 115k–125k short, and thats the area I believe Bitcoin will be finally bottomed out. This area is expected to be hit in September-October as my calculations show, in the meantime? A long and boring sideway as mentioned exactly one month ago.
Why I am Buying Now in a Bear Market? Some ask why I am buying now if I expect Bitcoin to eventually bottom below 50k. The answer is simple: markets do not move in straight lines. Even in bear markets, there are powerful counter-trend rallies. In 2022, Bitcoin dropped from 68k to 33k almost without pause. Then, within two months, it rallied from 33k to 48.5k, a 50% move, before continuing down to the final bottom at 16k. This is how markets work. We are in a bear market. The bounces are temporary and exist to build liquidity for further downside. My ultimate bear market target remains below 50k, in the 40s area. That is where my largest positions will be built. Until then, my short from 115k–125k remains fully open. I am not longing with leverage. I am buying spot between 57k and 60k while keeping the short open.
Join premium here: https://t.co/TvHxOtKhHj
THIS IS NO FINANCIAL ADVICE AND EDUCATIONAL CONTENT ONLY
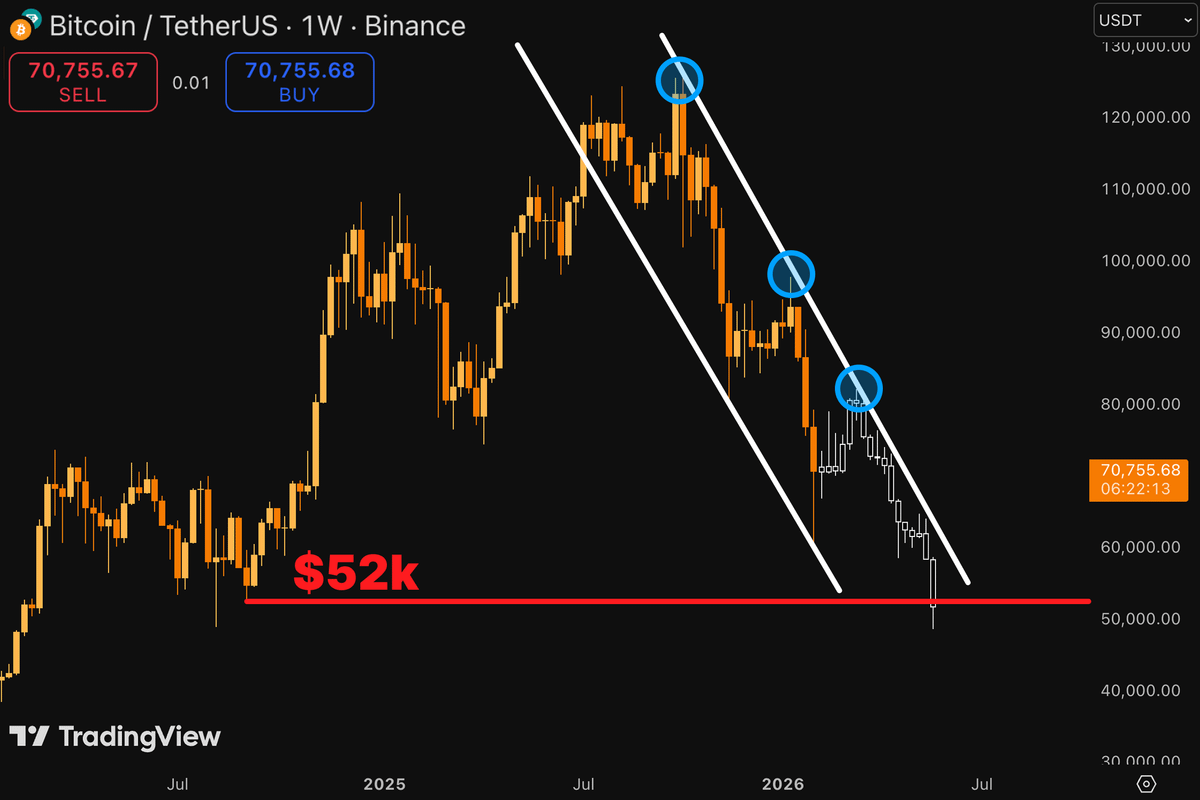
$BTC IS GETTING READY FOR NEXT DROP TO $52k
BTC moving in short channel with clear targets:
$70.7k --> $81k --> $60k --> $63k --> $52k
Note this and turn your notification, see you in a month...
Price expectations for #BTC are as follow:
In the short term, the market still shows limited signs of a potential relief scenario, meaning a temporary bounce or dead cat move could occur before the main move which is to the downside, continues. There are three types of trades: short term, mid term, and long term.
While the mid and long term remain clearly bearish, the short term shows the idea of a relief pump, in other words dead cat bounce, in other words a pump that happen before the next big downside move. This was the reason we took profits on our short positions yesterday and re-entered the market through BTC spot.
As of today, however, the data no longer supports that relief scenario. Therefore, I’ve reversed the short-term positioning, sold the BTC spot and re-entered the short side. Nothing has changed in our broader plan. We are in the early phase of a bear market. While short-term dead cat bounces should be considered and traded when worth it, the big picture remains extremely bearish.
Short Term (This Month): Neutral, yesterday slightly bullish rather than bearish, but with new data its back to neutral, we need more data to give the final short term decision. The short-term direction remains data dependent which is not fully available at this point due to the recent big move. This is why the chart shows the potential of a relief pump.
Mid Term (1–3 Months): Bearish. As in our original plan and main analysis since the region of 115-125k, Bitcoin top was reached and we are in the first days of the bear market. Potential dead cat bounces are possible but all in all the mid term price direction goes clearly to the downside
Long Term (3–12 Months): Also as explained in many Tweets weeks ago, the long term scenario remains extremeley bearish. Nothing changes on this fact that the entire macro economy is set for a global earthquake, and its very close. Closer than most of people believe
#Bitcoin/ Stock market – What’s Next?
The Big Sunday Report: All You Need to Know
🚩 TA / LCA / Psychological Breakdown:
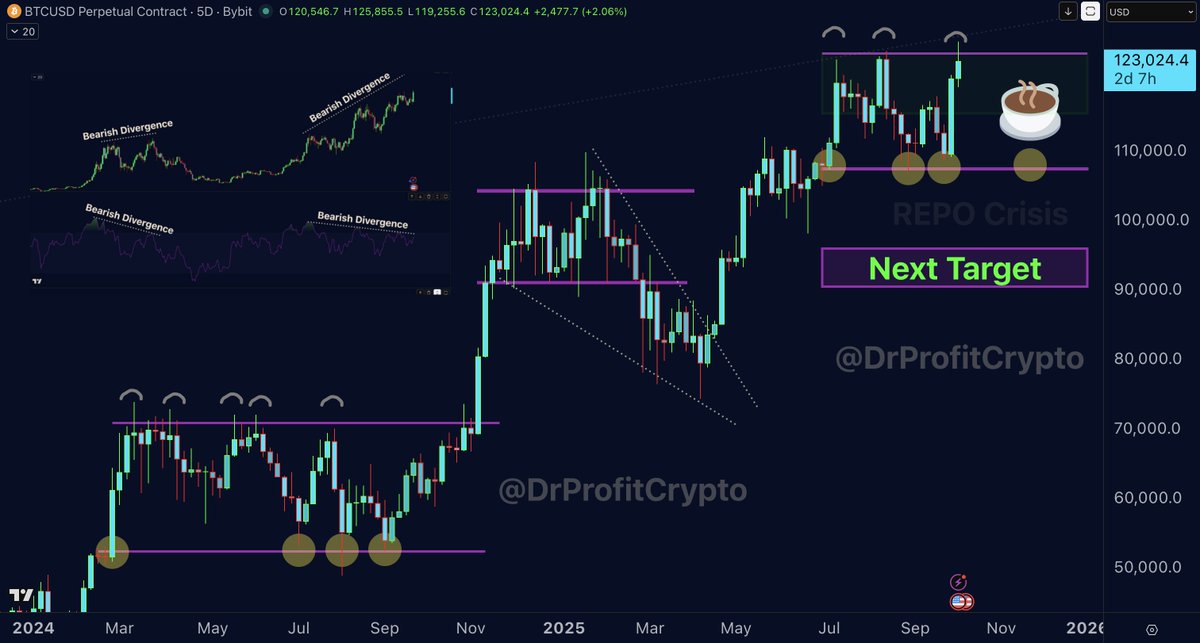
This is the last post I am going to publish this month. I will be back in November, in the meantime I will drink tea, tea and even more tea. The market is entering a highly unstable zone. Yet people cant see or understand due to the euphoria in the market, and yet my Sell Zone of 115-125k region remains a large distribution area in which large players are selling into the crowd that is buying happily not understanding that the sell pressure is not visible yet as retail buyers flow from all directions. While retail sentiment across X remains euphoric and todays fake pump that ended with a downside move after hitting the 125k will provide one more headline in the news "BTC NEW ATH" attracting more retails to jump in. While we see the same pattern in the stock market with record retail inflows since August, financial market indicators are flashing early warnings of a liquidity crunch brewing beneath the surface.
1. The Repo Crisis That No One Wants to See
Every major market correction begins with a liquidity problem hidden in plain sight. Today, that red flag is the Reverse Repo (RRP) market. RRP usage has collapsed from a $2.2 trillion peak (mid-2022) to just $8–10 billion today, a 99% drawdown. This “cash on the sidelines” narrative is officially dead. The buffer that once stabilized interbank liquidity has vanished. Historical parallels (2018, 2019, 2023) show that when RRP dries up completely, markets soon face severe dislocations, repo stress, funding squeezes, or even emergency Fed interventions. The Standing Repo Facility (SRF) is now the only liquidity backstop. If reserves fall near $3 trillion, banks will tap it aggressively, the modern version of “printing in panic.” but it will be too late. Translation: We are one shock away from testing the Fed’s tolerance for financial pain. I keep repeating my words, dont fight the Dollar (DXY) and the golden rise is ahead for the DXY!
2. The “$7 Trillion in MMFs” Myth
A popular claim on X and elsewhere is that “$7 trillion in Money Market Funds (MMFs)” will soon flood equities or crypto. That is 1000% false as MMF capital must flow into T-Bills, repos, or the Fed’s RRP facility, not assets. When MMF cash moves, it DRAINS liquidity from the real market, not adds to it. In short, the liquidity pyramid is tightening from the top down, not expanding.
3. U.S. Banking Fragility
U.S. banks hold roughly $395 billion in unrealized losses (Q2 2025), quietly pressuring balance sheets. History shows: The Fed doesn’t start printing in calm seas, it waits for something to happen. A controlled crash may be exactly what they need before launching QE 5.0
4. Crypto Market:
ETF inflows: BlackRock and other issuers added >$1 billion in BTC and $200 million in ETH last week and Large wallets have slowed but not fully stopped in selling since late September; short-term holders already capitulated in August–September. Bollinger Bands, the tightest since major breakouts, suggest a strong move is near to one or the other direction. Remember: Bitcoin has never decoupled from stock-market liquidity. If equities face a repo-driven shock, BTC will initially dip with risk assets before becoming the first beneficiary of the post-crash liquidity wave. Retail traders are once again chanting the “liquidity flood” myth, ignoring macro fragility. This is the same delusion seen before the 2022 crash, euphoria at the edge of systemic stress. We can see clear FOMO metrics are rising. Leveraged longs are at cycle highs and Yet under the surface, liquidity is collapsing. Since August I have sold my entire Crypto Assets and started to build short positions in the region of 115-125k with current average entry of 119,9k region. My plan is to hold the shorts and consider the current zone as banana zone which is indeed a sideway zone between 115-125k as told in August. Next to the tripple top we also see a massive bearish divergence forming on the weekly chart, the same divergence was the reason for the end of 2021 bull market, we see the same indicator giving us a warning again! A warning that should not be ignored in my opinion! If for any reason BTC breaks out above my 125k level, I need to prepare to hold for several days/ weeks in red before it turns back in profit. My strategy is for the long term and I held my coins for 3 years before selling them all realising a massive profit of 600% in BTC alone or selling ETH at the top of $4,800. More than happy to be positioned well for the upcoming events. In the meantime, drinking tea and relax.
5. MSTR & the Yield-Panic Signal
MicroStrategy raised its preferred-share yields from 10% → 10.25% (up from 9% only weeks ago), a sign of funding strain. Behind the scenes, Saylor’s “Bitcoin flywheel” ($MSTR → $STRC/$STRD/$STRF preferreds) is losing traction. Constant share dilution has eroded MSTR’s mNAV premium, now underperforming BTC by ~25% in 6 months. New preferred issuances try to mask liquidity gaps with double-digit dividends, an unsustainable model unless BTC keeps rising faster than issuance. Without fresh inflows, the structure risks becoming a closed-loop Ponzi flywheel, similar in dynamic to Terra/Luna and the reason for the next bear market.
6. Inisider Selling: Since August we see the largest amount of Insider sales in the last 2-3 years, till this day insiders continue to dump their own shares into the market in a massive speed. At the same time we have the largest retail investor inflow as well! This mix is highly toxic and usually occurs at cycle tops!
Question for the Bulls: If you believe 140k will hit before the bear market starts that’s only 14% higher from here. Are you really willing to risk everything for a possible 14% move? What if the market never reaches 140k? You’ll be stuck holding, waiting for a top that never comes, and end up selling much lower, or not selling at all. This is how every cycle ends for most people: “I didn’t take profits.” See you in a month! Premium will remain active and updated as usual.
Overall market remains very bearish at a macro level, and even bulls in Crypto or Stocks agree that the bear market will start in the end or after Q4. In the meantime, we see the final rat race I am not taking part in. Instead, I start to short in anticipation on whats coming!
Join premium here: https://t.co/4ilNrRrtAu
Trade with DrProfit on BloFin: https://t.co/BfOK8FYGfj
THIS IS NO FINANCIAL ADVICE AND EDUCATIONAL CONTENT ONLY


![DrProfitCrypto's tweet photo. #Bitcoin – What's Next?
The Big Sunday Report: All We Need to Know
🚩 TA / LCA / Psychological Breakdown:
THE FINAL TRAP: Today I want to speak about the most important development on the chart right now, and it is going to be very interesting. I am watching the MA200 weekly closely, and what we are seeing is what looks like a retest of the MA200 weekly. Hold on, this is exactly the moment where things get dangerous. Let me take you back to 2022 to explain what is loading right now. In 2022, Bitcoin lost the MA200 weekly and everyone believed it was over. Then something happened that trapped everyone. A few weeks later, Bitcoin regained the MA200 weekly, and not only that, BTC printed three weekly closes above it. Bitcoin pumped 10% above the MA200 weekly in 2022, and guess what happened with the narrative? Everyone thought the bottom was in. "Wow, MA200 weekly reclaimed, this is bullish, the bear is over." This is exactly what they said. And so many bought right above the MA200 weekly, believing it was the confirmation they needed. Just to get trapped again. This was the final trap, and this is what led directly to the capitulation event. The reclaim of the MA200 weekly in 2022 was not the bottom signal, it was the trap that preceded the final flush to 15-16k.
Why This Matters Right Now:
Look at where we are today. Bitcoin lost the MA200 weekly. And now BTC is doing exactly what happened in 2022. It is testing the MA200 weekly from below, and there is a very real possibility that we see the same repeat. So in my idea there if we see a weekly close above MA200 Weekly, it will be definitely a trap! And for this case I told two weeks ago at 60k that I am placing short orders at 68-69k in case market allows to visit. This is exactly the setup I have been warning about for the last two weeks when I spoke about the white and blue lines converging and the death cross loading. The MA200 weekly retest is the key ingredient of the final trap, and history is about to repeat with almost perfect timing.
The reason this trap works every single time is because retail cannot resist a reclaim of a major moving average. When Bitcoin closes above the MA200 weekly, every one will be bullish and start FOMO buying. And this is exactly why it works. Market makers need this trap to build the maximum amount of long liquidity before the final flush. Without this trap, the capitulation would not have enough fuel. The final trap is what generates the liquidity for the final flush. This is how bear markets always end, and this is how this one will end too.
Why This Aligns With the CBB
If the 2022 pattern repeats, the final flush after the trap lands us directly at the CBB, the 40-50k zone where the BlackRock ETF launched. My timeline of September-October 2026 for the bottom aligns perfectly with the timing of a MA200 weekly reclaim happening now, followed by a fake bullish move in July-August, followed by the final rejection and capitulation in September-October. Every piece of the puzzle continues to fit. (Visit our website: https://t.co/oP8wCPuO9J) The 2022 playbook, the death cross setup, the aSOPR realized losses, the MA200 weekly trap, and the CBB target all point to the same conclusion.
My Positioning
Both shorts remain fully open. The 120k big short and the 80,500 average are in deep profit. New short orders at 68-69k remain prepared in case the market allows another visit. The plan is for the macro move toward the CBB, but the sideways zone between 57-68k is not over yet. I would not bet on an upside move, but I would bet that if the market allows another visit to 68-69k, I add more into my shorts. I am not interested in adding below this zone. If the MA200 weekly reclaim scenario plays out and BTC pumps 10% above the line, this is the perfect zone for me to add aggressively.
Calendar This Week:
FOMC minutes from the June 16-17 meeting release Wednesday July 8 at 2:00 p.m. This is a major event because it was Warsh's first FOMC as Chair, and the meeting delivered a clear hawkish shift with the median federal funds forecast implying the potential for one rate HIKE before year-end 2026, not a cut. Exactly what I predicted in the June 14 Sunday report when I said the dovish pivot would not be delivered cleanly. The minutes will show how divided the Committee was and how strong the hawkish argument was internally. Any confirmation of the hawkish tone will give us more sell pressure. Initial jobless claims Thursday July 9. Consumer credit data also Wednesday July 8.]
Join Premium: https://t.co/oP8wCPuO9J
THIS IS NO FINANCIAL ADVICE BUT EDUCATIONAL CONTENT ONLY.](https://pbs.twimg.com/media/HMfEF-8WMAAz6g0.jpg)