$SOL
Same story as $ETH, finally some sellers got trapped and a better recoil happened.
Lovely to see!
Anyways, here I have collected/ made some new charts👇
1. My short term $SOL chart.
2. My HTF $SOL chart with draws of buy-side liqudity + key weekly levels.
3. Short term poi’s to look for triggers.
Let’s see how this develops, mega interesting week ahead!
Trade on WEEX for best bonus https://t.co/CTACLXTuyV
$NEAR Look at this chart. NEAR is bleeding from $3.55 and just bounced off $2.87. Right now it's stuck at $3.16.
Sentiment is weak at 56%. Volatility is moderate. This sideways chop isn't a reversal—it's the market catching its breath before the next leg down. Retail is getting baited into longs. Don't be exit liquidity.
Direction: BEARISH
Entry Zone: 3.16 – 3.19
Stop Loss: 3.25
TP1: 3.09
TP2: 2.95
Price keeps rejecting higher levels. Momentum is gone. Take the short, secure profits, move on. Simple.
#XAUUSD#GOLD | H4 Analysis
Gold broke below the previous low, the decline isn’t over yet!
We were watching last week’s low, and the price has now broken below it. That’s why we expect the decline to continue toward the lower boundary of the channel. The real rally will begin from there.
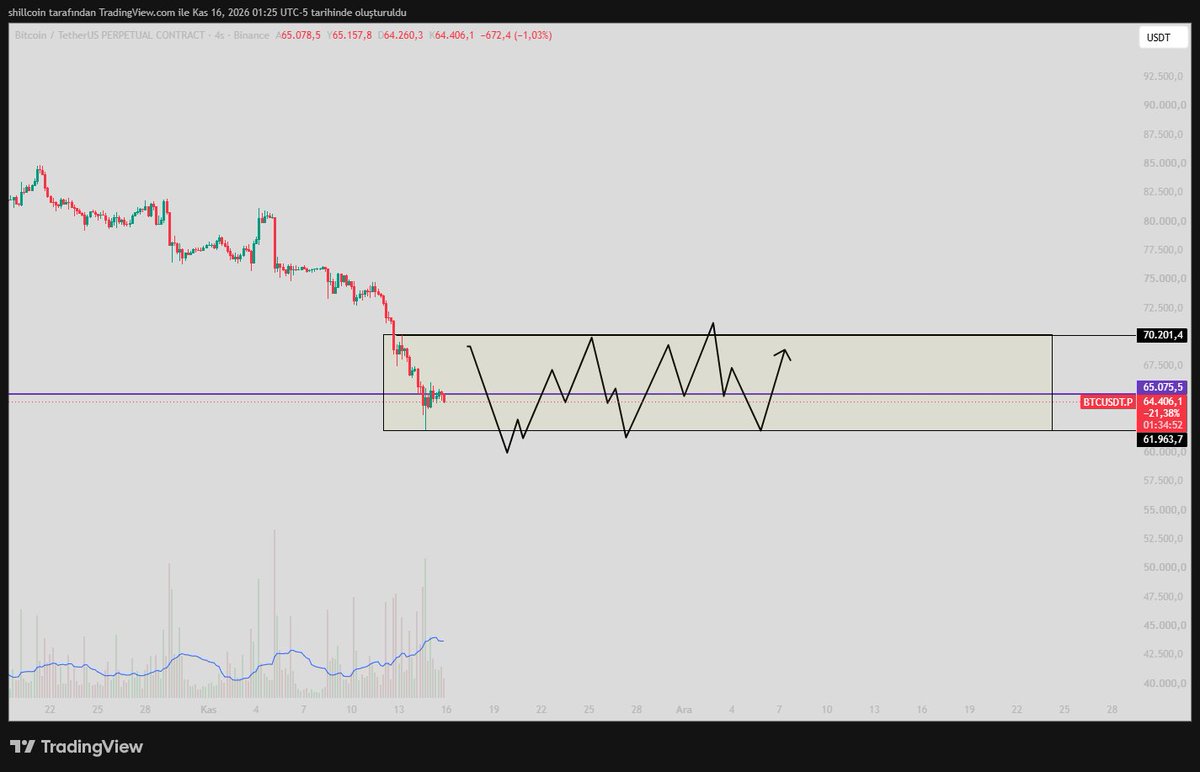
Bitcoin Beklentim daha büyük bir hareket için yataylık...
Tekrar tekrar her gün yazacağım bunu..
Grafik seviyeleri sadece temsili olup hareket tarzını çizmiş bulunmaktayım.. $btc
What if $ARB is preparing its next comeback while everyone is busy writing its obituary?
Price is testing $0.1276
A reclaim of $0.1484 could make more spicy
My upside target is at $0.30
Would you take this setup or wait for confirmation?
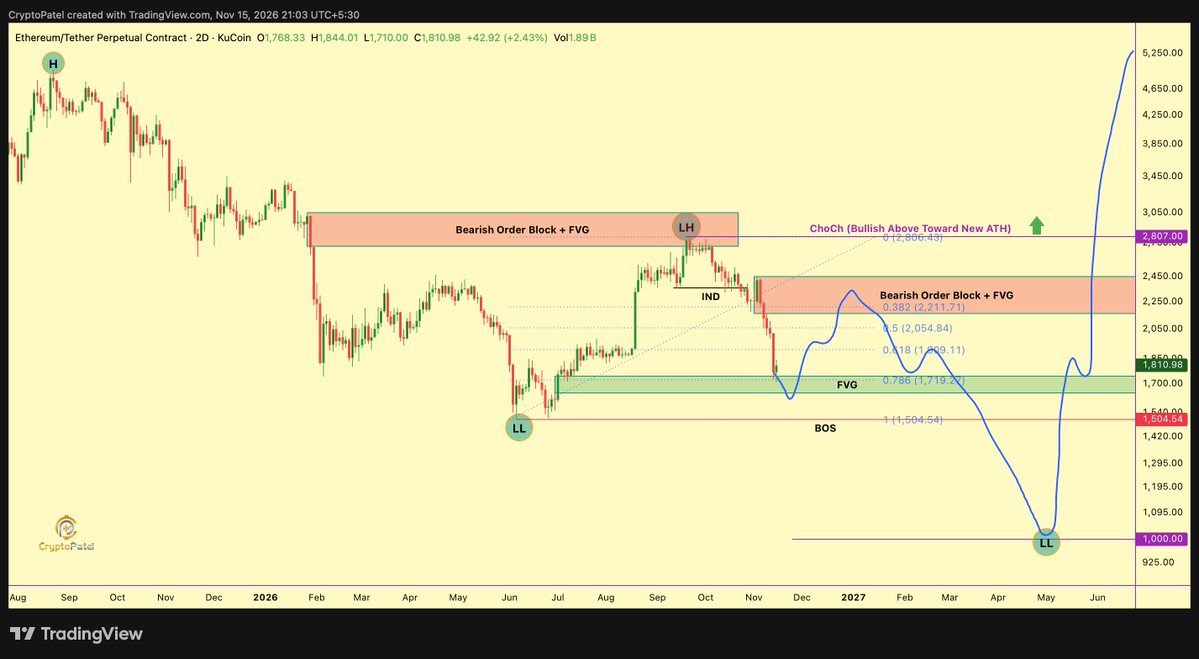
If $ETH fails to hold the $1,719 level (0.786 Fib), I’m expecting another leg down, potentially making a new lower low toward $1,000.
As painful as that sounds, it could be one of the best long-term accumulation opportunities.
On the bullish side, $2,807 is the key CHoCH level. Until we get a HTF candle close above it, ETH remains in a bearish phase.
A confirmed break above $2,807 could finally open the door for a new bullish rally toward ATH.
Until then, I’m not calling for a trend reversal.
Protect your XRP the right way. Establish a properly structured irrevocable trust, secure your assets through self-custody, and build your LLC with the right foundation from day one.
Message me "STRUCTURE" for guidance.
#XRP#Ripple#XRPArmy#XRPCommunity#XRPLedger#Crypto
🚨 $BTC $82K BULL TRAP PLAYBOOK IS REPEATING
I called that $87K was a bull trap, and the pattern is looking familiar to a drop from $82K → $57K.
Everyone expects the dump to be over, a short recovery brings buyers back in, and fresh shorts pile on.
A sweep below the previous low would catch both sides off guard, liquidating late longs and overconfident shorts in the reversal.
I'm calling this a potential bear trap, with $57.5K as the key downside level.
Same market, same playbook.
Don't get trapped on either side.
Protect your XRP the right way. Establish a properly structured irrevocable trust, secure your assets through self-custody, and build your LLC with the right foundation from day one.
Message me "STRUCTURE" for guidance.
#XRP#XRPArmy#Ripple#XRPCommunity#Crypto#CryptoNews#FYP
Im seeing $PEPE some interesting point at that moment
$PEPE accumulation long time in the box before breakout zone 🚀
One day, $PEPE could reach a $100B market cap, but not anytime soon. ✍️
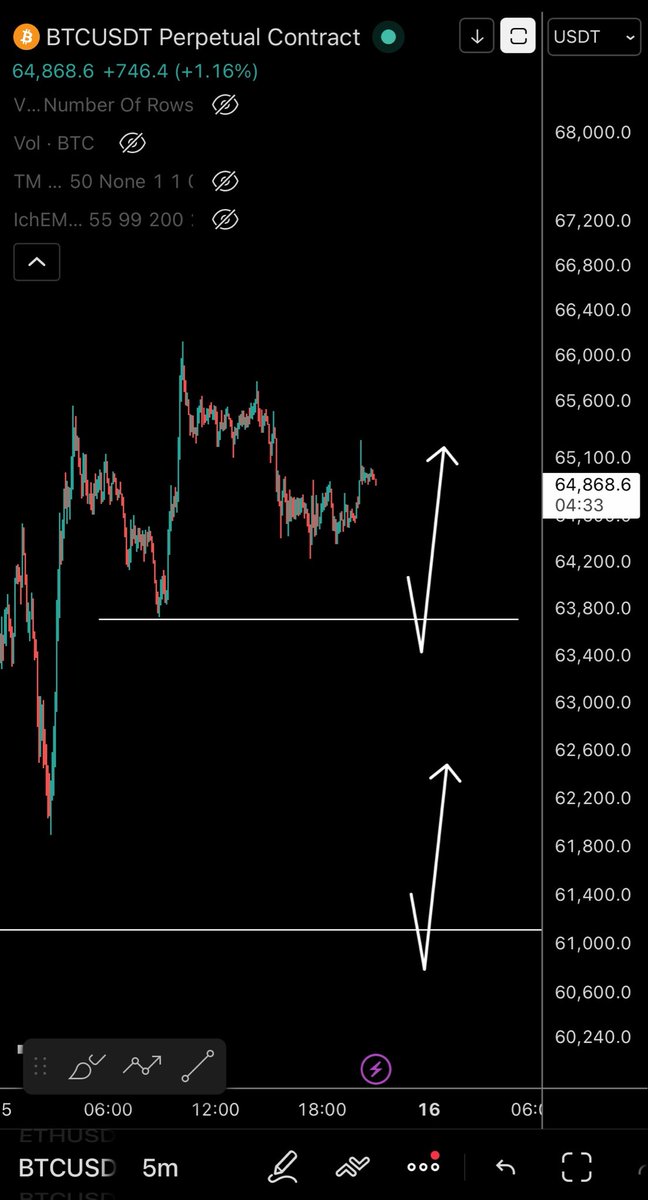
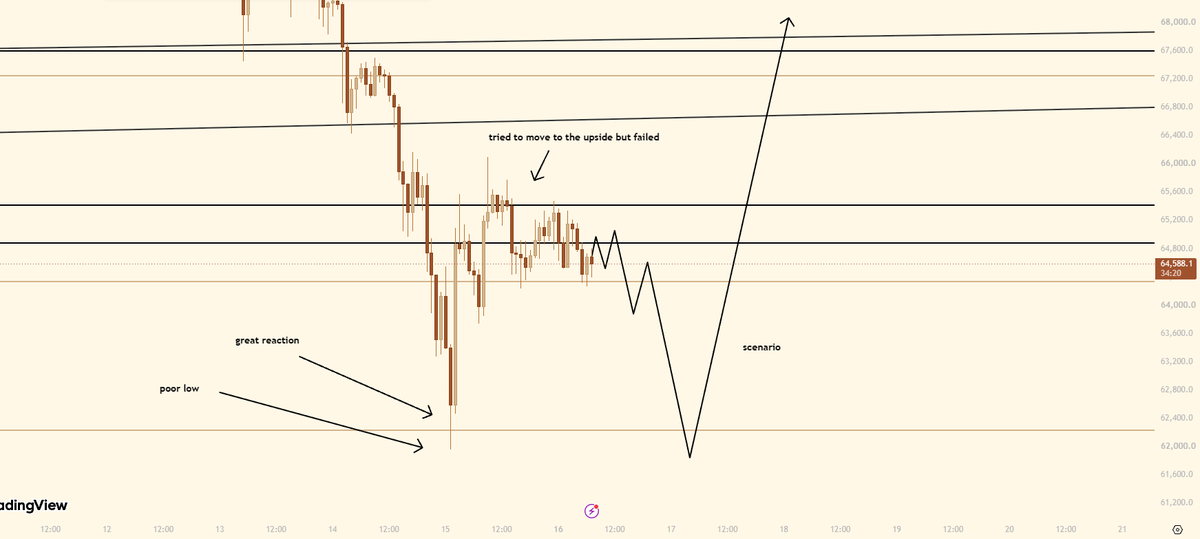
$BTC - Idea
Poor low formed, my pathway was correct for the most part, we just didn't respoect my zones and showed no bullish strength, that's why we dropped to our last hope which was the 62250, now below 62250 I have 59785 as a support, that will also be max pain for me, if we break 59785, then, you know what will happen...
I am looking something as the pathway shows, a take out of the poor low followed by a super strong bullish move up, in my opinion shorts only seem so reasonable here.
Break 65423 and the zone 66700-67898, and then we'll definitely see higher prices.
For now this should be enough, and do remember to keep DCAing, we retraced the full pump so here's your chance, take it.
$FIL is trading around $0.60.
And this weekly chart is showing an extreme long-term reversal setup.
Back in 2021, $FIL experienced an explosive rally above $200.
Then everything changed.
Years of relentless selling pressure pushed price toward its historical lows.
But here's what's interesting.
$FIL is now trading near a massive liquidity zone after one of the longest corrections in its history.
The chart projects an extreme 60,706% expansion from its marked historical base.
Here's my roadmap:
$2 — First resistance.
$5 — Recovery checkpoint.
$10–20 — Major resistance zone.
$50 — Bullish continuation.
$118.867 — Target 1.
$237.390 — Target 2.
$430.211 — Target 3.
$775 — Extreme bull scenario.
But first, buyers need to establish higher lows and reclaim $2 with strong volume.
A sustained breakout above $5 would strengthen the bullish case.
The 60,706% projection is extraordinarily speculative. Reaching these levels would require enormous capital inflows.
And there's no guarantee this liquidity zone will hold.
Still, if $FIL manages to reverse its multi-year downtrend, the recovery could become significant.
After years of decline, could the next major cycle finally change everything?
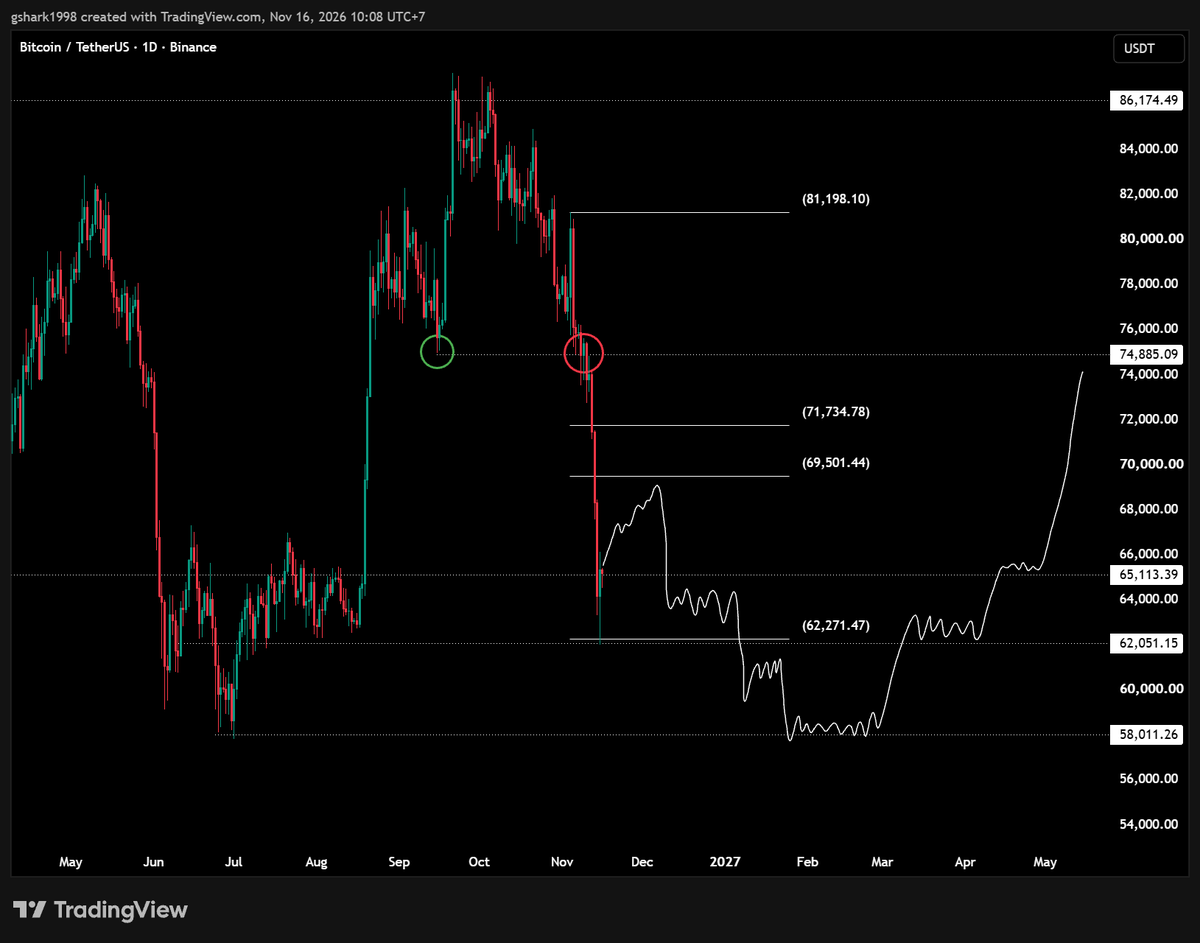
$BTC update
called this dump when BTC lost the $74K support, and now i'm watching for a potential recovery wave toward $69K-$71K before another leg down.
my current thesis is a retest of the $58K level before the next major bull wave begins.
important note: i'm not looking to long anything here. i'll patiently wait for a short signal if you're trading perps.
we don't fight the trend. we wait for confirmation and let the market come to us.
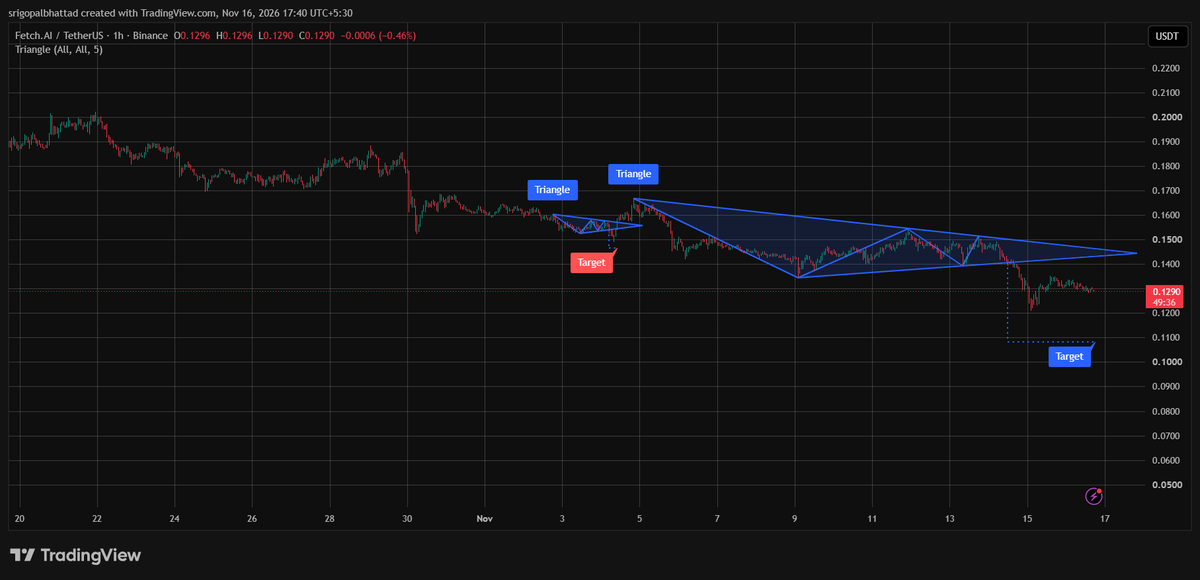
$FET – https://t.co/ESdyDVe3ur 👀
A major Triangle Pattern has formed on the 1-hour chart, but price has already broken below the ascending support near $0.14. Bears currently have the upper hand.
Price is consolidating around $0.129. Reclaiming $0.14 is crucial for bulls, while continued weakness could expose the $0.11 zone 📉
$FET needs to reclaim support before a bullish reversal can take shape. Critical level to watch! 🔥
#FET #FetchAI #CryptoTrading #Altcoins #TechnicalAnalysis
$AVAX Channel Bottom Meets ETF Launch. This Is The Setup 💁♀️
Avalanche is testing the lower border of the descending channel on the daily chart, with recovery momentum building right at this crucial boundary.
And the timing could not be better. Bitwise’s spot Avalanche ETF just launched on the NYSE with staking built directly into the fund. Wall Street is here.
Target levels after a confirmed bounce:
🎯 $8.20
🎯 $9.00
🎯 $10.50
🎯 $12.00