Your timeframe changes everything.
➤ 1-minute: Noise
➤ 15-minute: Setup
➤ 4-hour: Structure
➤ Daily: Perspective
Sometimes the problem isn’t your strategy.
It’s the timeframe you’re trading.
GPT-6 Astra builds the MOST POWERFUL quant trading agents
this open source repo has 101 profitable quantitative TRADING STRATEGIES along with EXACT MATH behind every model
i plugged these strategies into my Astra stack along with AgenKit harness & now my 24/7 trading bot runs them as production agents
here is how you can set it up:
1. clone the repo (github link in replies) of 101 quant trading strategies
2. install https://t.co/nb6gGfhcEU into Codex CLI with GPT-6 Astra model, fire JUST one prompt to build mean reversion strategy from the spec, then Astra + AgenKit ships a full working strategy in mins
3. real strategies inside like Ornstein-Uhlenbeck stat arb, Avellaneda-Stoikov market making, Heston volatility, FX carry, momentum with skip windows, covered calls with expiry grids
4. every strategy passes the validation gates with Sharpe above 1.5, drawdown below 15%, hit rate above 55%, t-stat above 2.0, walk-forward across 5 years
5. each spec ships with Kelly-sized positions, 5% drawdown kill switches, delta-neutral hedging, and intent blotter output so nothing routes live by accident
6. 10 specialist agents inside AgenKit handle spec review, quant architecture, test-first build, two-stage review and ship your trading bot
EXACT system (in depth) which I am running with GPT-6 Astra is in the article below:
1st year of Trading
Blew the account.
No risk management.
Overtrading every breakout.
2nd year of Trading
Failed again.
Revenge trading.
No stop-loss discipline.
Chasing signals from Telegram gurus.
3rd year of Trading
Still failing.
Ignored market structure.
Didn’t understand liquidity & manipulation.
Emotional entries, emotional exits.
4th year of Trading
Studied price action.
Learned support & resistance.
Discovered supply & demand.
Backtested strategies.
Still inconsistent.
5th year of Trading
Understood risk-to-reward.
Focused on capital preservation.
Mastered patience — waited like a lion for clean breakouts.
Started journaling trades.
Finally profitable.
6th year of Trading
Built a system.
Respected psychology.
Controlled greed & fear.
Compounded small wins.
7th year of Trading
Started sharing knowledge.
Built a brand.
Started selling courses.
And became a Mentor.
"How do I start posting online"
- Pick a fucking idea
- Stop trying to find the perfect one
- Write the first thing that comes to mind
- Rewrite it slightly better, then post
Just get in the habit of writing out interesting ideas and trust that you'll get better over time (you know, how everything else in life works).
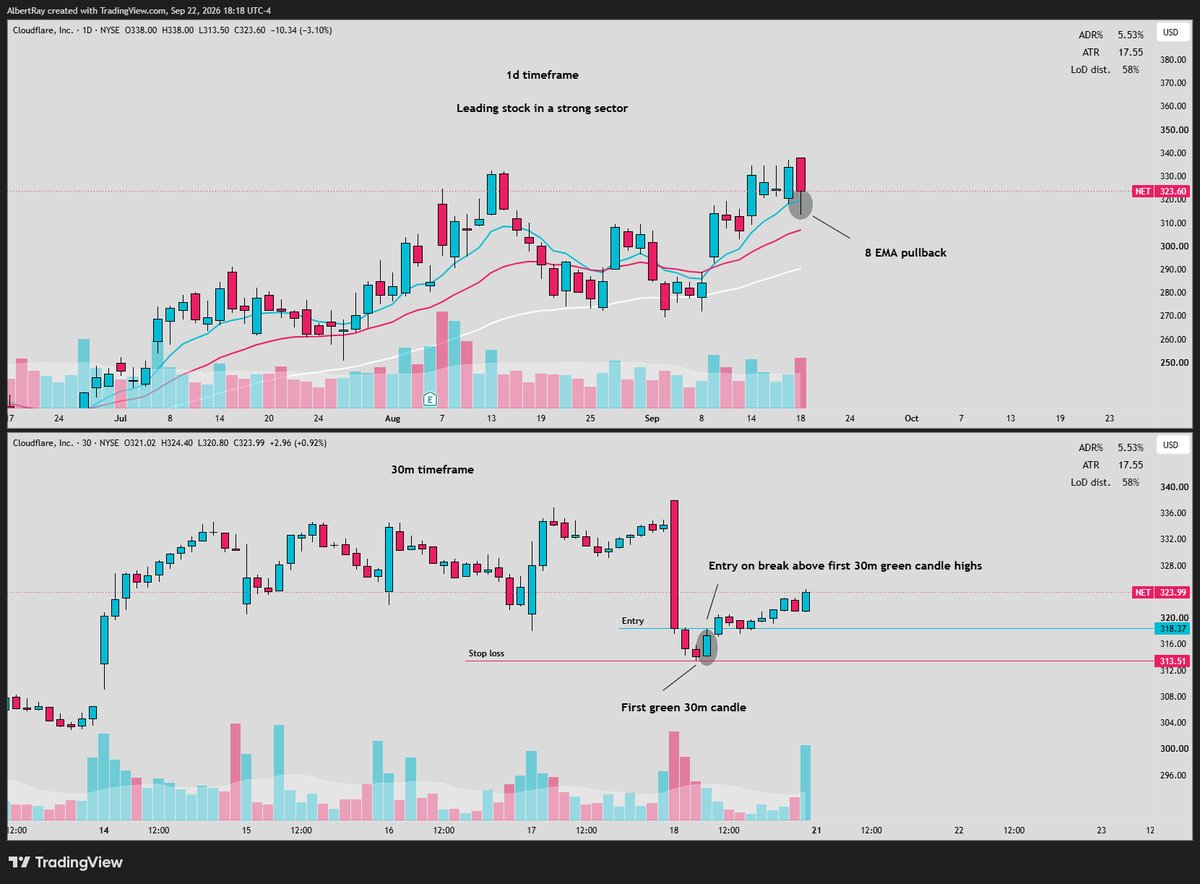
One of my favorite entries in the market:
Buying pullbacks on leading stocks using the 30 minute pivot, learned this concept from @1ChartMaster
A lot of traders know how to find strong stocks...
The problem is they have no idea WHERE to enter them
They either:
-Chase the initial breakout
-Buy randomly during the pullback
-Or wait so long that they miss the next move
This is where the 30-minute pivot can become extremely useful.
First, I want to identify a LEADER
I'm looking for a stock that has already proven itself:
Broke out of a major base
Expanded on strong volume
Made a multi-day move higher
Is outperforming the market/sector
Is trading in a clear uptrend
Then I wait.
I don't want to chase a stock that's extended from its moving averages.
I want to see it PULL BACK and give me another setup.
Ideally, that pullback starts becoming controlled:
-Selling volume decreases
-Candles tighten up
-Price starts respecting the 8/21 EMA
-The stock stops making aggressive moves lower
Then I drop down to the 30-minute chart
What I'm looking for is a clear pivot to develop...
The first 30m green candle that forms off the key moving averages tells me that buyers are regaining control
If price can break that 30-minute pivot with strength...
I'm no longer trying to GUESS where the pullback ends
I'm allowing PRICE to show me that momentum may be shifting back toward the direction of the larger trend
My process comes down to this:
Daily chart = tells me WHAT I want to watch.
8/21 EMA = tells me WHERE I want to pay attention
30-minute pivot = helps me identify WHEN momentum is potentially returning
That combination keeps the process simple
Leader + Pullback + Key EMA + Tightness + 30-minute pivot
Instead of chasing strength on extension
I want to let the stock come to me, build a structure, and then wait for confirmation.
You don't need to catch the exact bottom of every pullback.
You need a repeatable process for identifying when the stock is starting to act right again.
These are the closest 3 exactly like $AMD what do you think?
1.$NVTS — $11
Hated chip name, revenue already troughed, now an $NVDA partner on the 800V AI factory power stack. Nobody's looking.
2.$POET — $8.50
Photonic interconnects inside AI data centers. Ran from $4 to $20, round-tripped back. The reset is the entry.
3.$RGTI — $15
Down 74% from its high. Quantum sentiment is washed out. This is exactly what AMD looked like before the rerating.
Beaten down. Real technology. Attached to the biggest capex cycle in history.
That's the $AMD playbook.